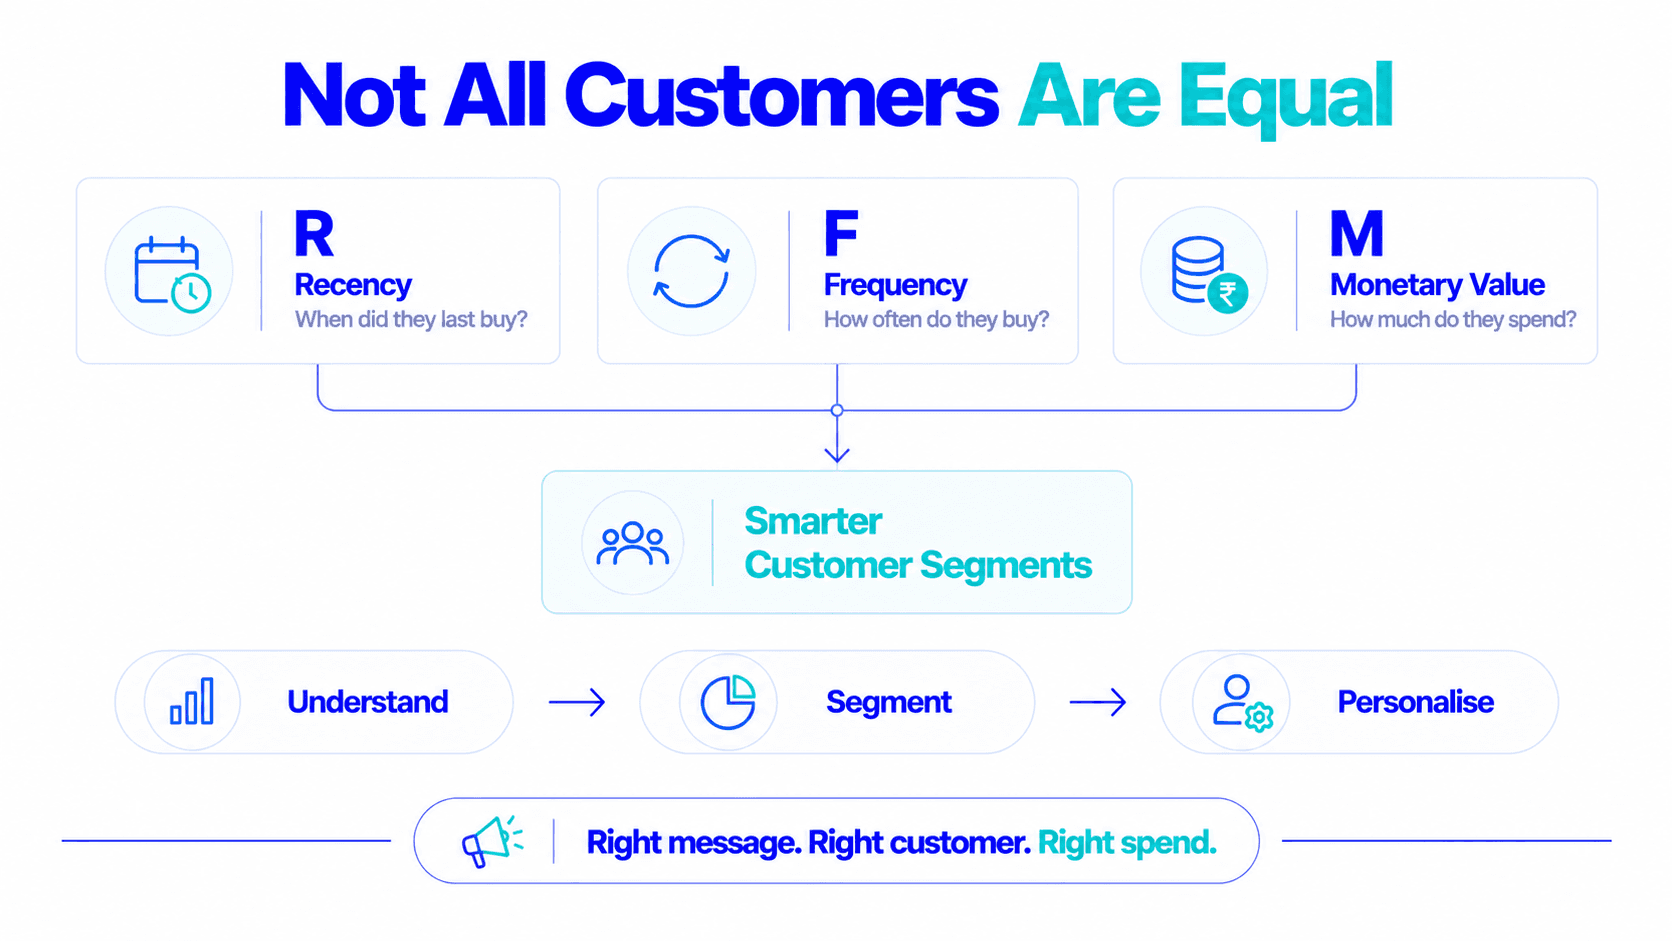
Customer Segmentation for D2C Brands: How to Segment Customers and Advertise to Each One Profitably
Your ₹12,000 Champion and your ₹800 one-timer get the same email and the same ad. Six RFM segments and the strategy and spend each one deserves.
Comparison guides, deep dives, and strategies for D2C brands and agencies who optimize for contribution margin — not just revenue.

Your ₹12,000 Champion and your ₹800 one-timer get the same email and the same ad. Six RFM segments and the strategy and spend each one deserves.

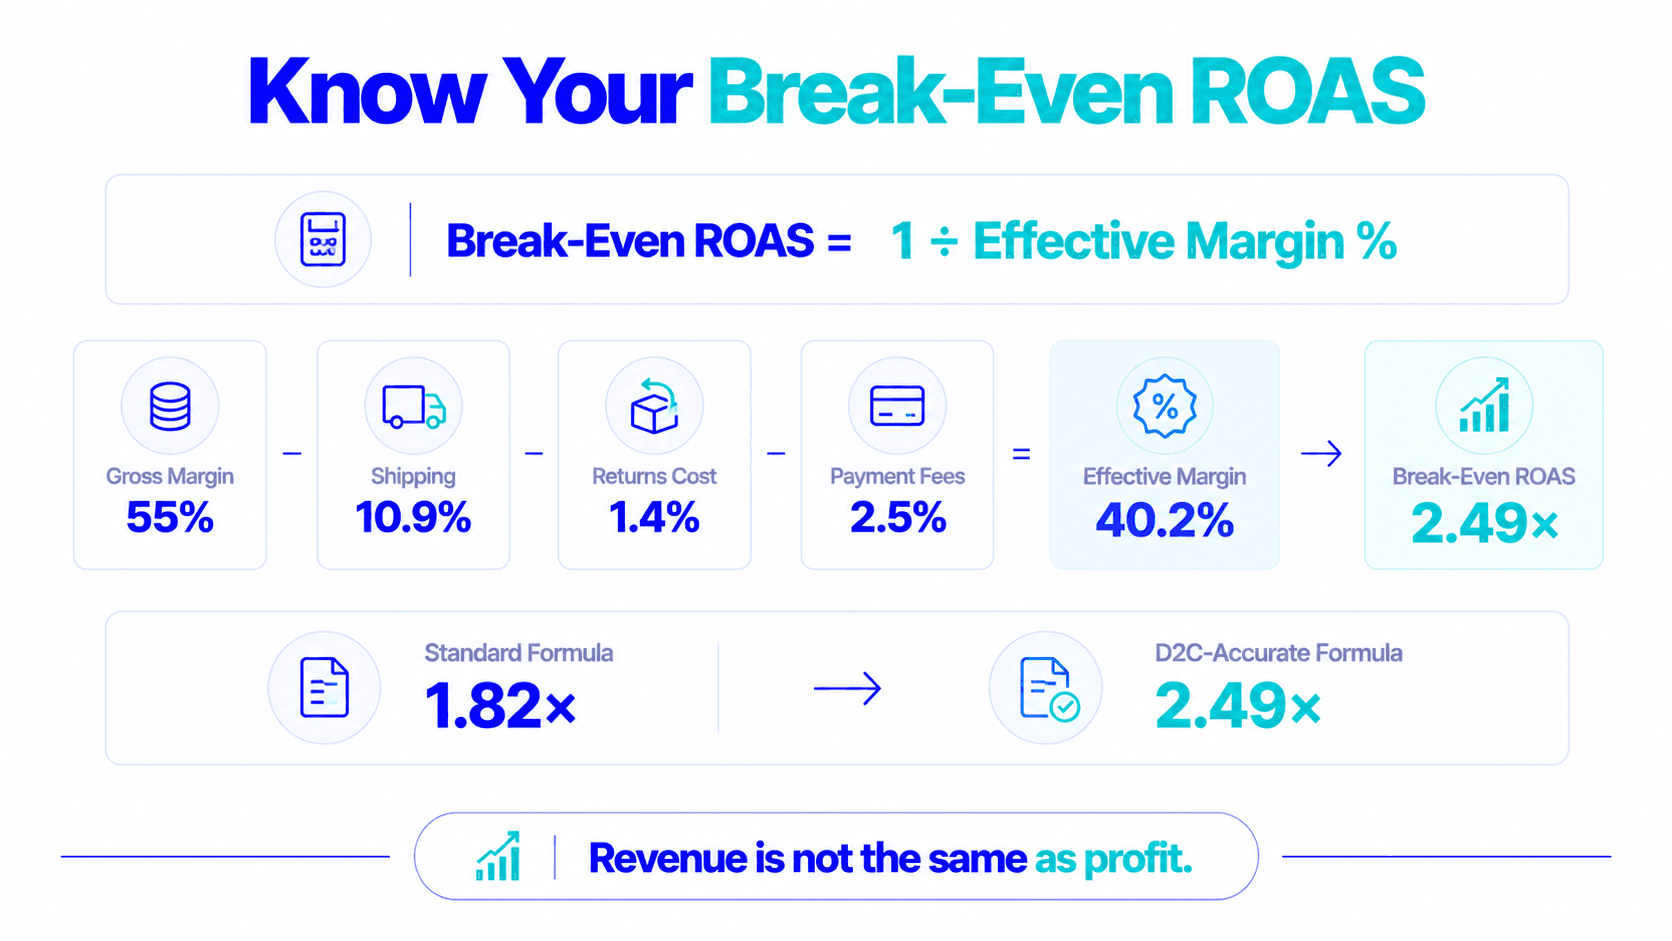
The textbook formula says your break-even ROAS is 1.82x. Once shipping, returns and payment fees are in, it's 2.49x. The gap is where D2C losses hide.

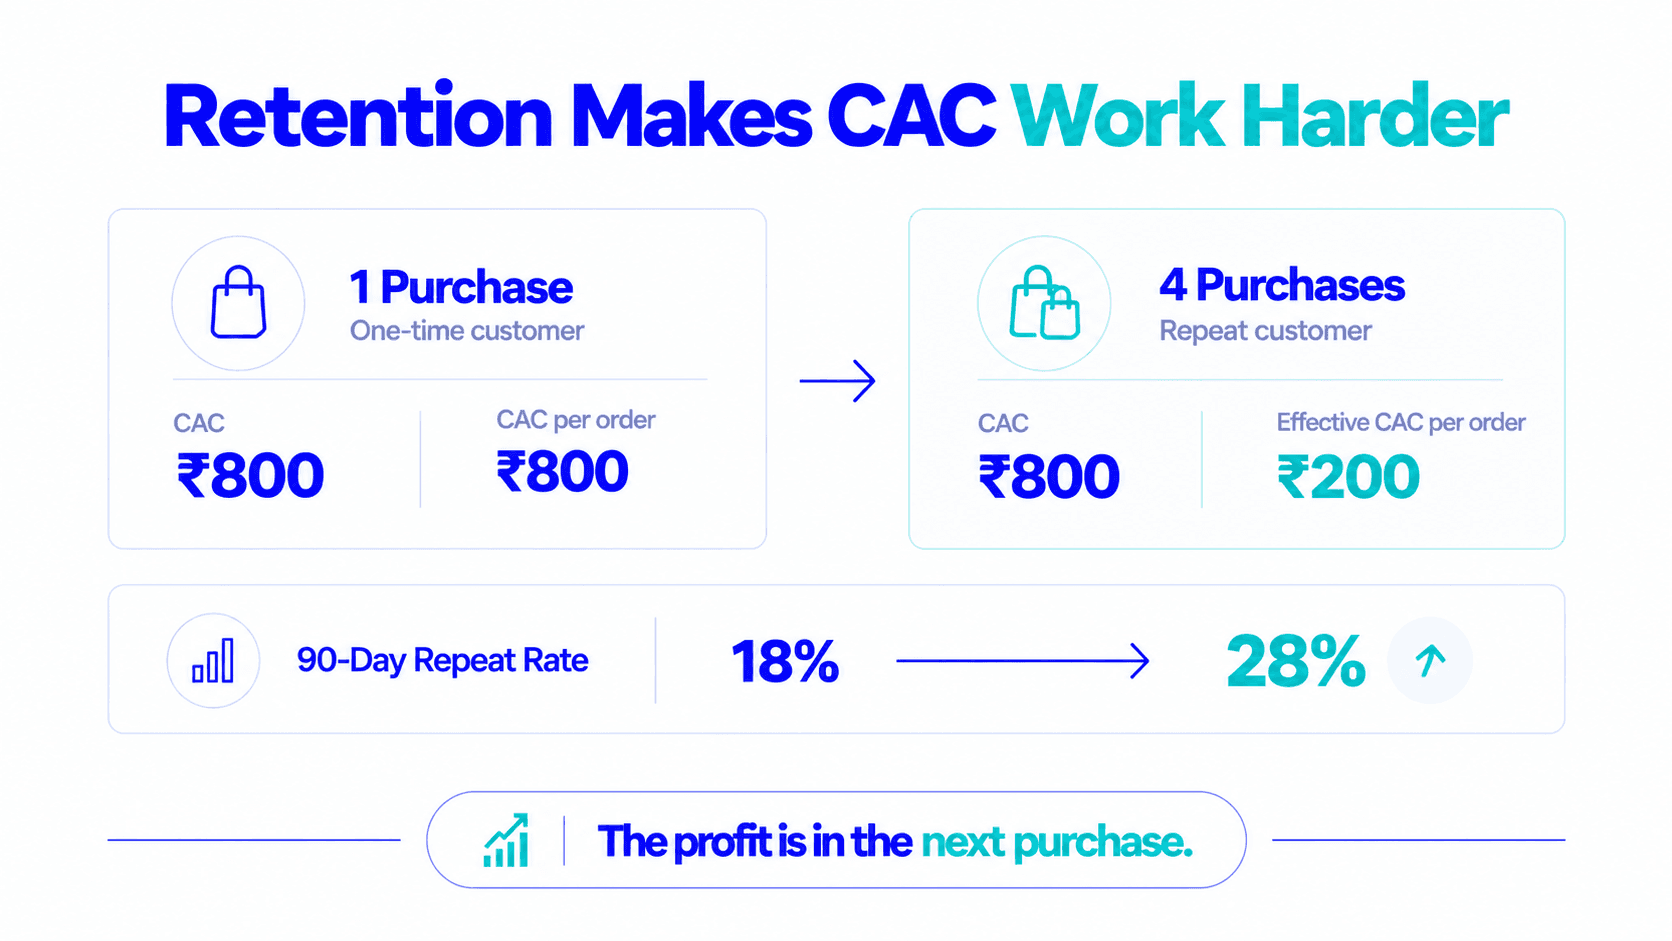
The first purchase is the most expensive thing in D2C. The four retention pillars and the math that shows why retention compounds and acquisition doesn't.

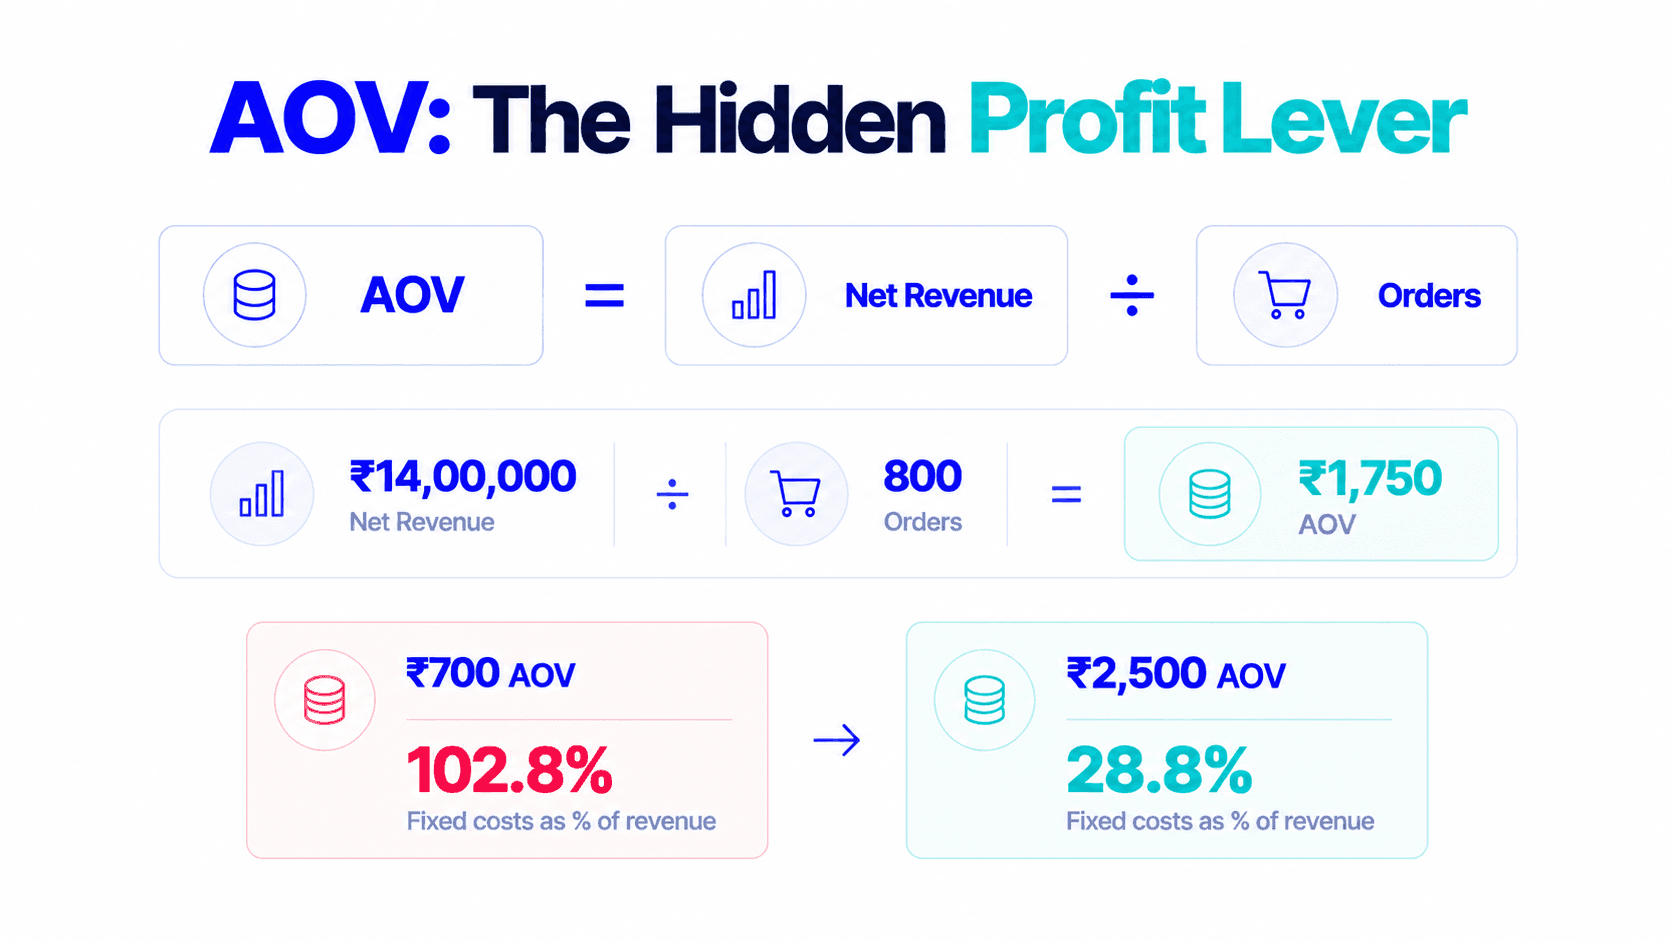
A 30% lift in AOV can turn a loss-making campaign profitable without a rupee more in ad spend. The formula, category benchmarks and seven proven levers.

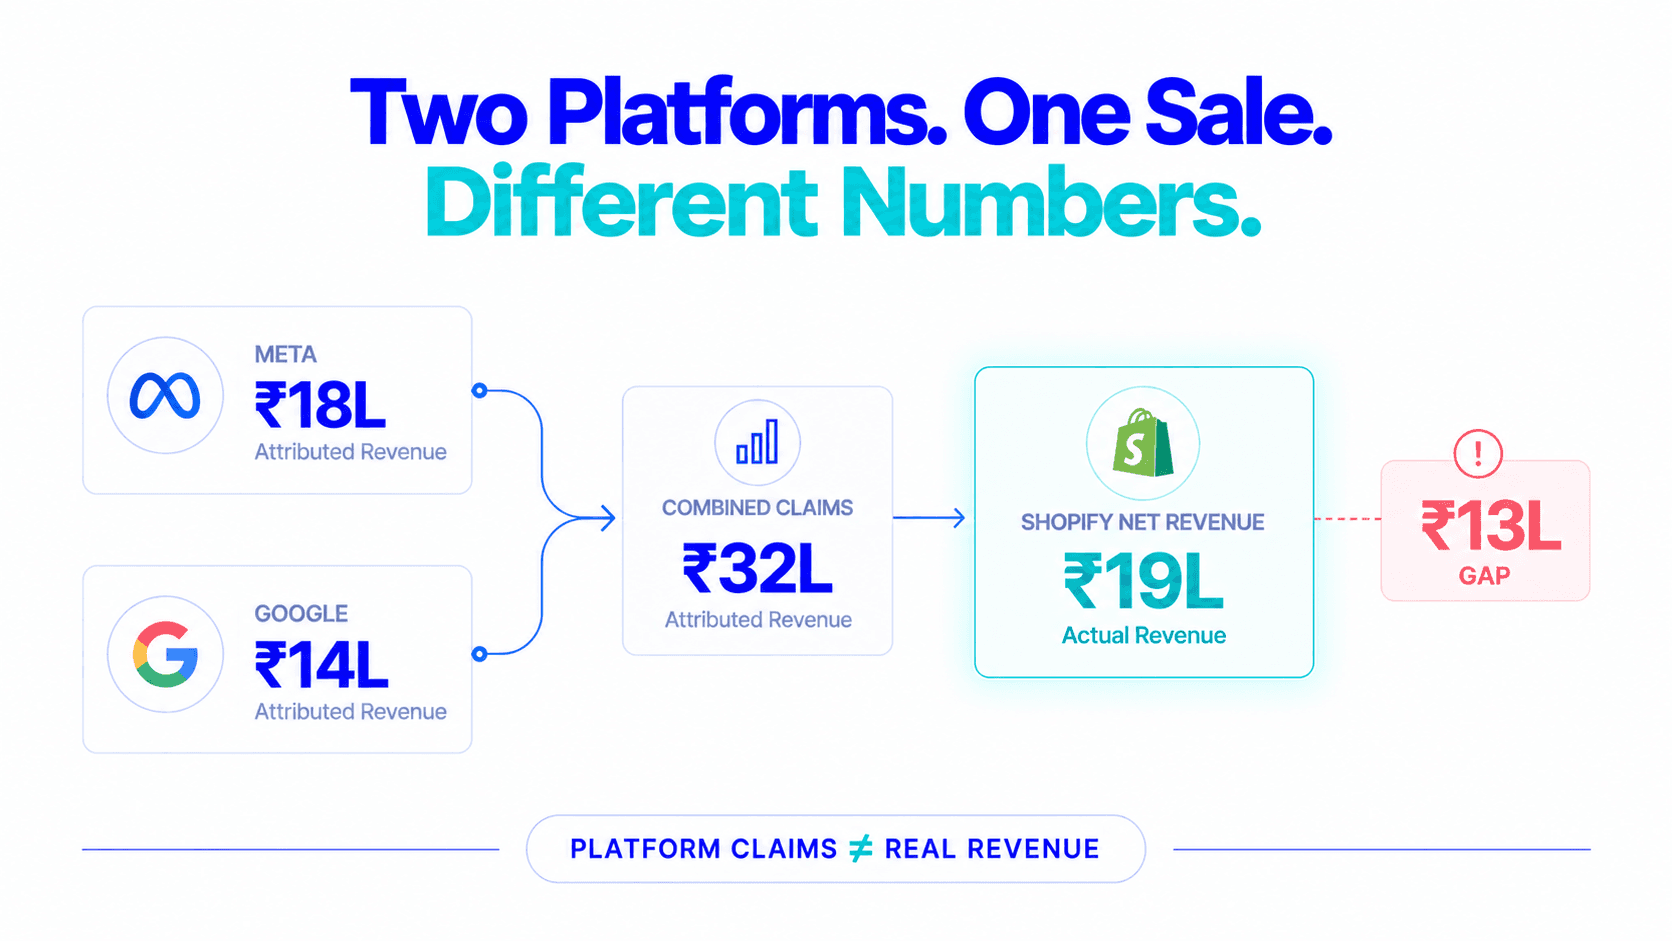
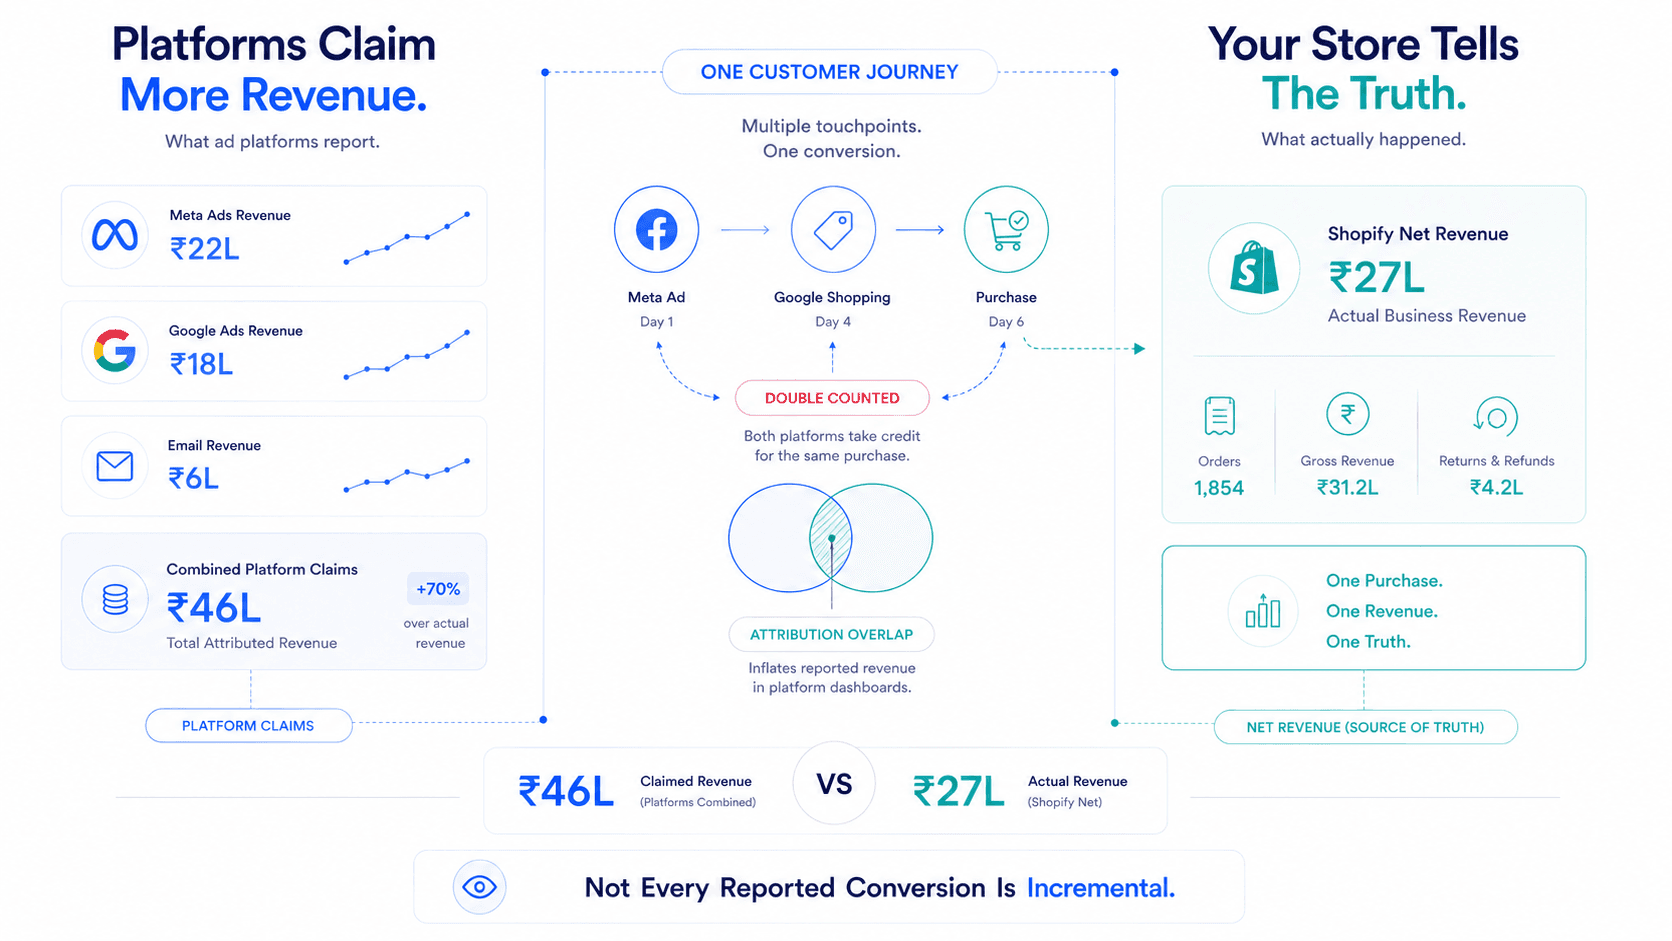
Meta claims ₹18L, Google ₹14L, Shopify recorded ₹19L. How the six attribution models split credit, and which metrics to trust for each decision.

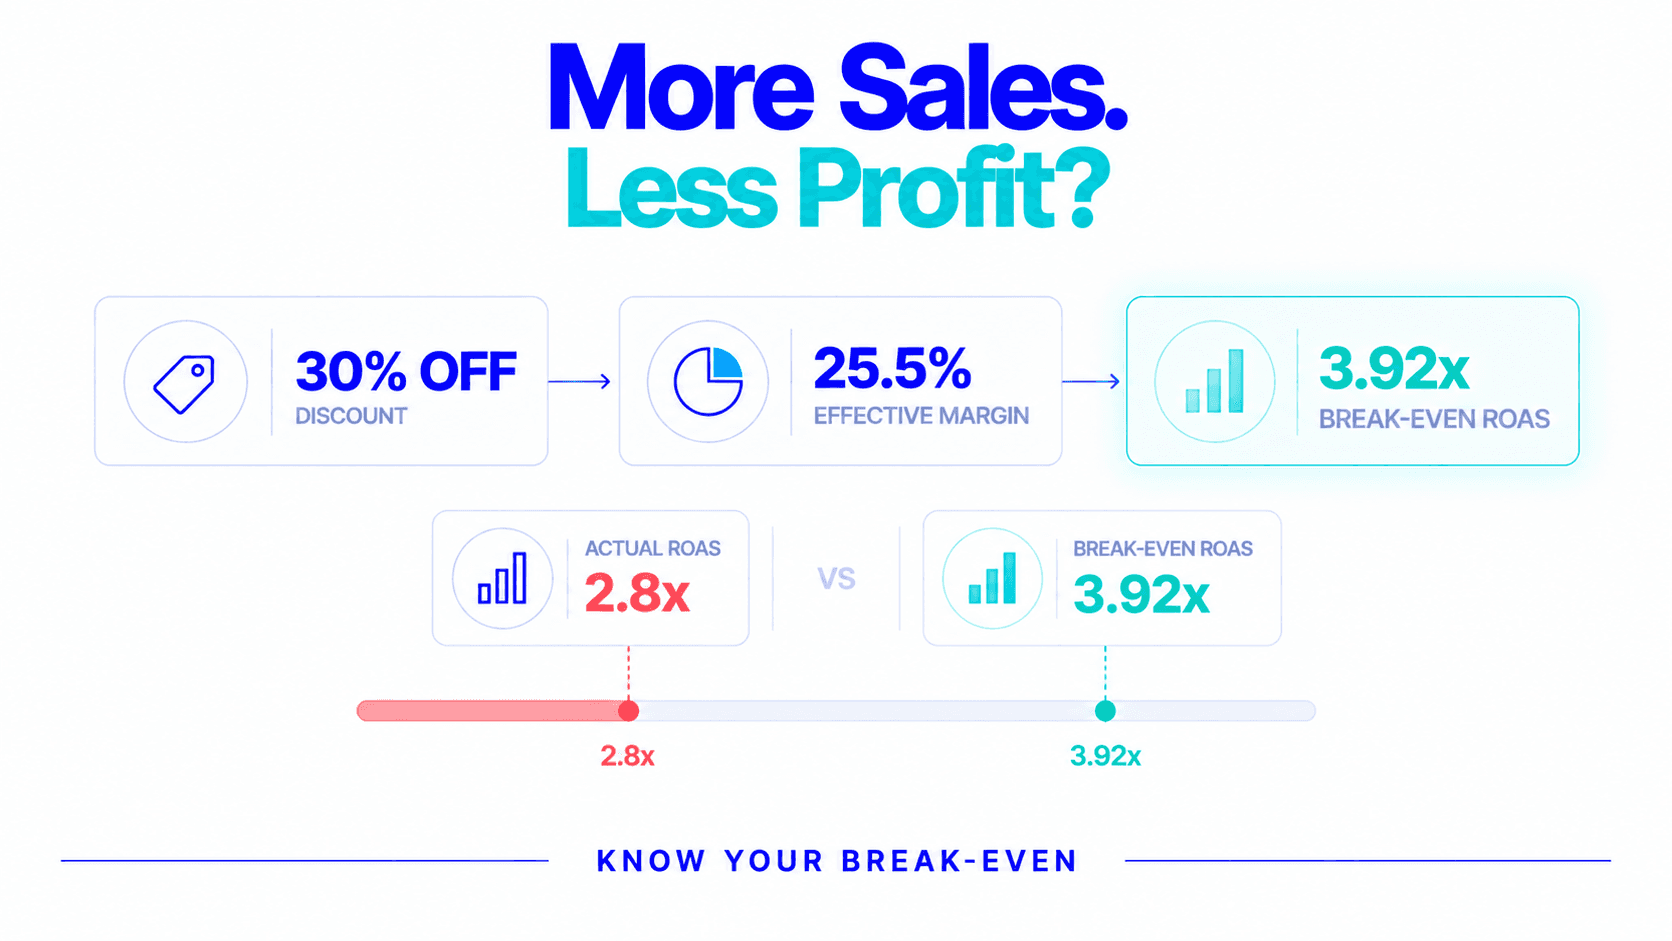
At 30% off, a fashion brand needs 3.92x ROAS just to break even during BFCM. The four-phase plan to scale Black Friday on contribution, not gross revenue.

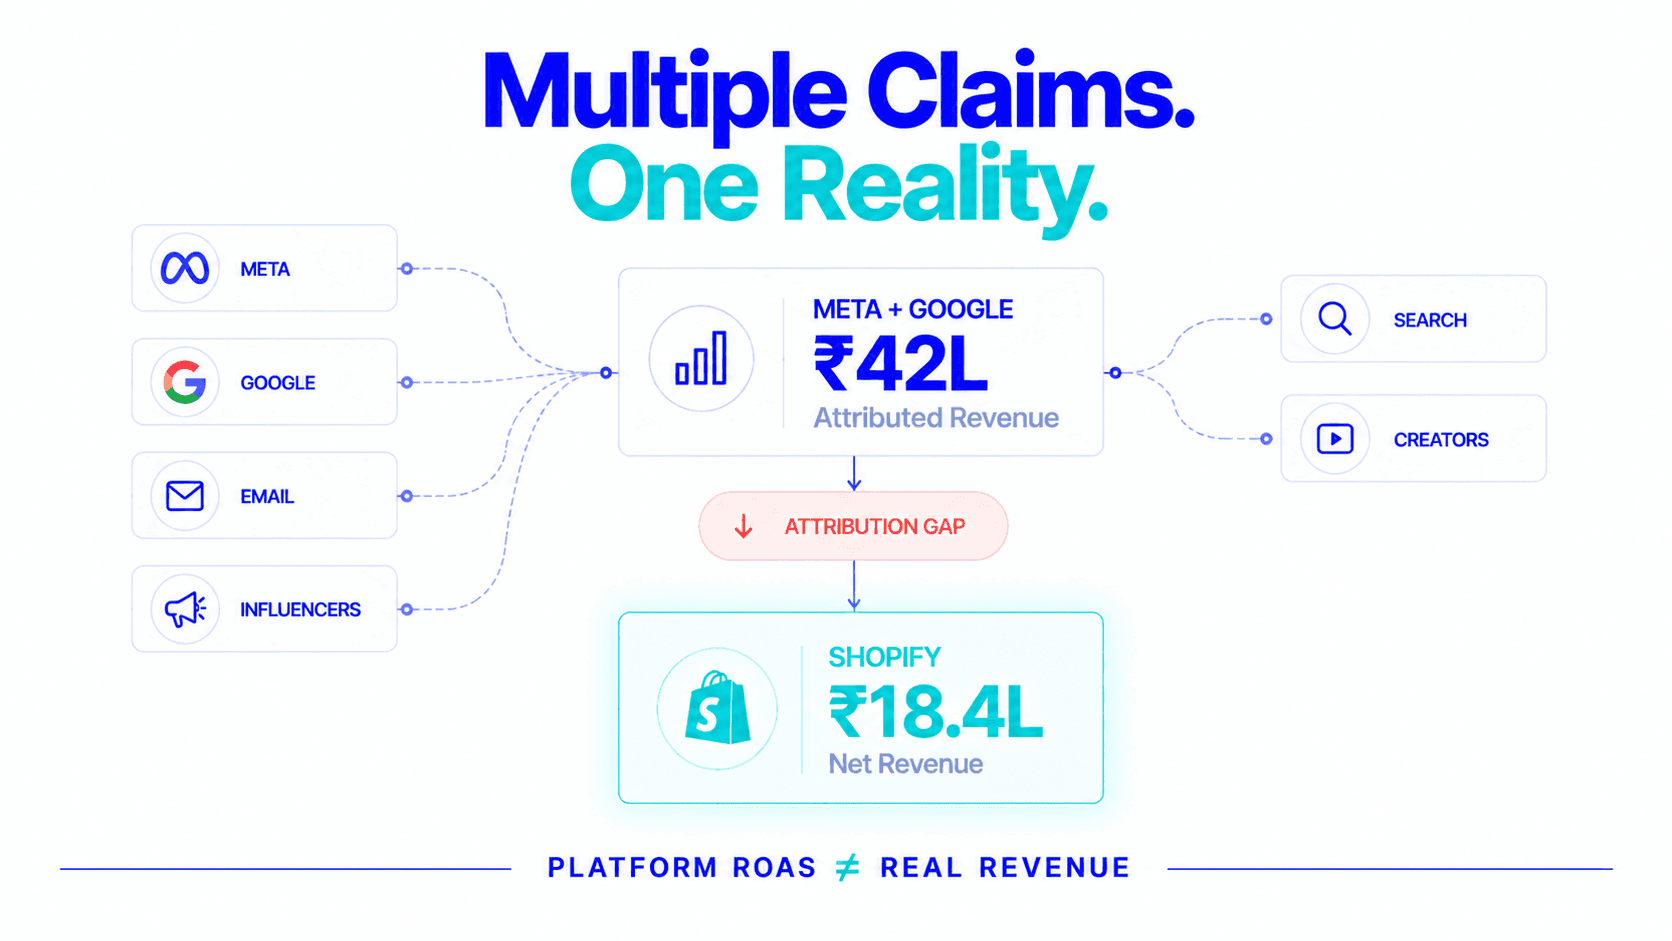
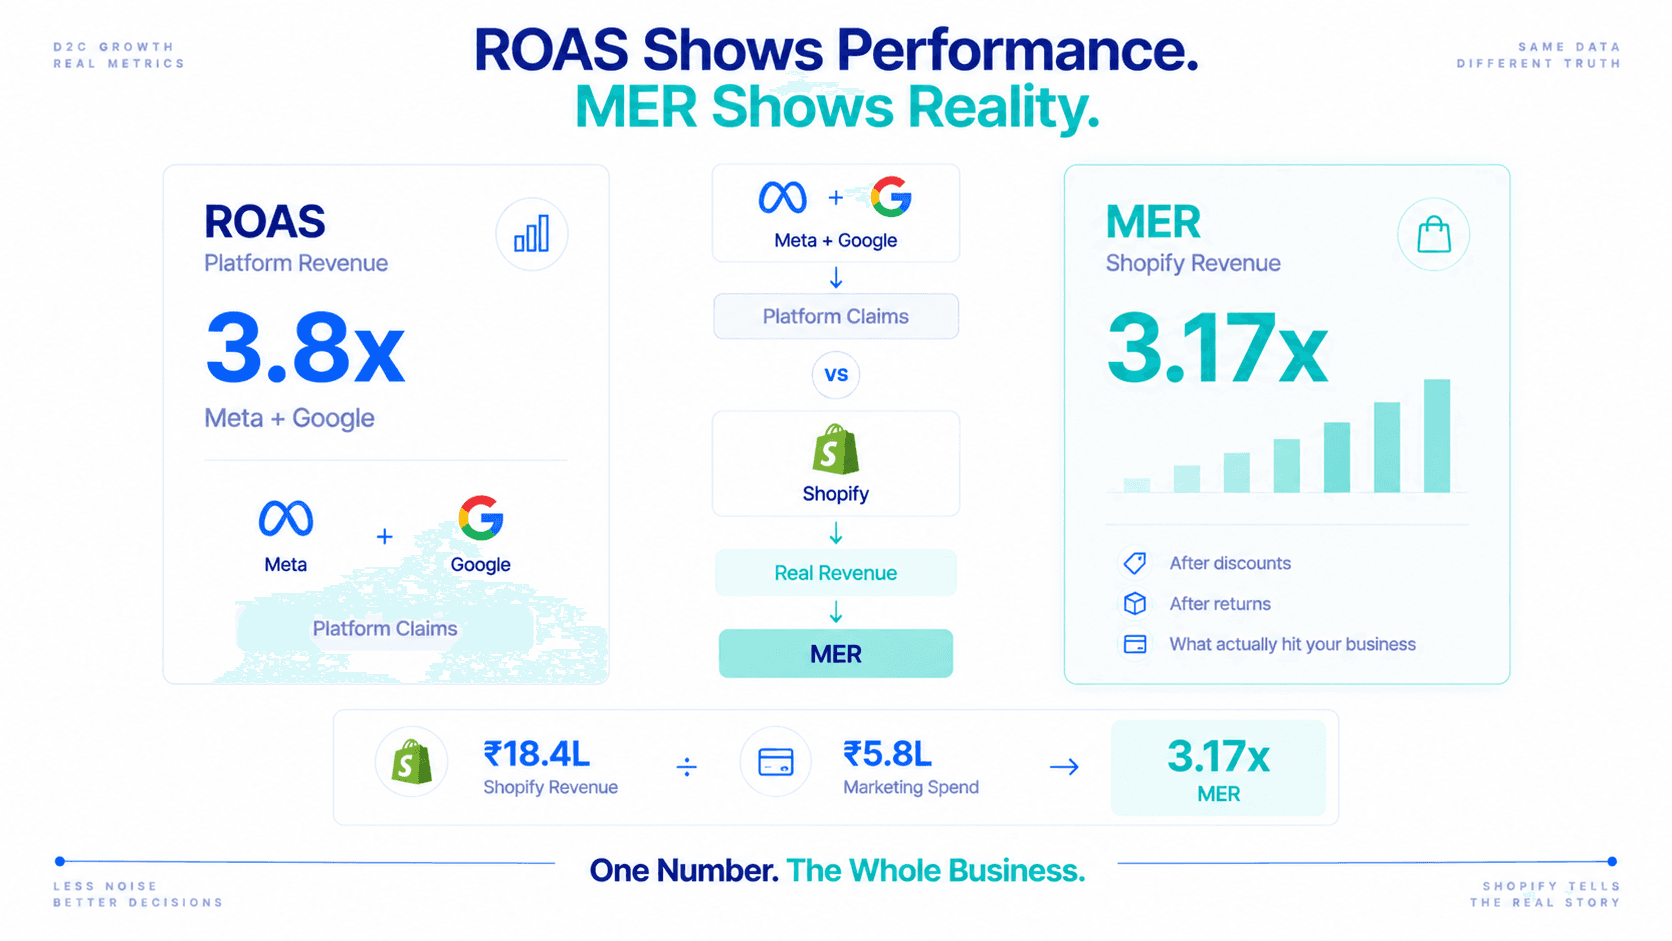
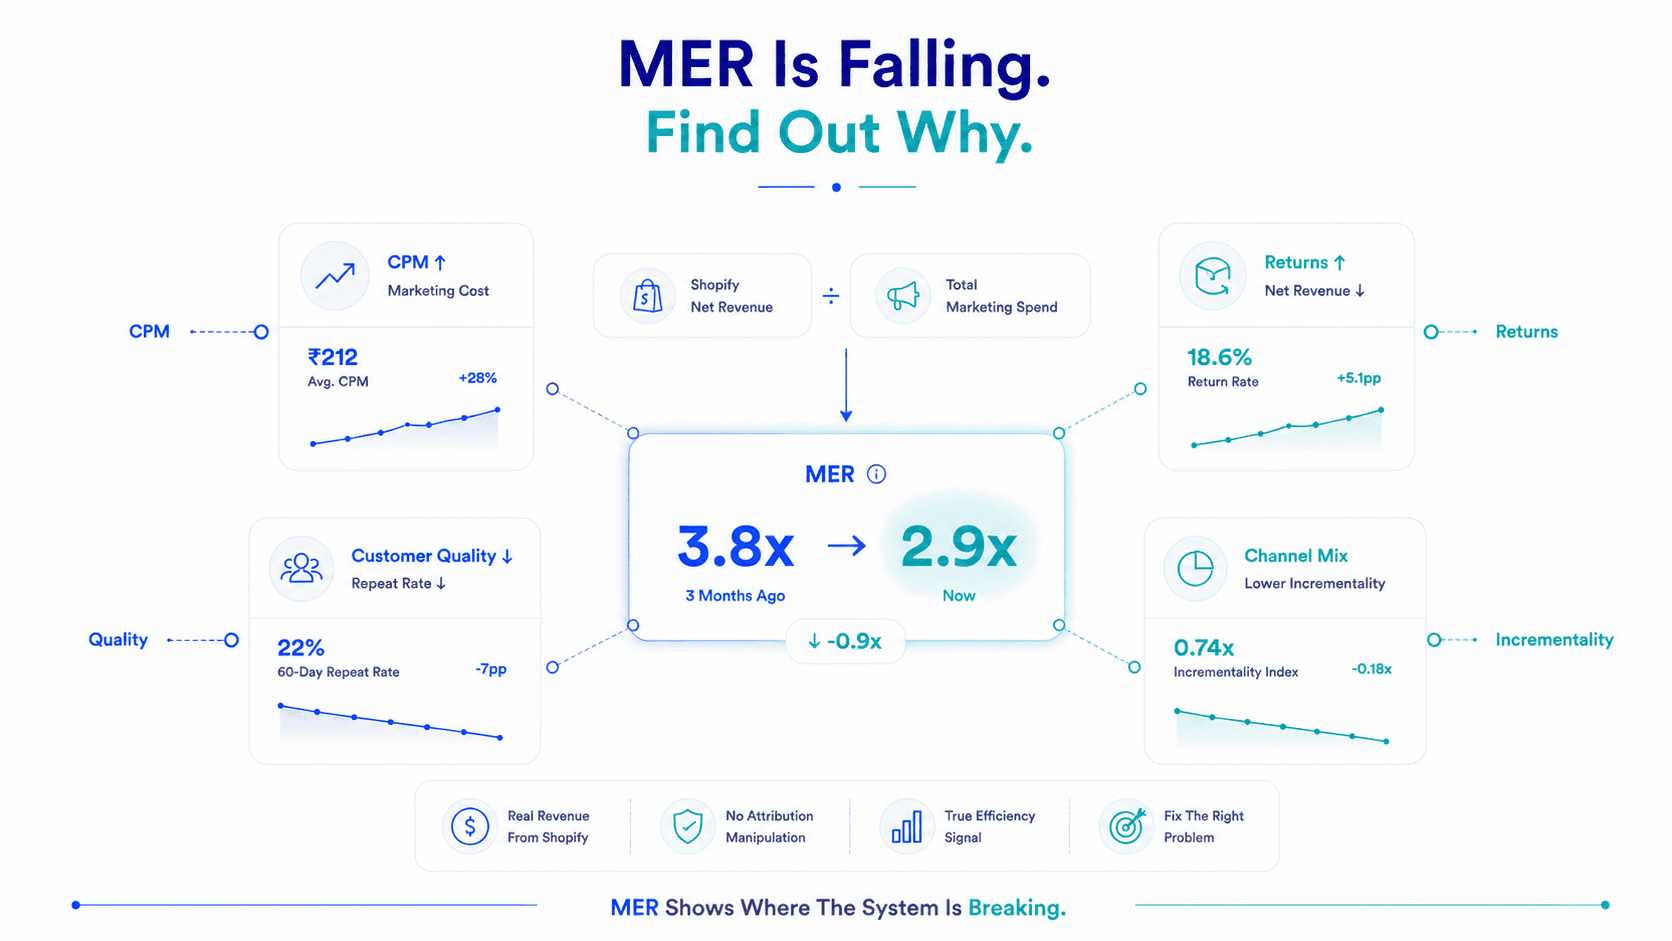
Meta says 3.9x, Google says 4.6x, and Shopify recorded less than half of what they claim. The MER formula, benchmarks and the weekly trend that can't be gamed.

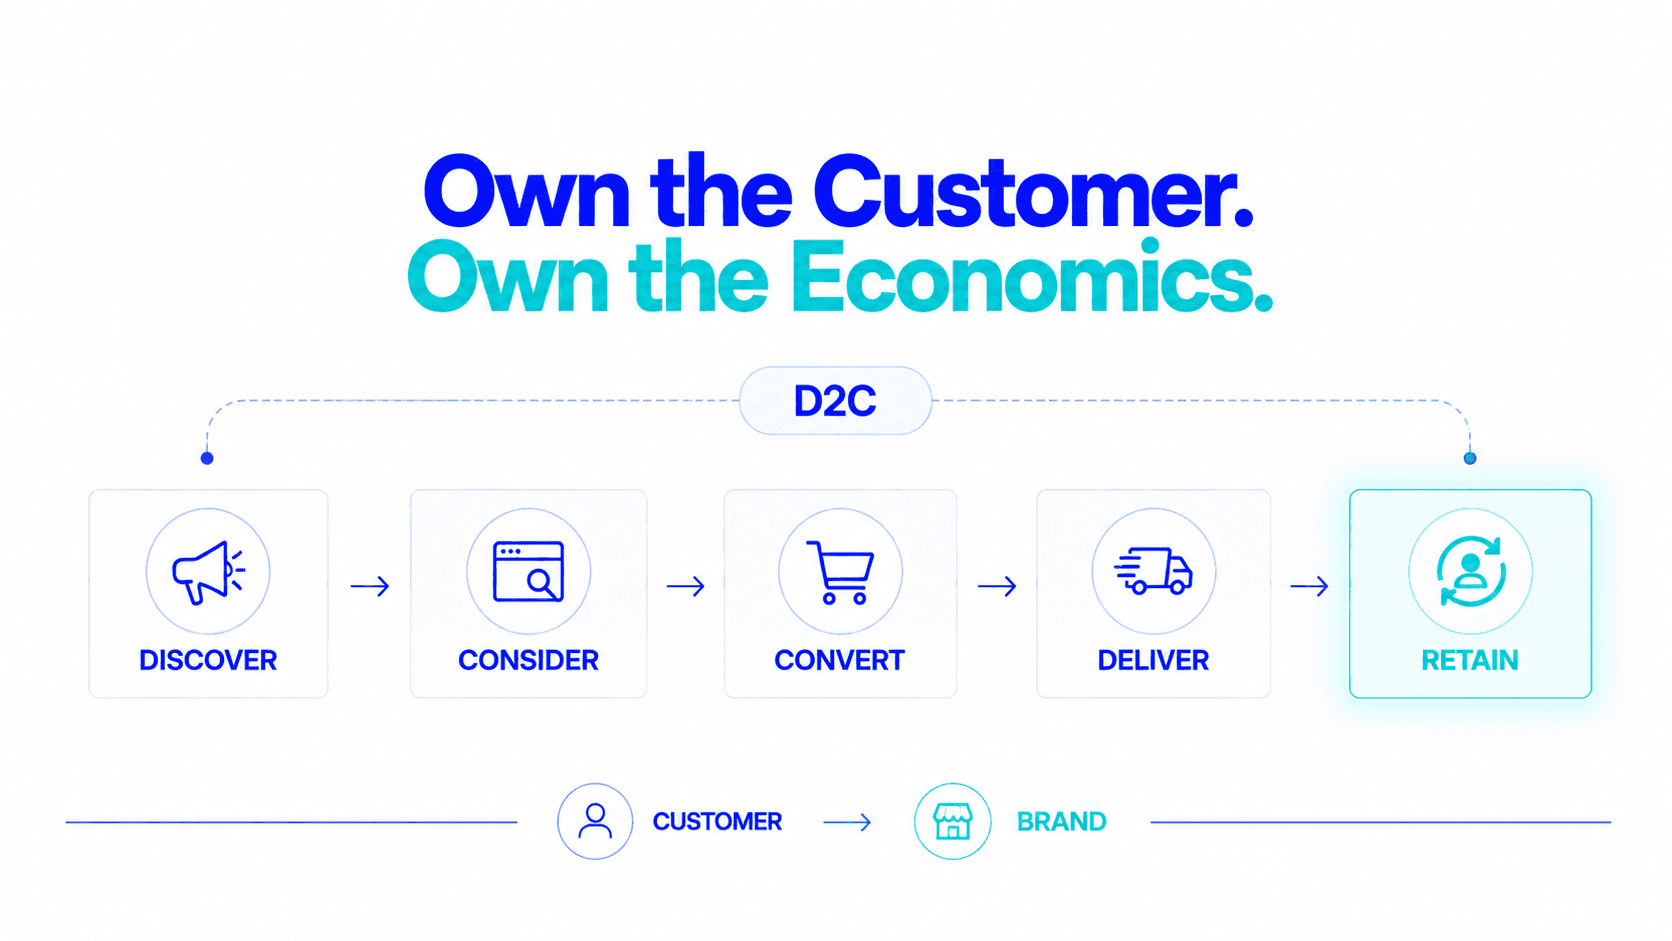
Not the checkout mechanics, the business model. The five-stage D2C journey, the unit economics from gross revenue to CM2, and how it all works in India.

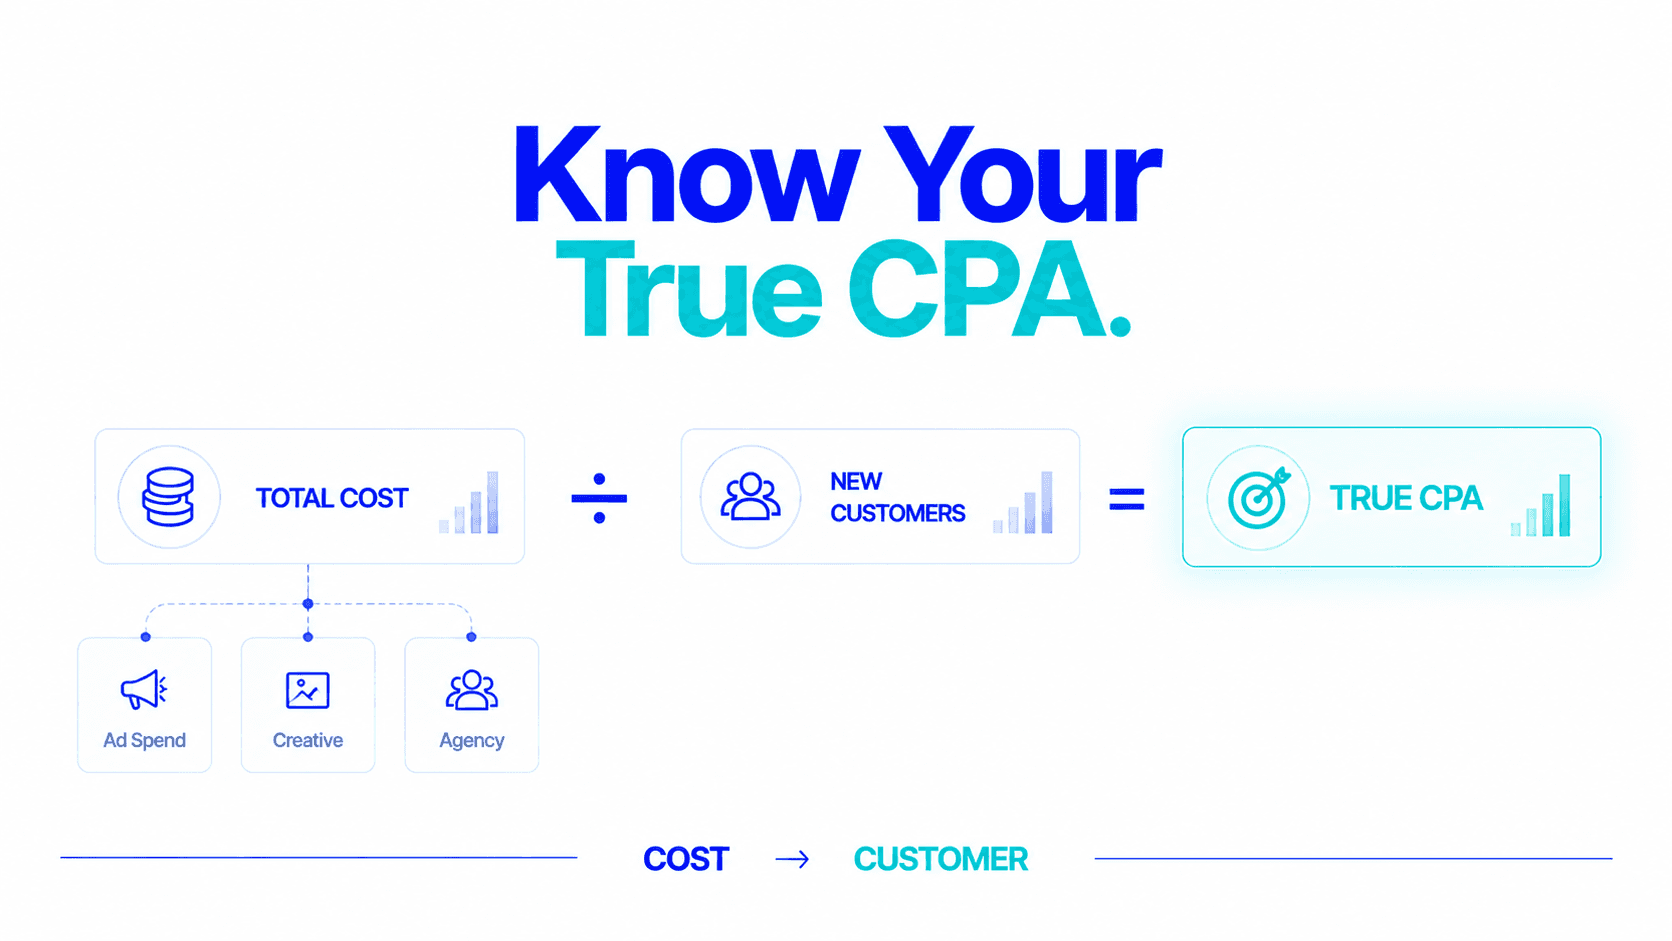
Your Ads Manager CPA blends returning customers and ignores returns. How to calculate true CPA, benchmark it for Indian D2C, and why POAS should outrank it.

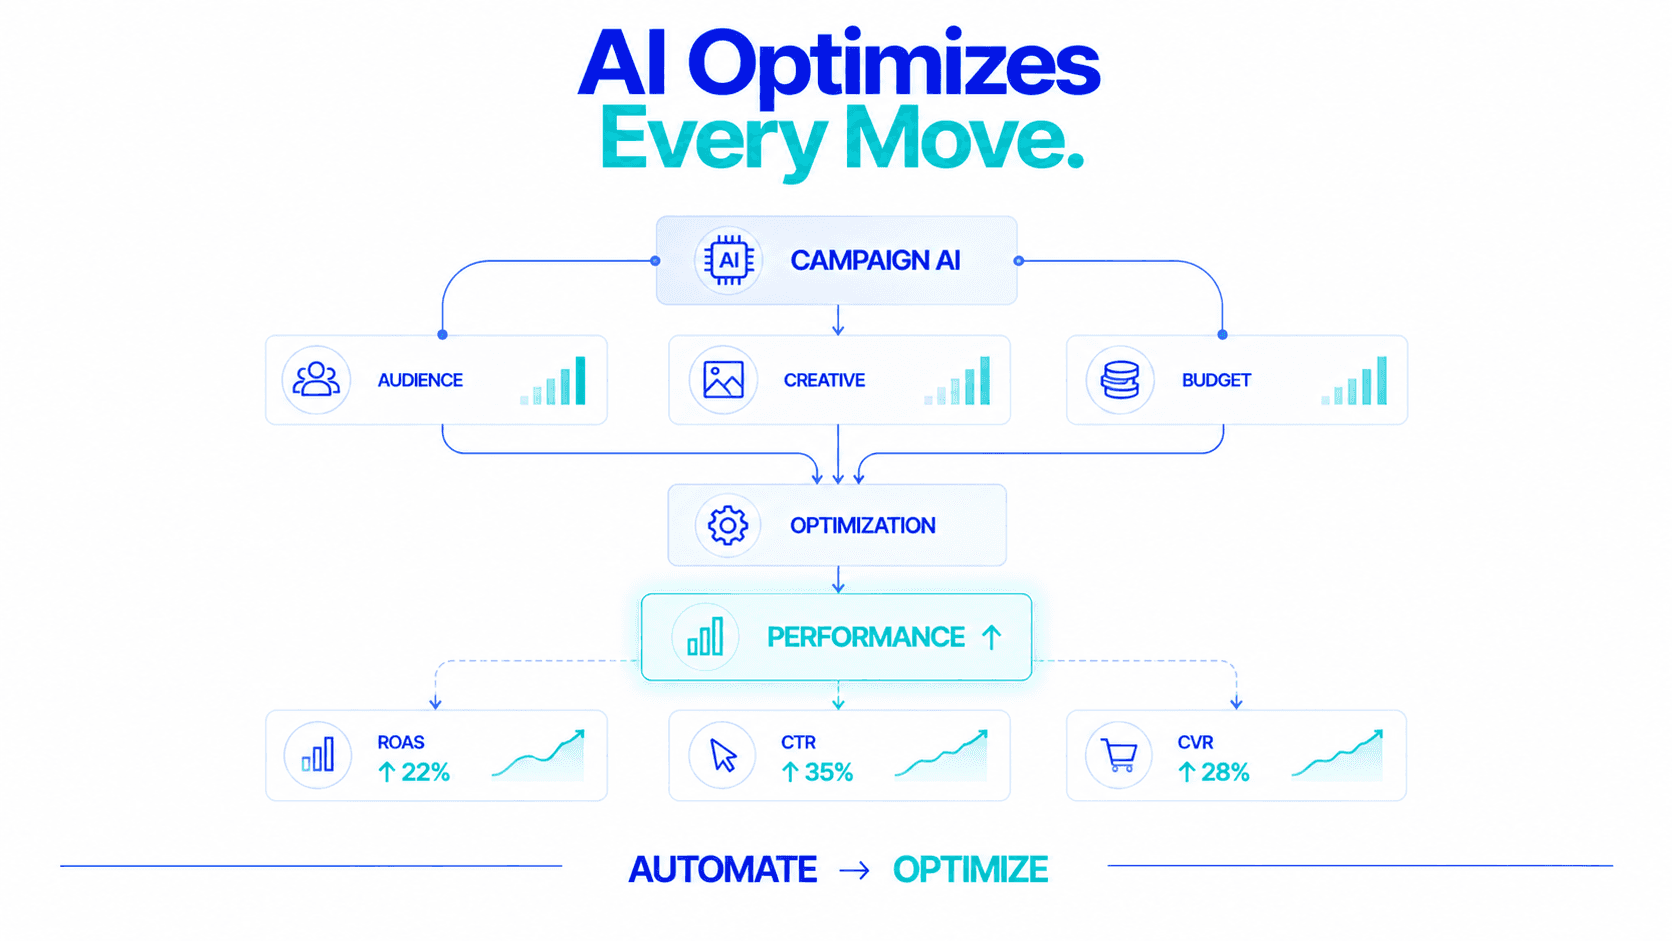
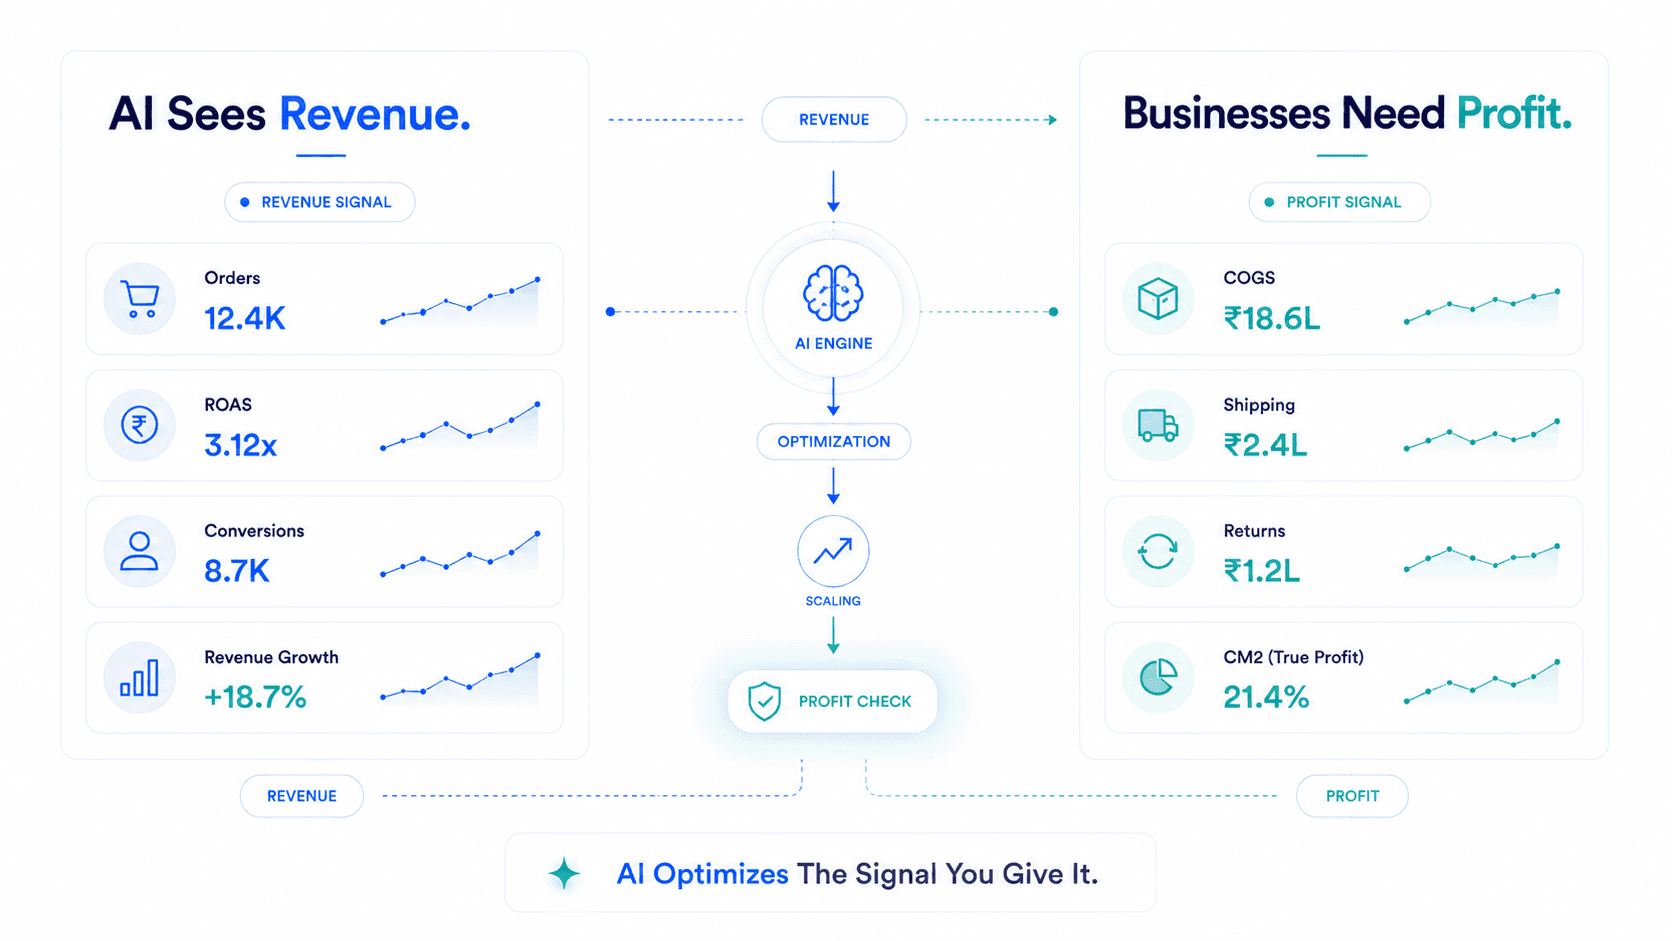
AI isn't a magic button. Where it really pays for D2C brands in 2026, what it can't do, and why every AI tool should be judged on POAS per campaign.

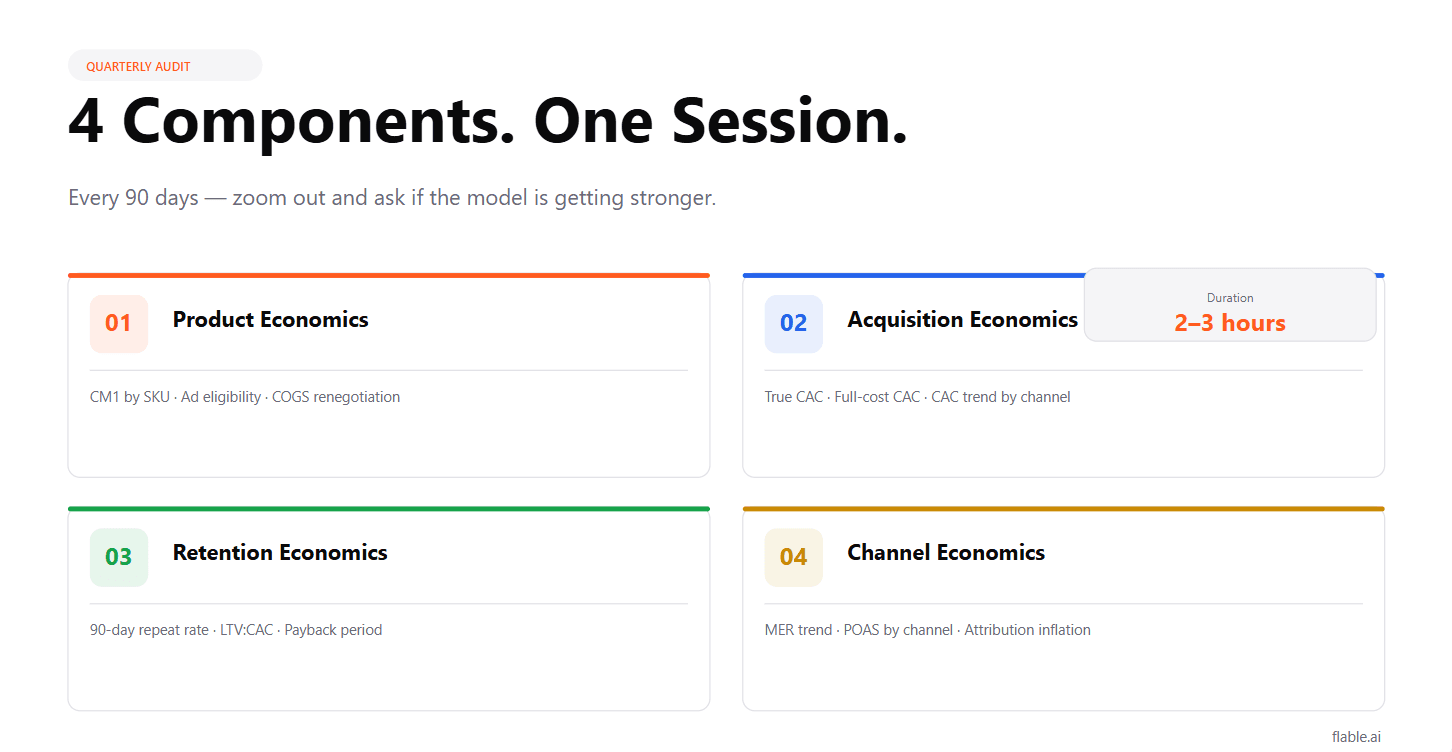
Once every 90 days, ask whether the business model is getting stronger or weaker. The four-component audit, its calculations and the three decisions it yields.

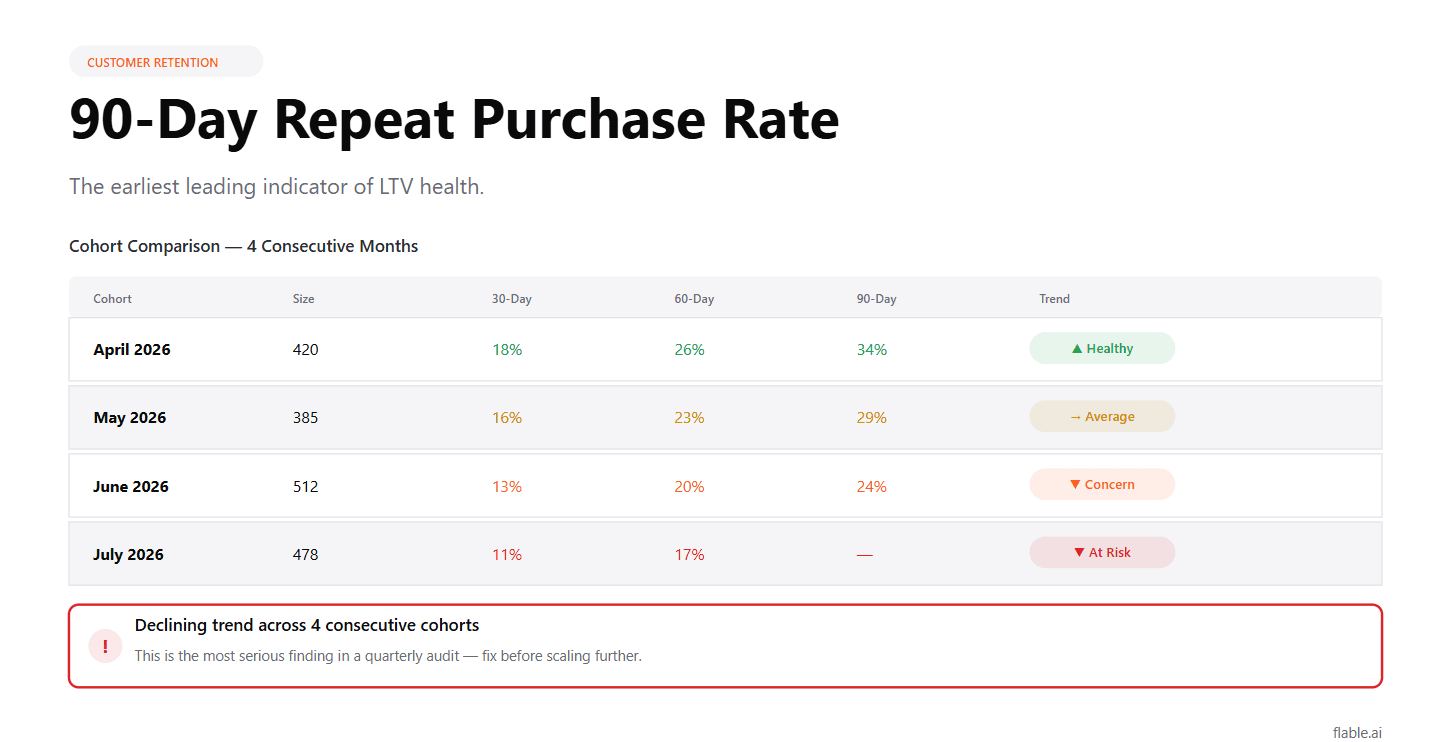
Shopify's returning customer rate blends cohorts and hides decline. How to measure 90-day repeat rate properly, benchmark it and push it up in one cycle.

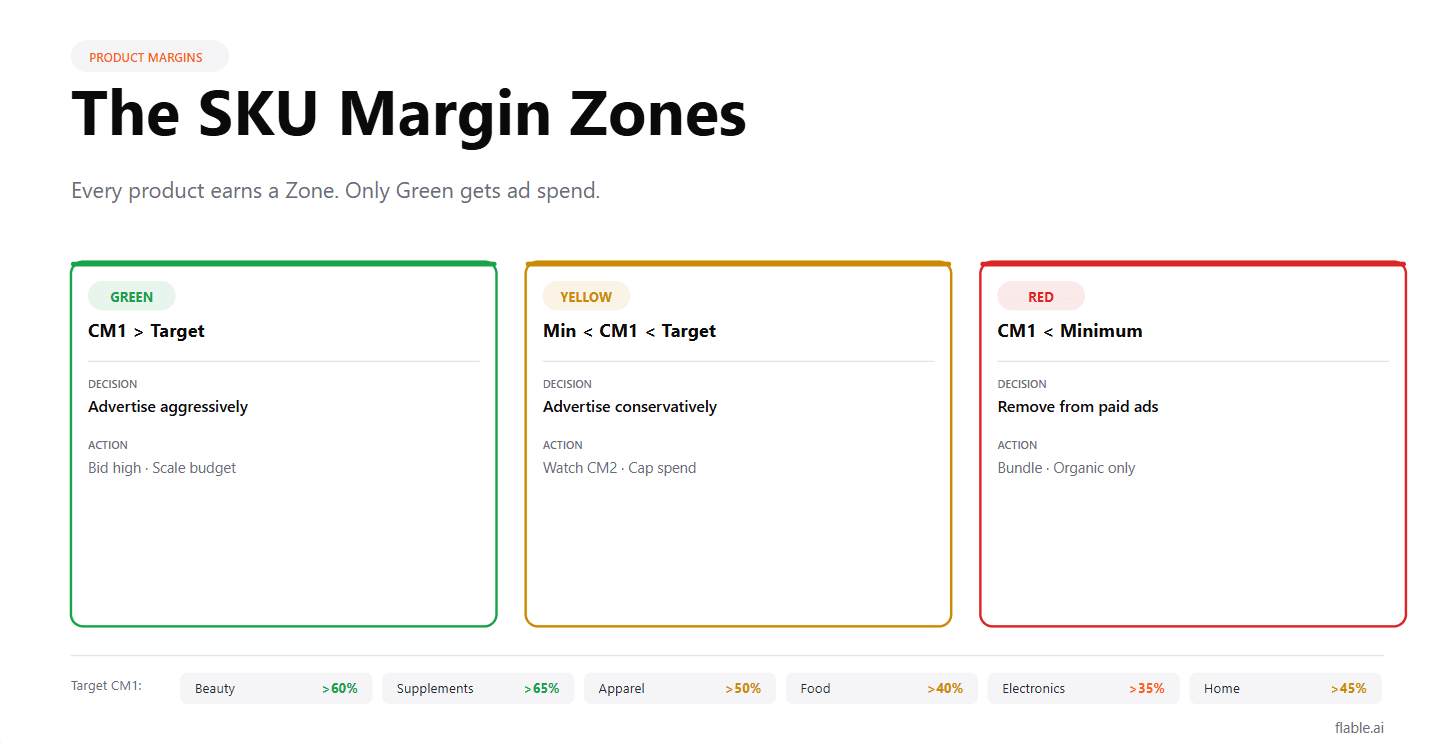
A blended 35% margin can hide seven SKUs at 22% soaking up your ad budget. Build the three-sheet SKU dashboard that shows which products can support ads.

A campaign below break-even on Tuesday spends six days losing money before Monday's review. Turn POAS targets into Meta and Google rules that act in between.

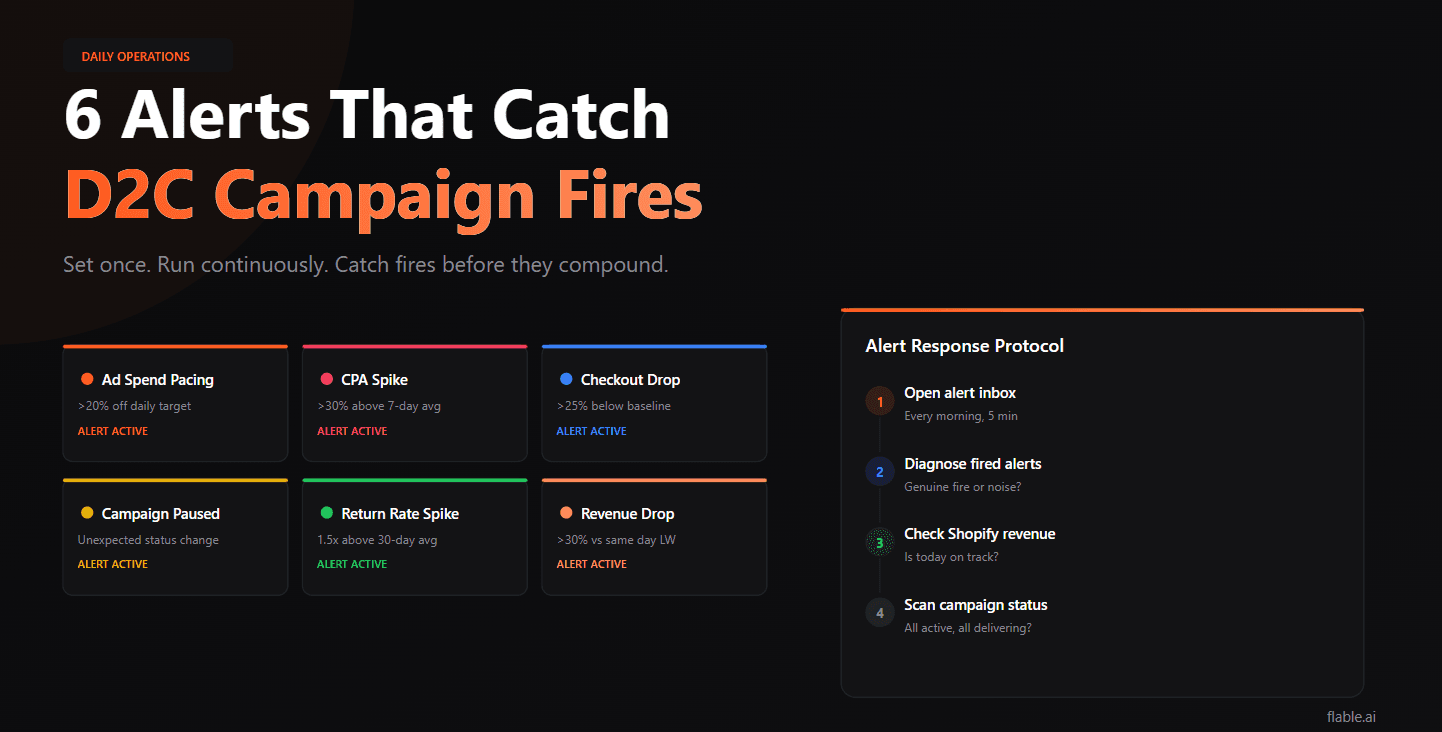
Your daily check should catch fires, not review performance. The six anomaly alerts to automate in Meta, Google and Shopify, and what to do when one fires.

A ₹699 product with ₹115 shipping needs 7.14x ROAS to break even. A 3-pack needs 2.57x. Four bundle types and the CM2 math to run before launch.

CPMs double, returns spike and discounts push brands below break-even. A four-phase plan to scale Diwali, EOSS and Republic Day sales on profit, not volume.

Email drives revenue at ₹0.02–0.05 per send. The five flows that do the most work, when to send each email, and how to tell if they're working.

Competitor-matching and COGS-plus-multiple both produce a price. Neither guarantees profit. Work backwards from CM2 to the price your ads can afford.

Subscriptions don't lower CAC. They change how fast you recover it. Three models, what they do to payback, LTV and MER, and the metrics that prove it.

ROAS by campaign, CPA by ad set, green and red arrows. The Monday report is thorough, and it's missing the one number that tells you if marketing makes money.

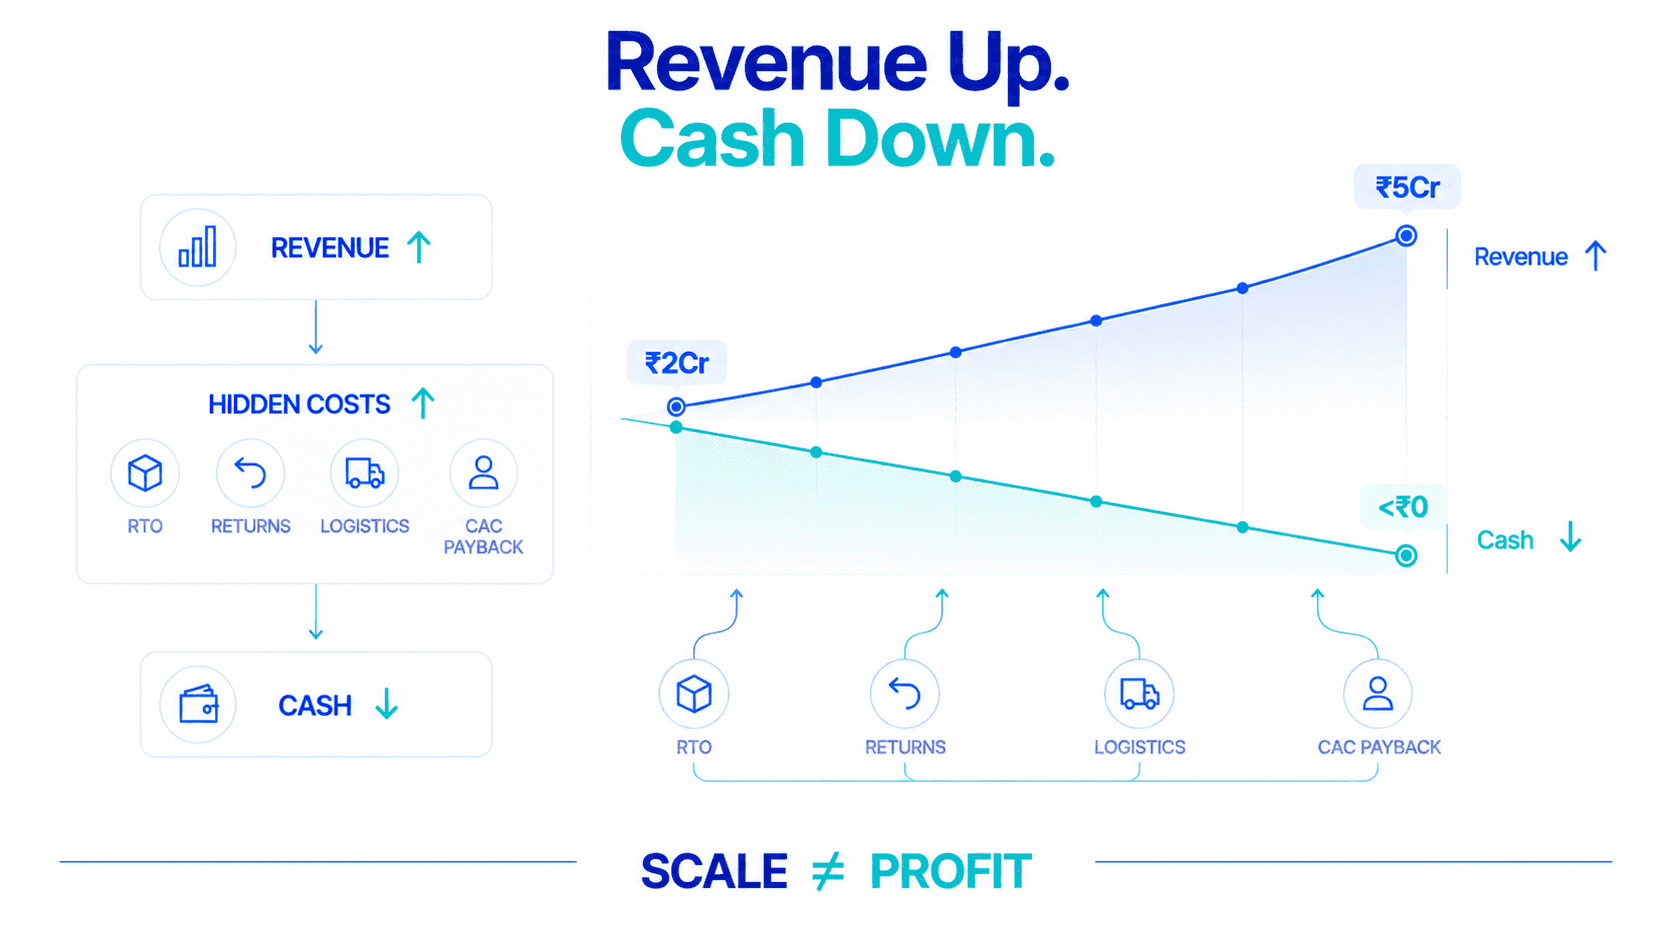
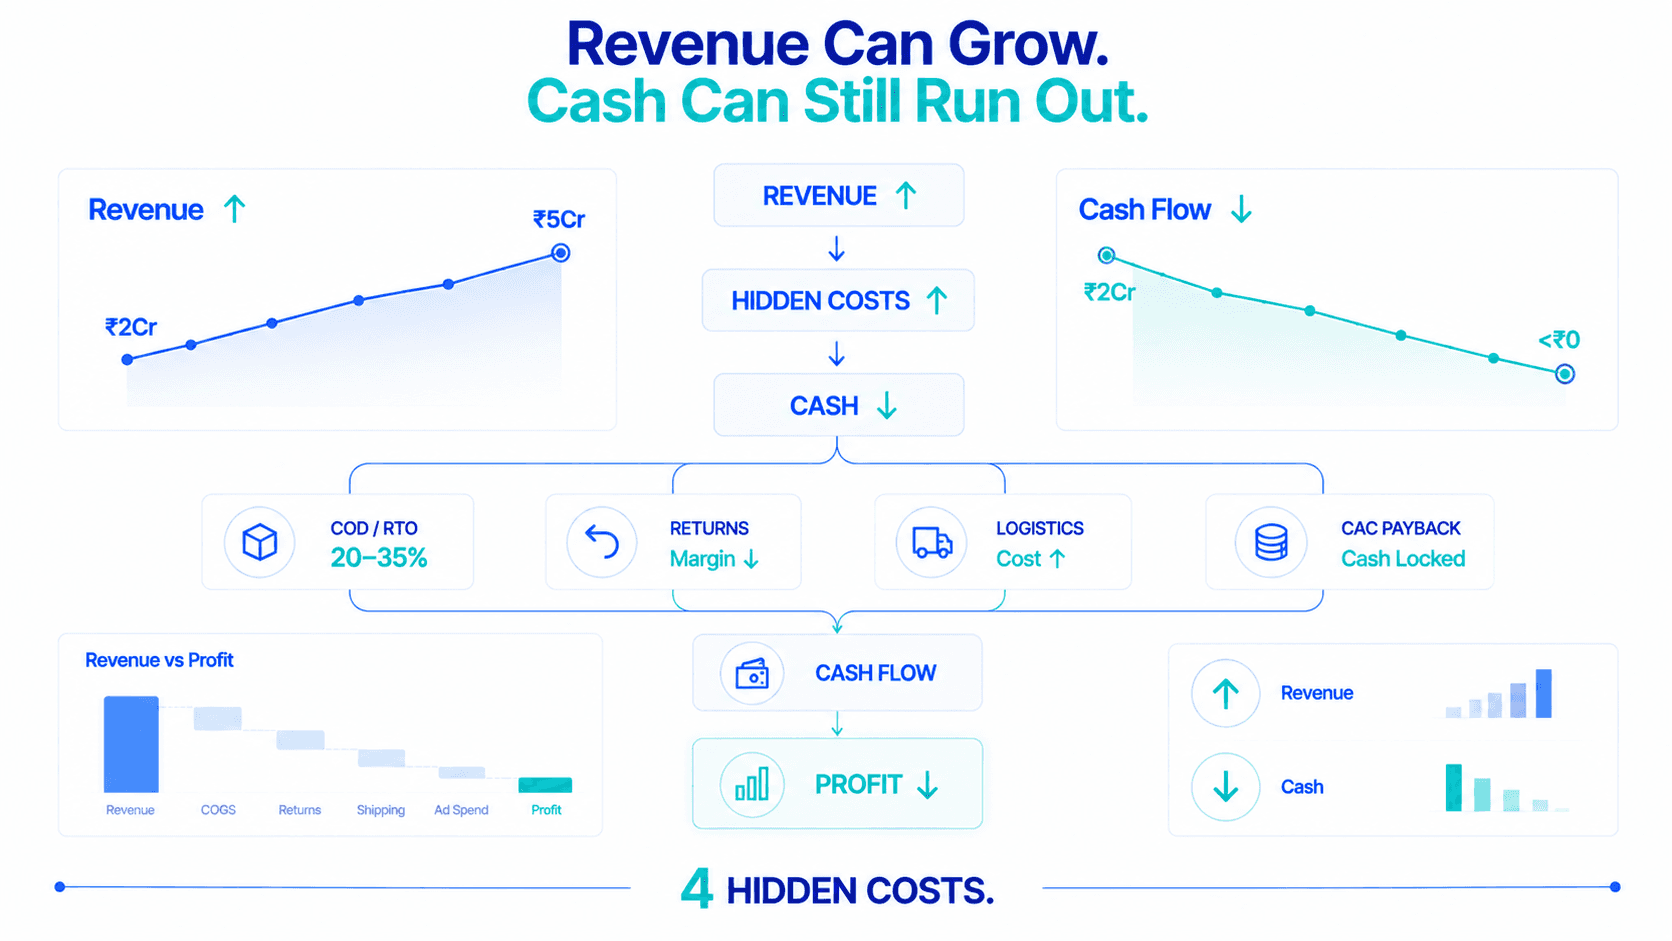
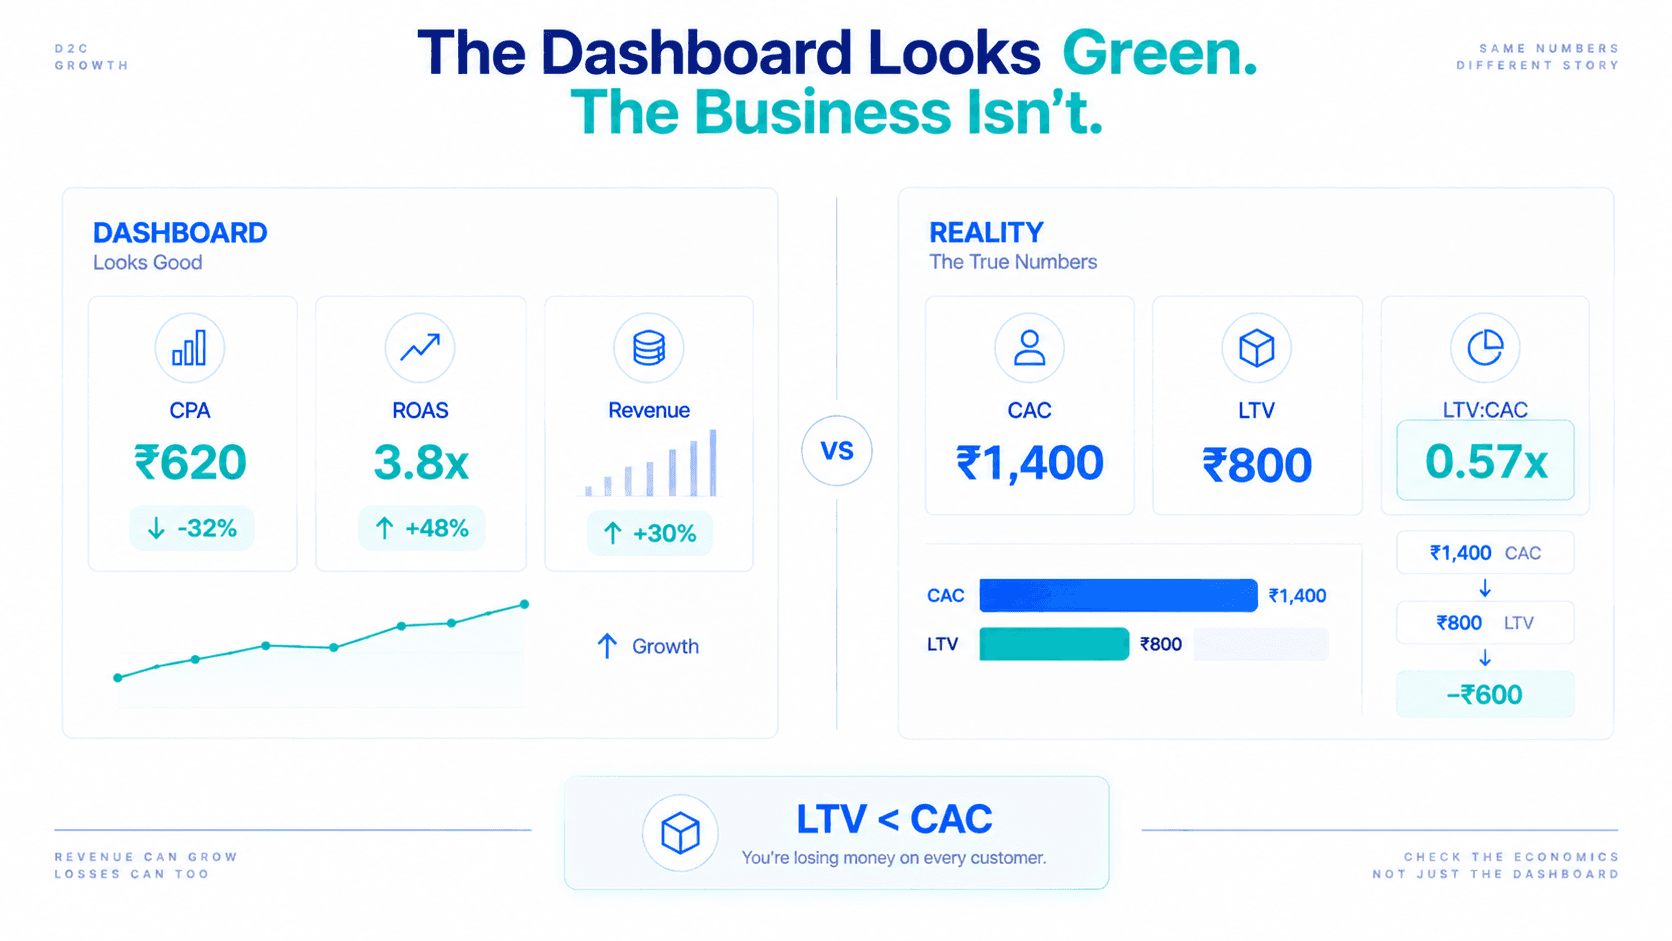
Revenue growing 30% a month, ROAS at 3.8x, and every new customer costing ₹600 more than they'll ever contribute. How to find your real LTV:CAC.

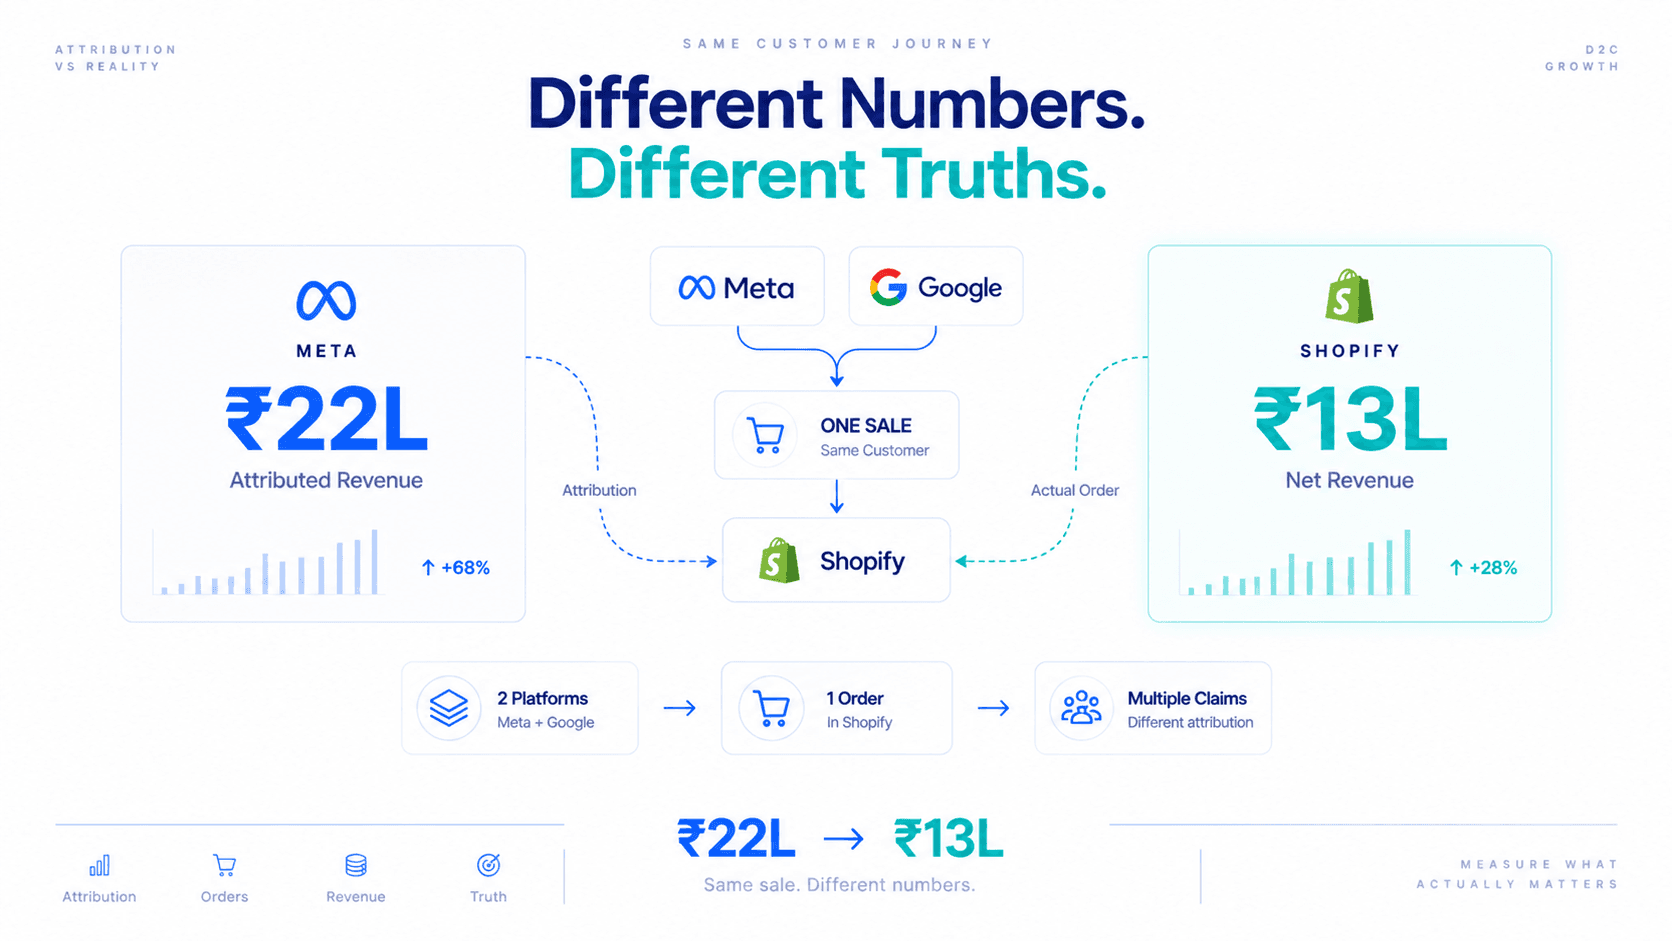
Meta claims ₹22L. Shopify recorded ₹13L. Neither is lying. The four reasons for the gap, how big it gets, and the two honest metrics to decide on.

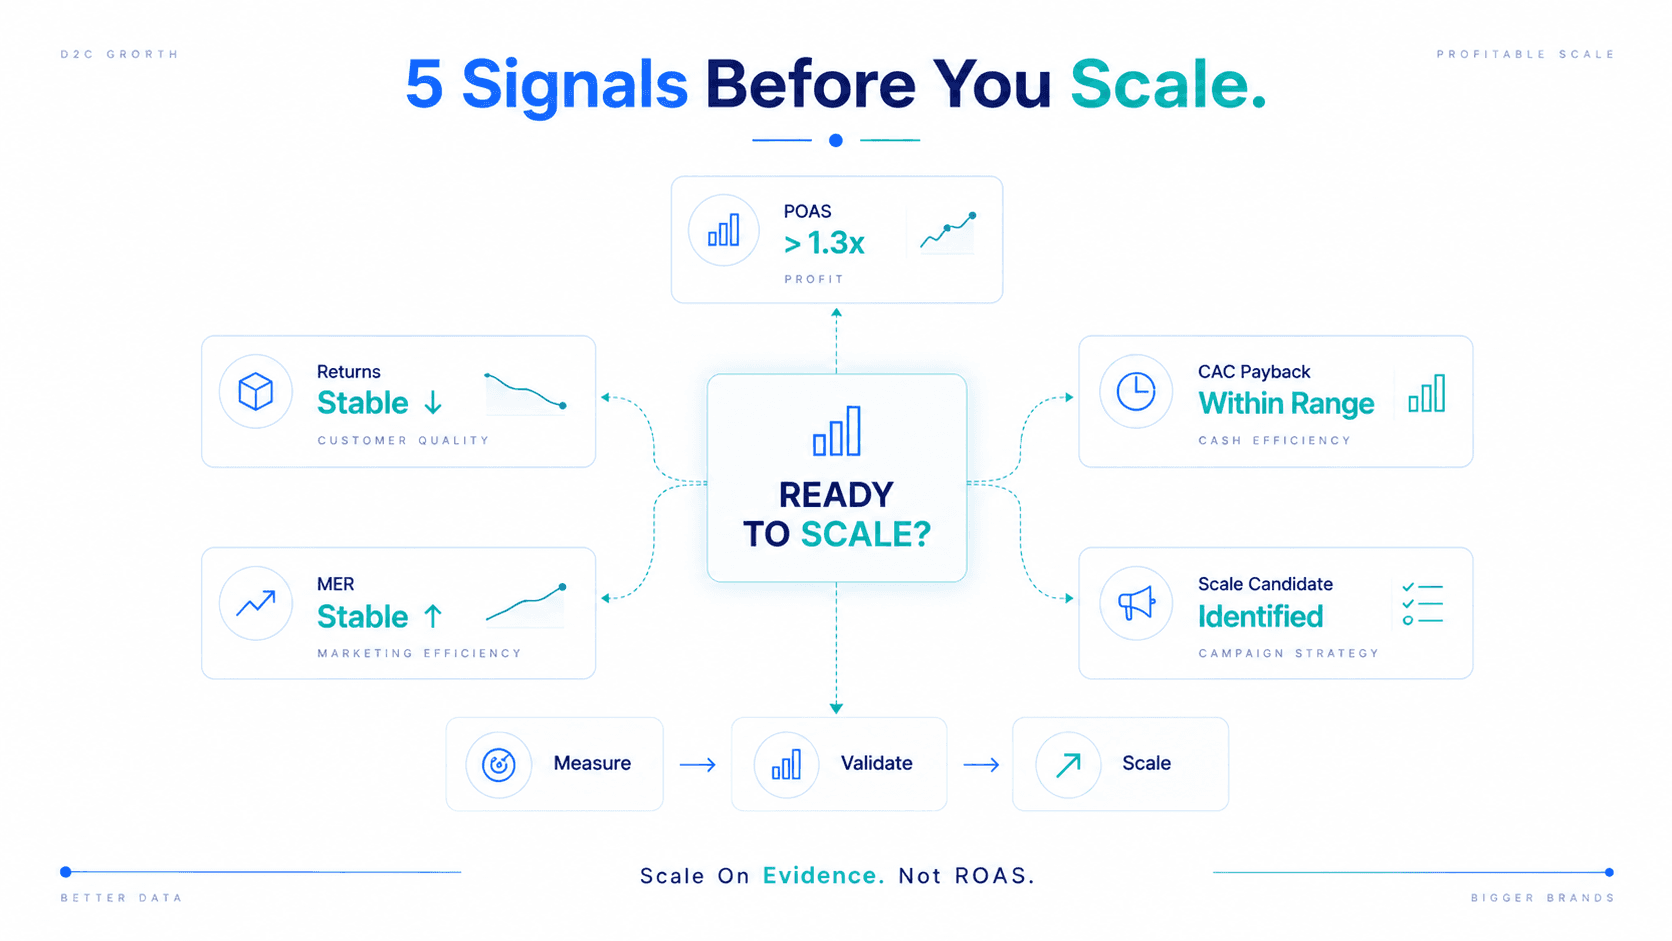
Your ROAS is strong. That doesn't mean you're ready to scale. Five signals and one question that separate ready to scale from ready to implode.

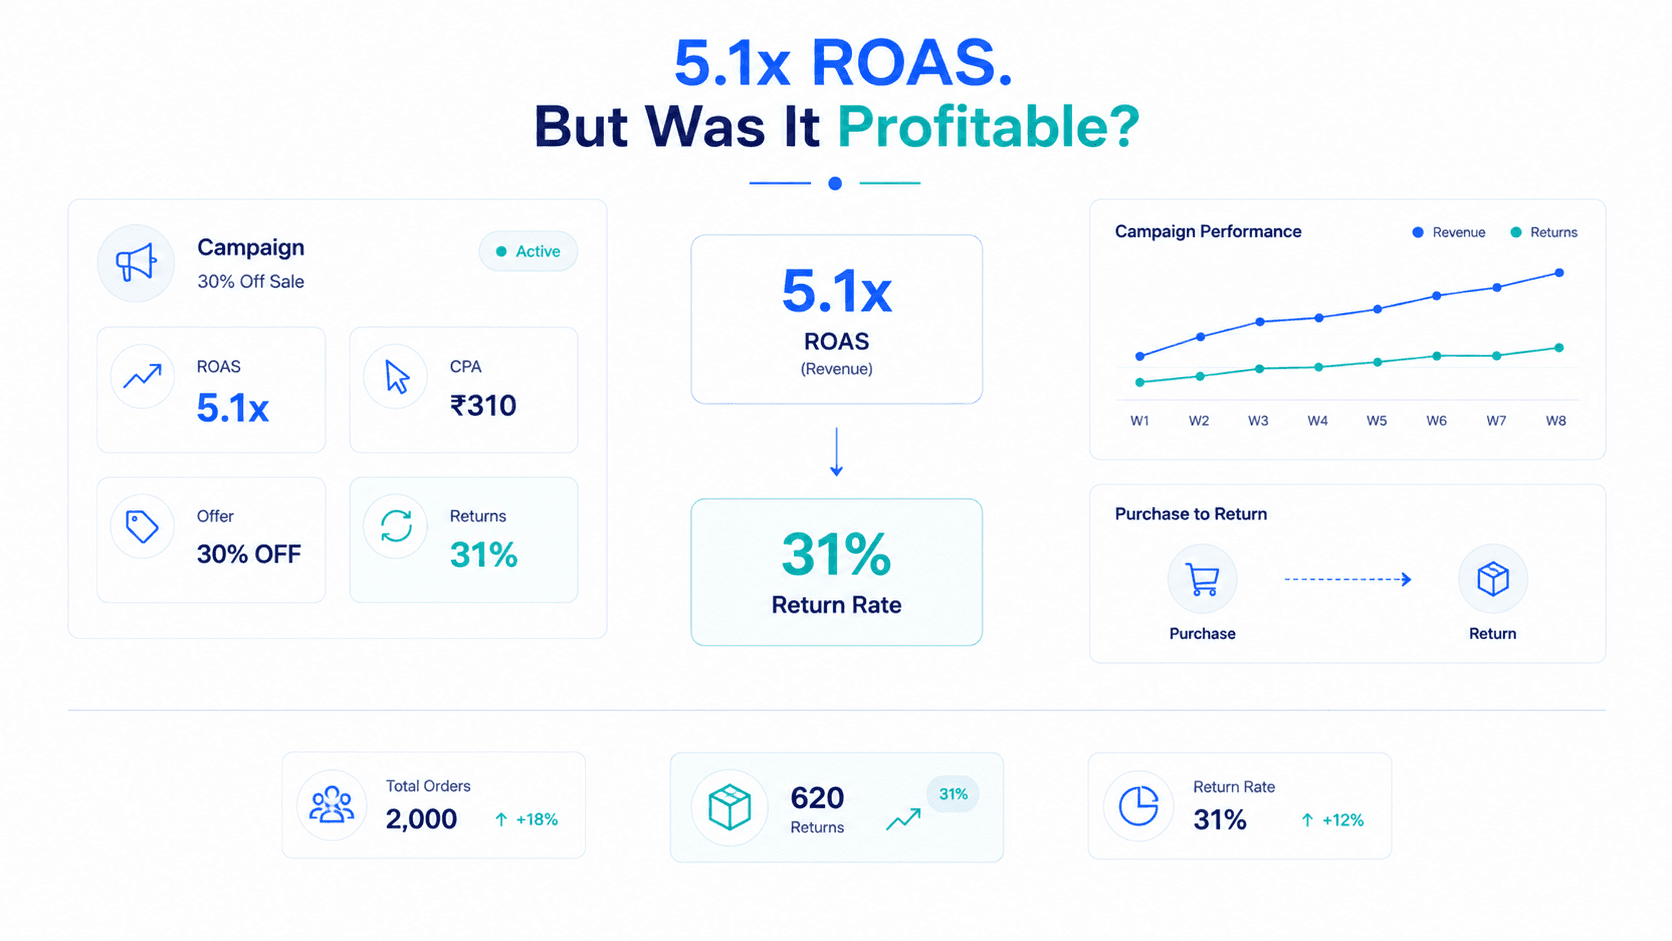
Their best campaign showed 5.1x ROAS. With a 31% return rate, its real POAS was 0.28x. Why we killed it, and what happened to margin next.

Your MER dropped while ROAS looked fine. Diagnose whether CPM inflation, rising returns, cohort quality, or channel mix is the culprit.

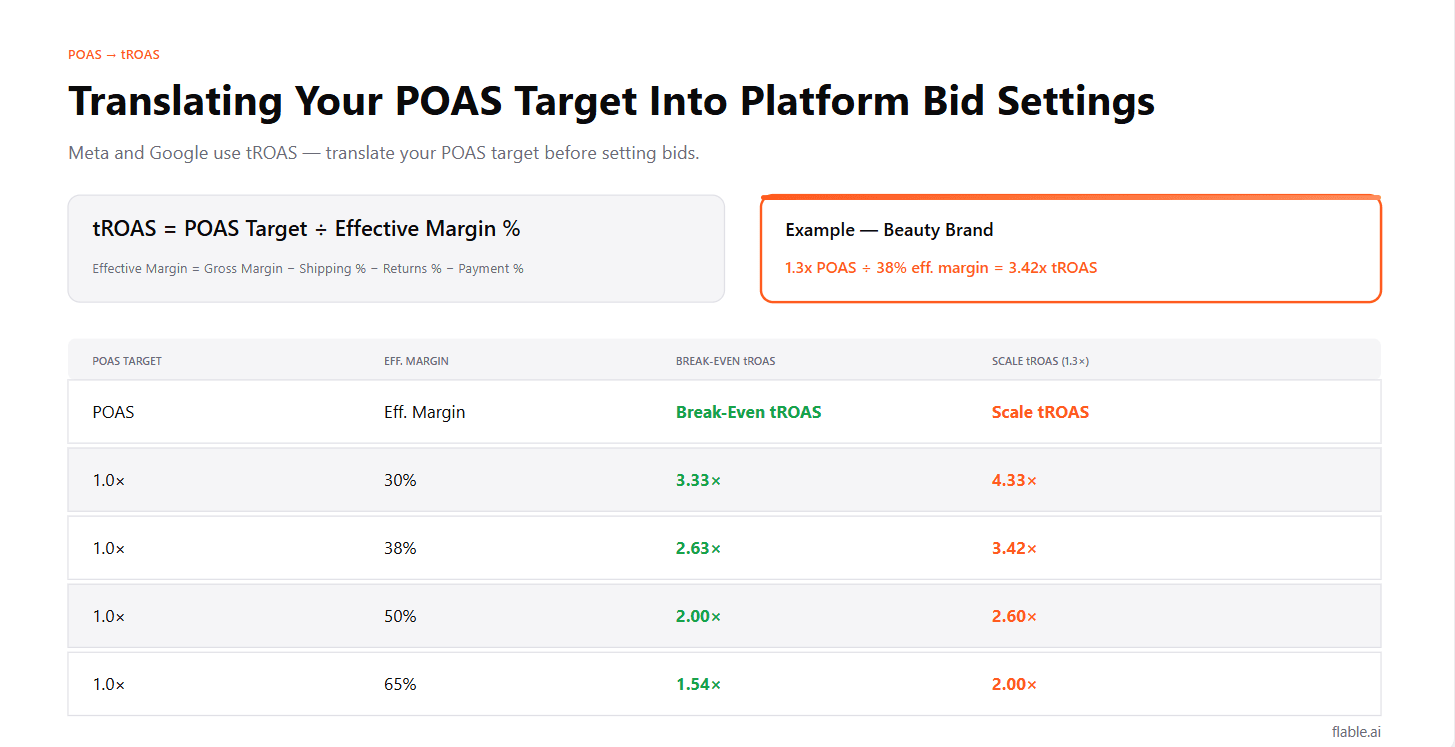
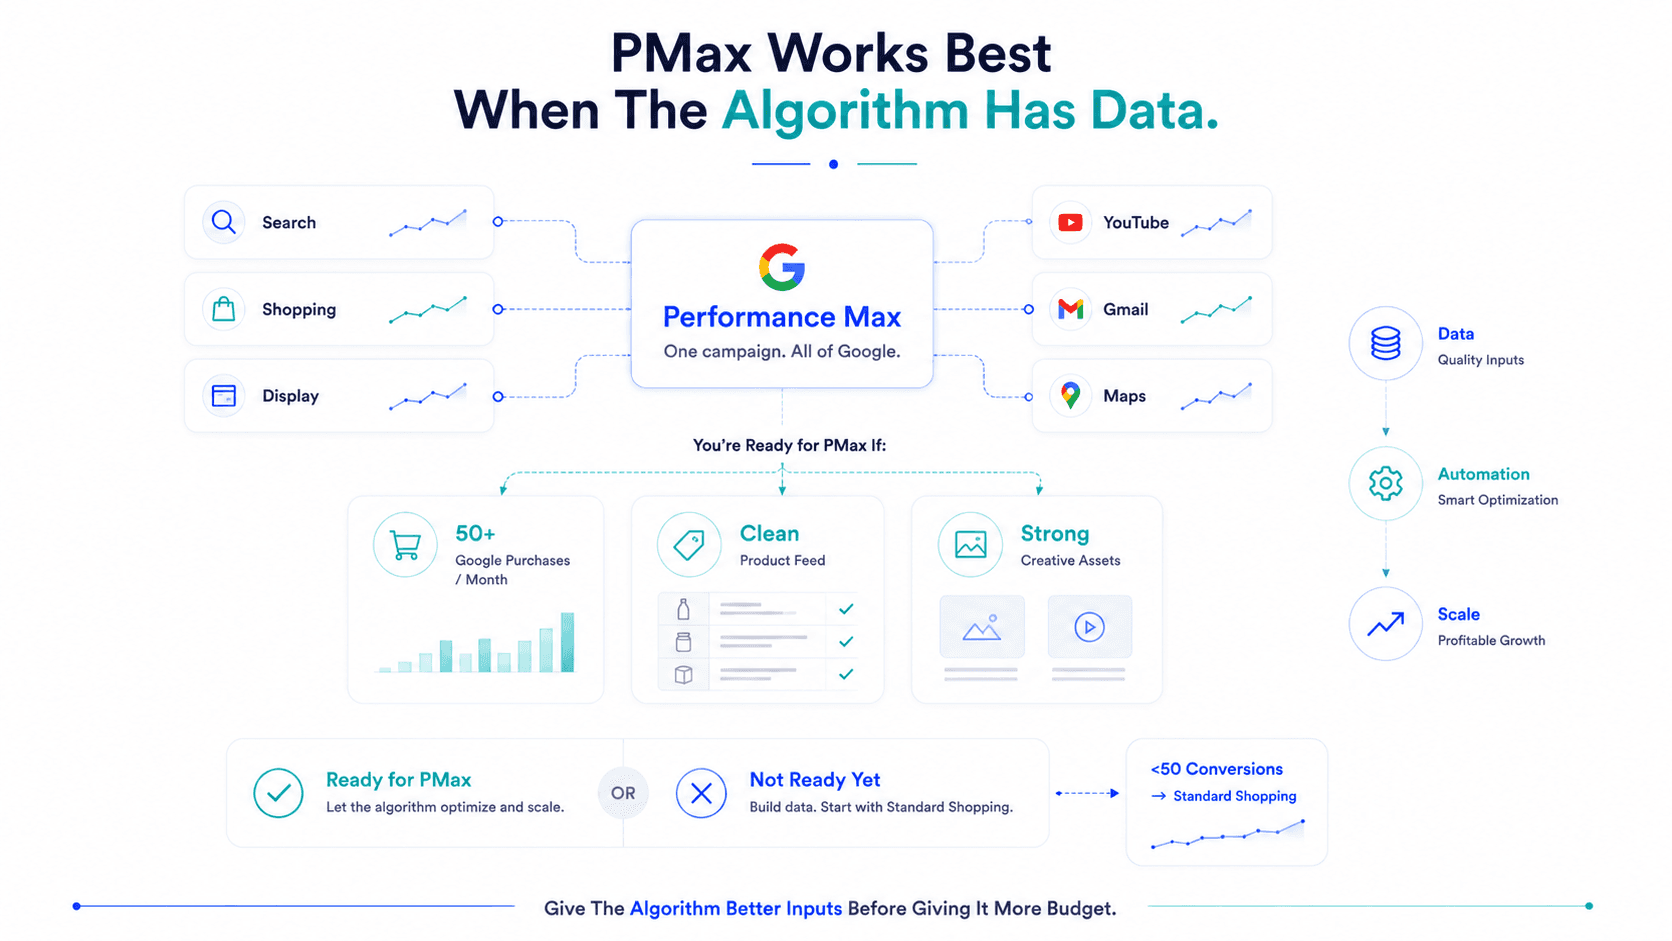
The complete D2C guide to Google PMax: feed cleanliness, tROAS from POAS formulas, asset groups, audience signals, and Standard Shopping benchmarking.

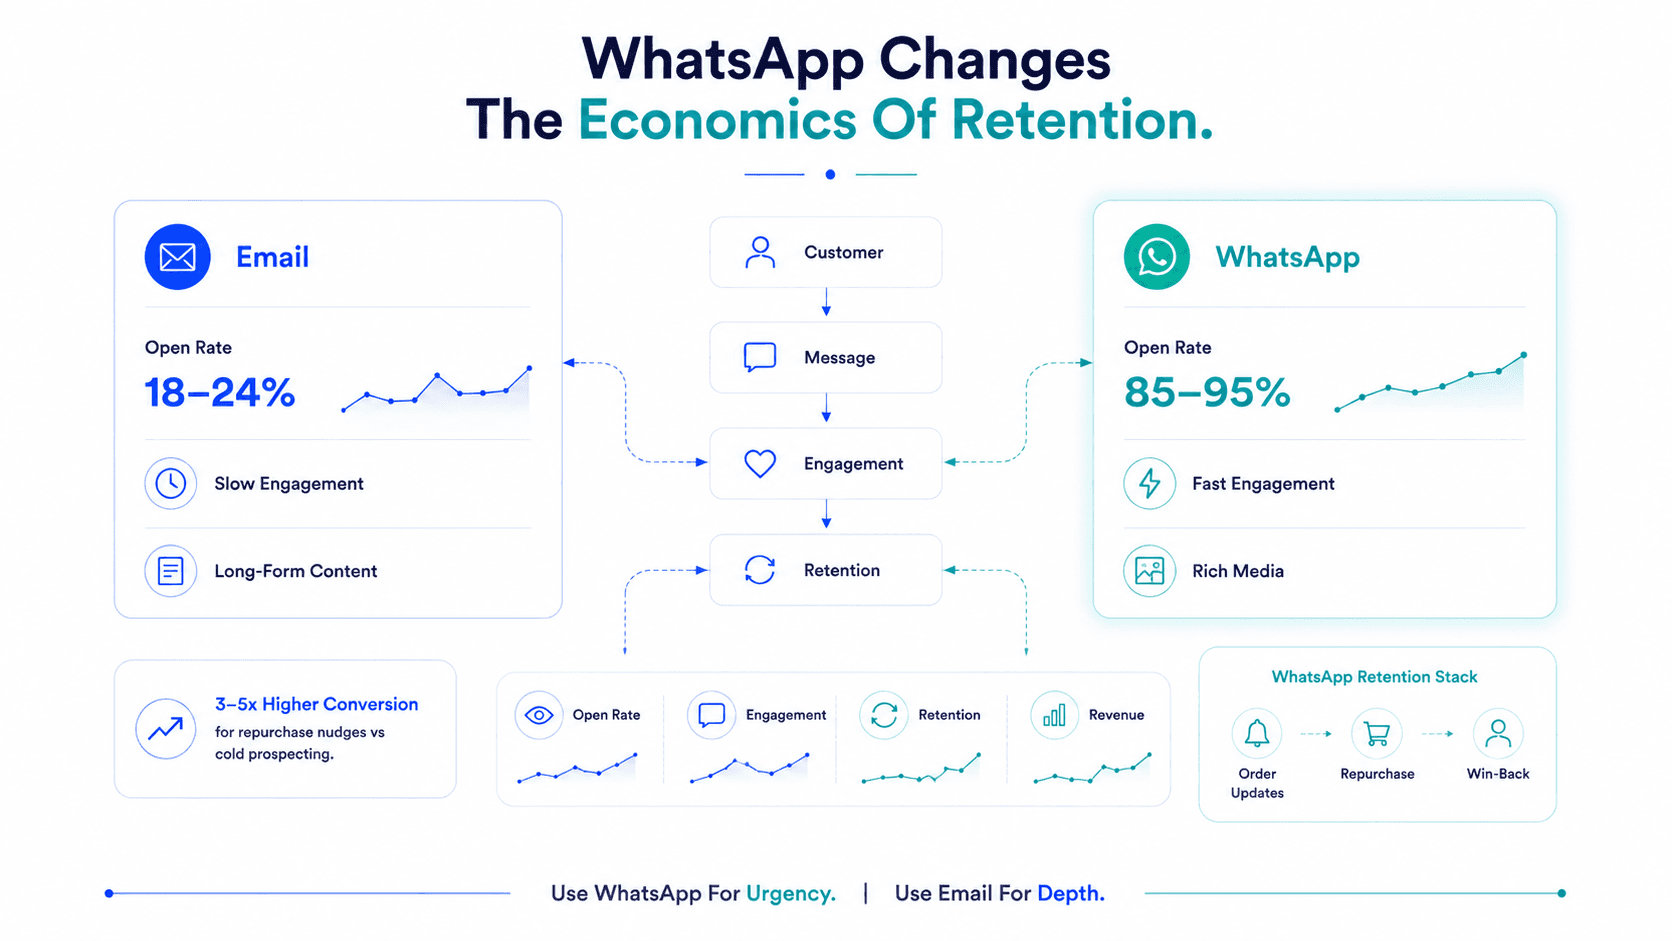
Turn 85–95% WhatsApp open rates into your highest-POAS retention engine with the 5 core sequences and ethical opt-in strategies.

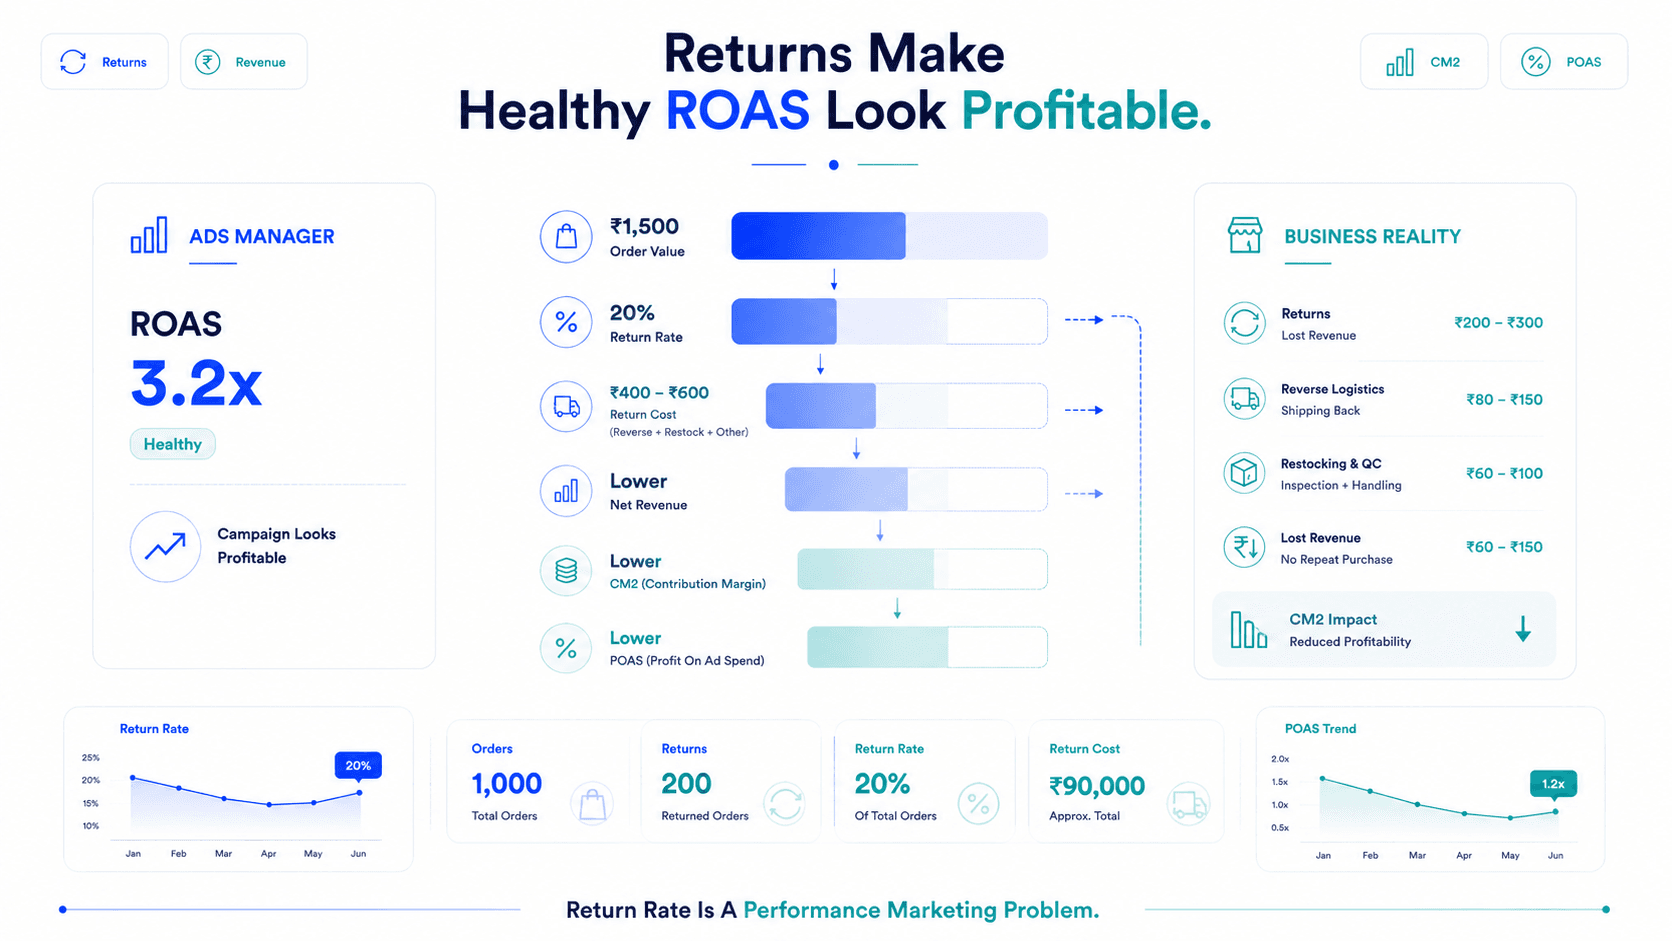
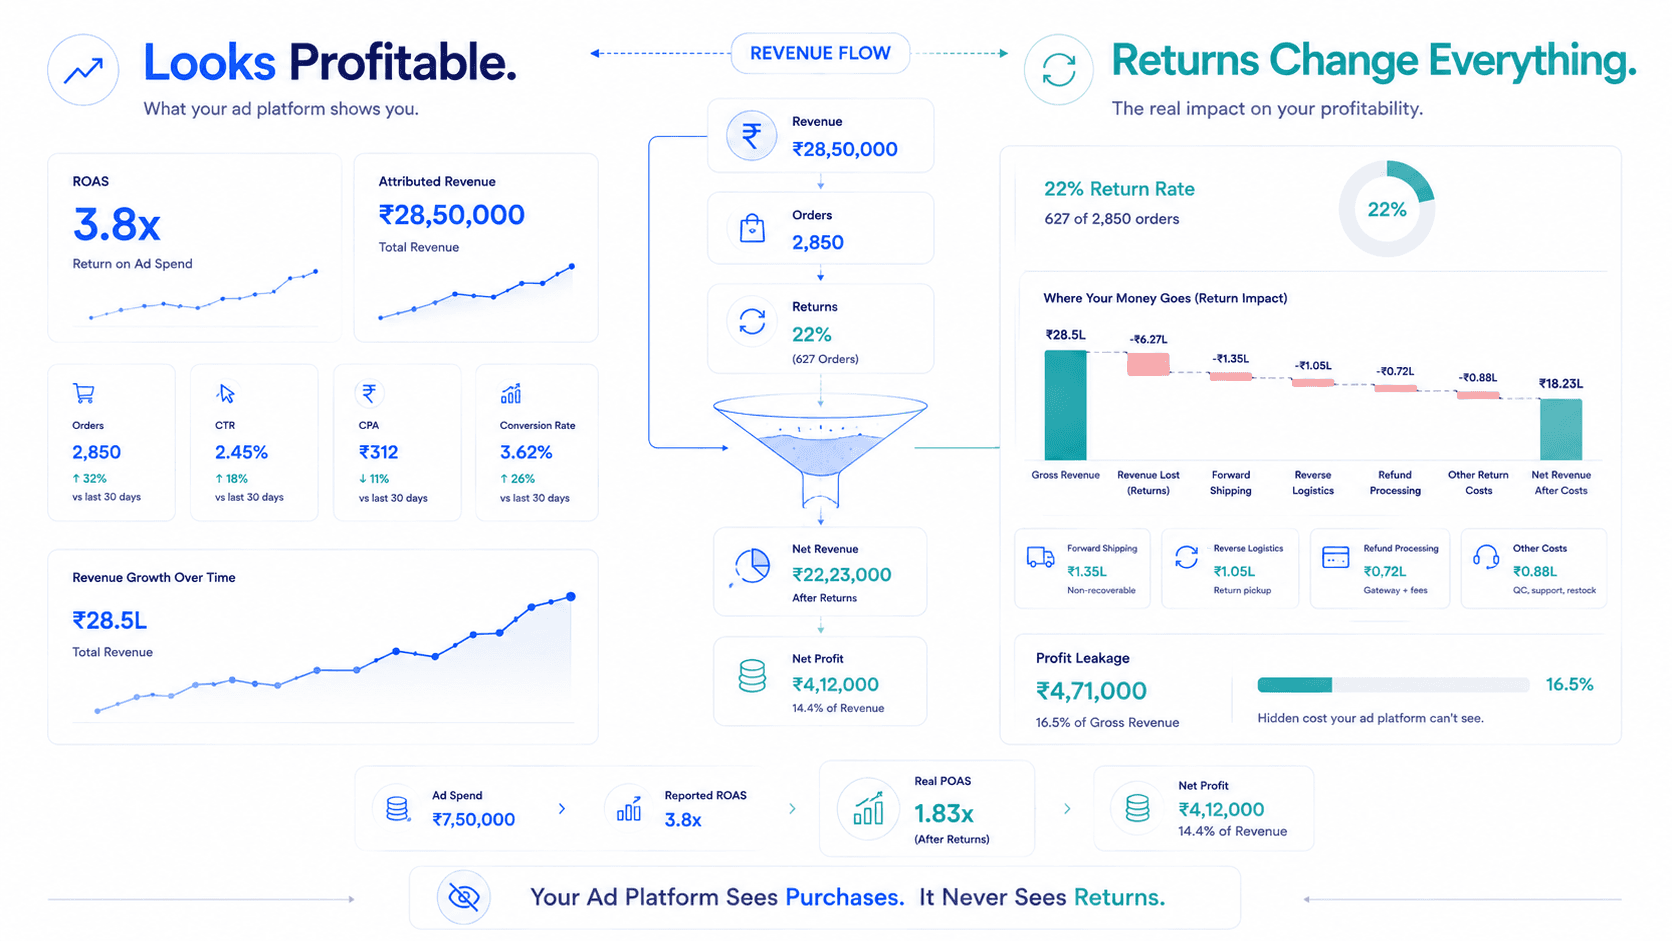
Returns destroy CM2 silently while ad ROAS looks fine. Discover 8 proven tactics to lower return rates and recover lost margin.

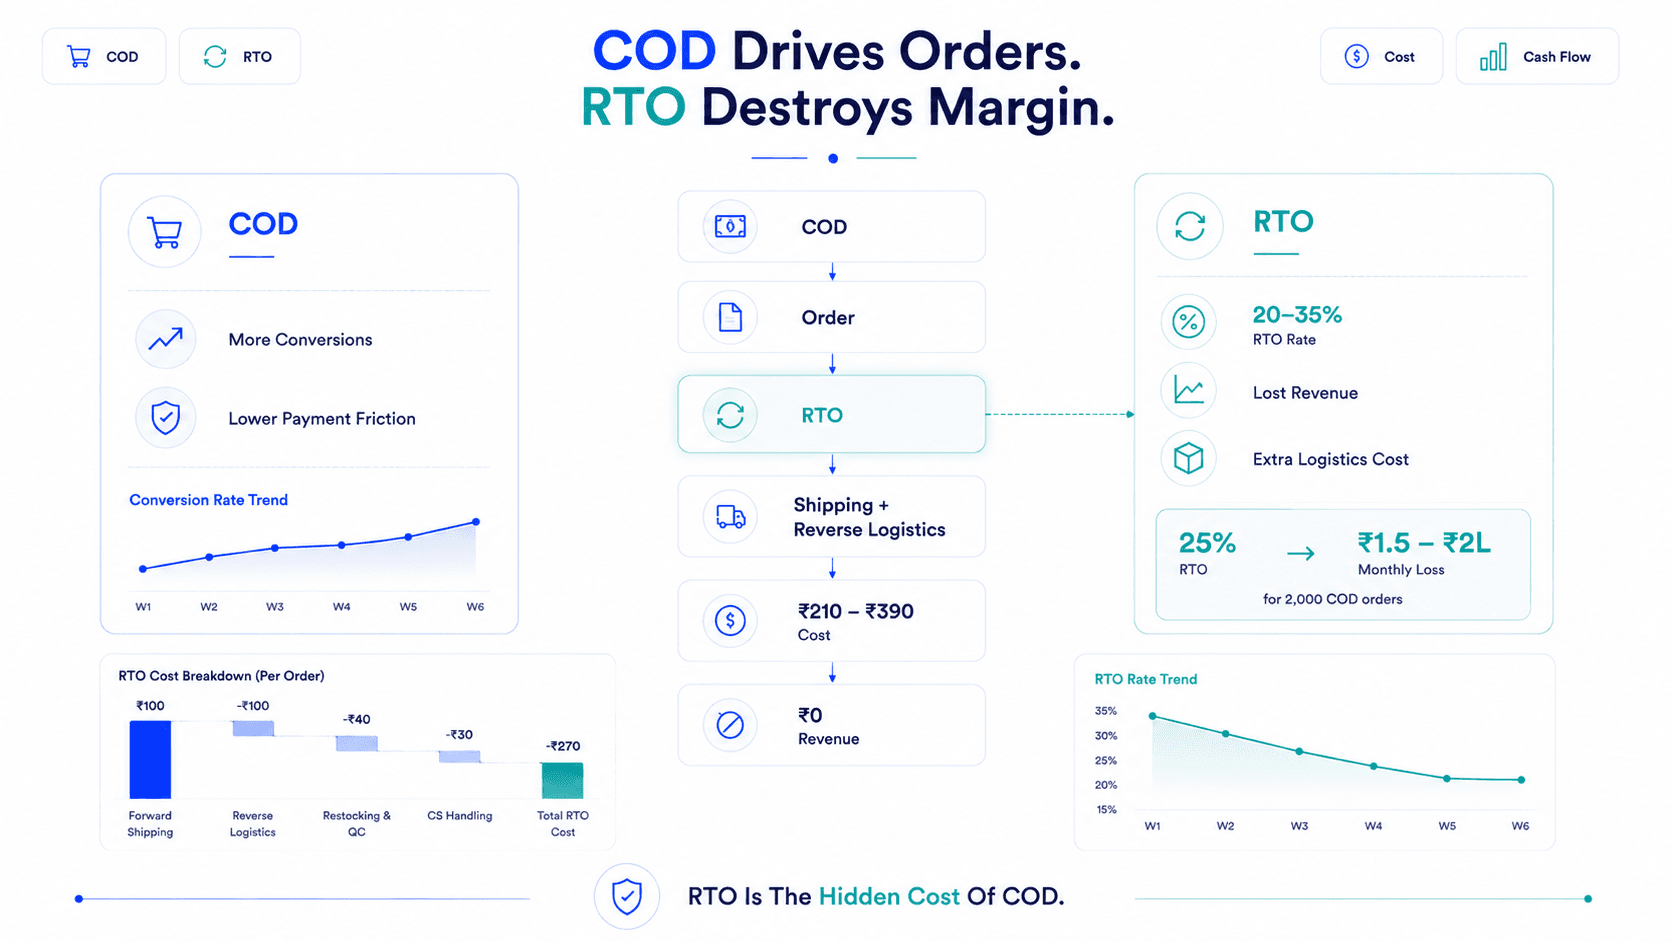
Cut RTO losses by 25–40% without killing checkout conversion volume using IVR confirmation, prepaid incentives, and risk scoring.

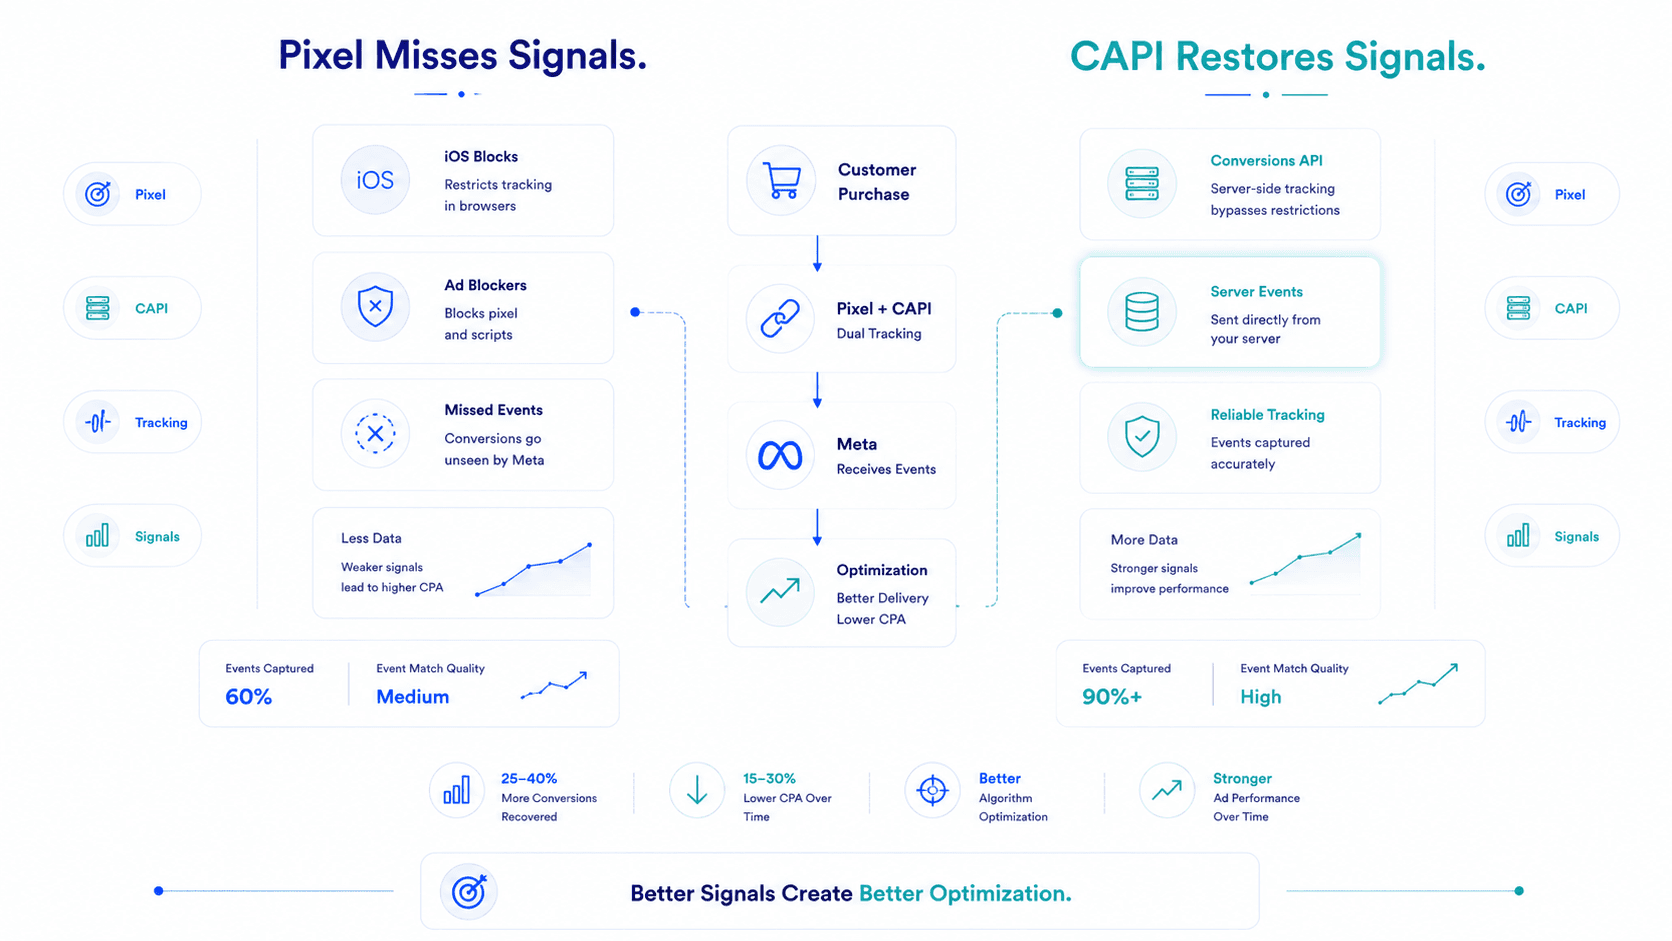
If your Shopify revenue and Meta revenue don't match, Conversions API is one of the most important fixes. Learn how to recover 15-40% of lost conversion signals.

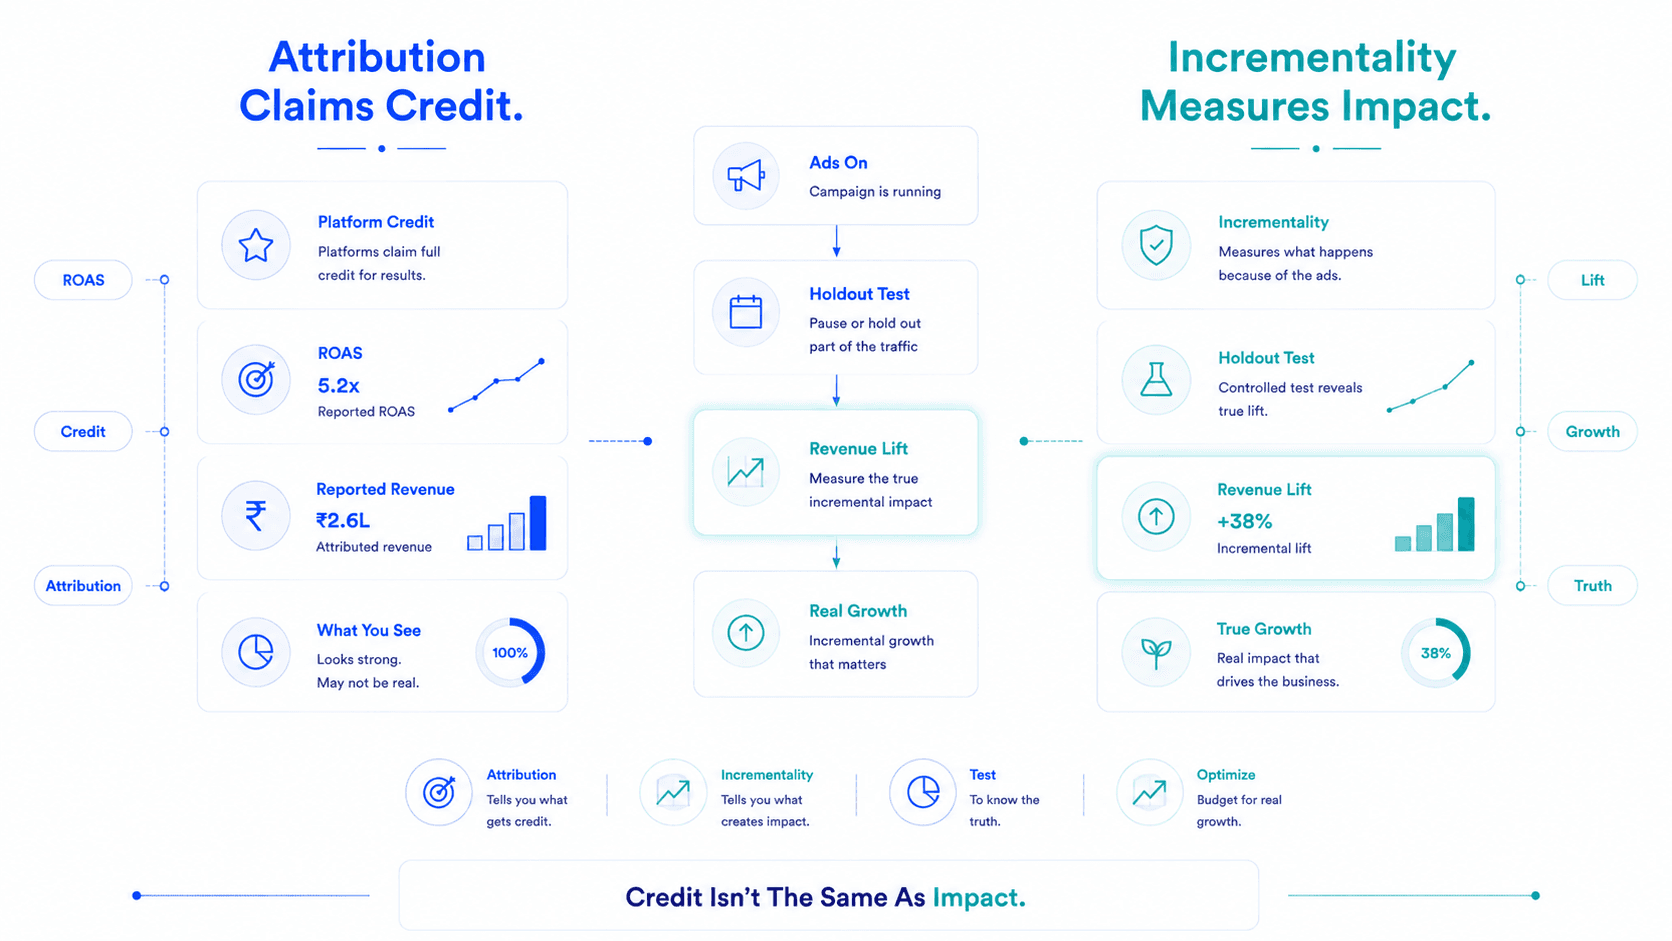
Stop paying for conversions that would happen organically. Learn how to run channel, geo, and audience holdout tests to reveal true incremental revenue.

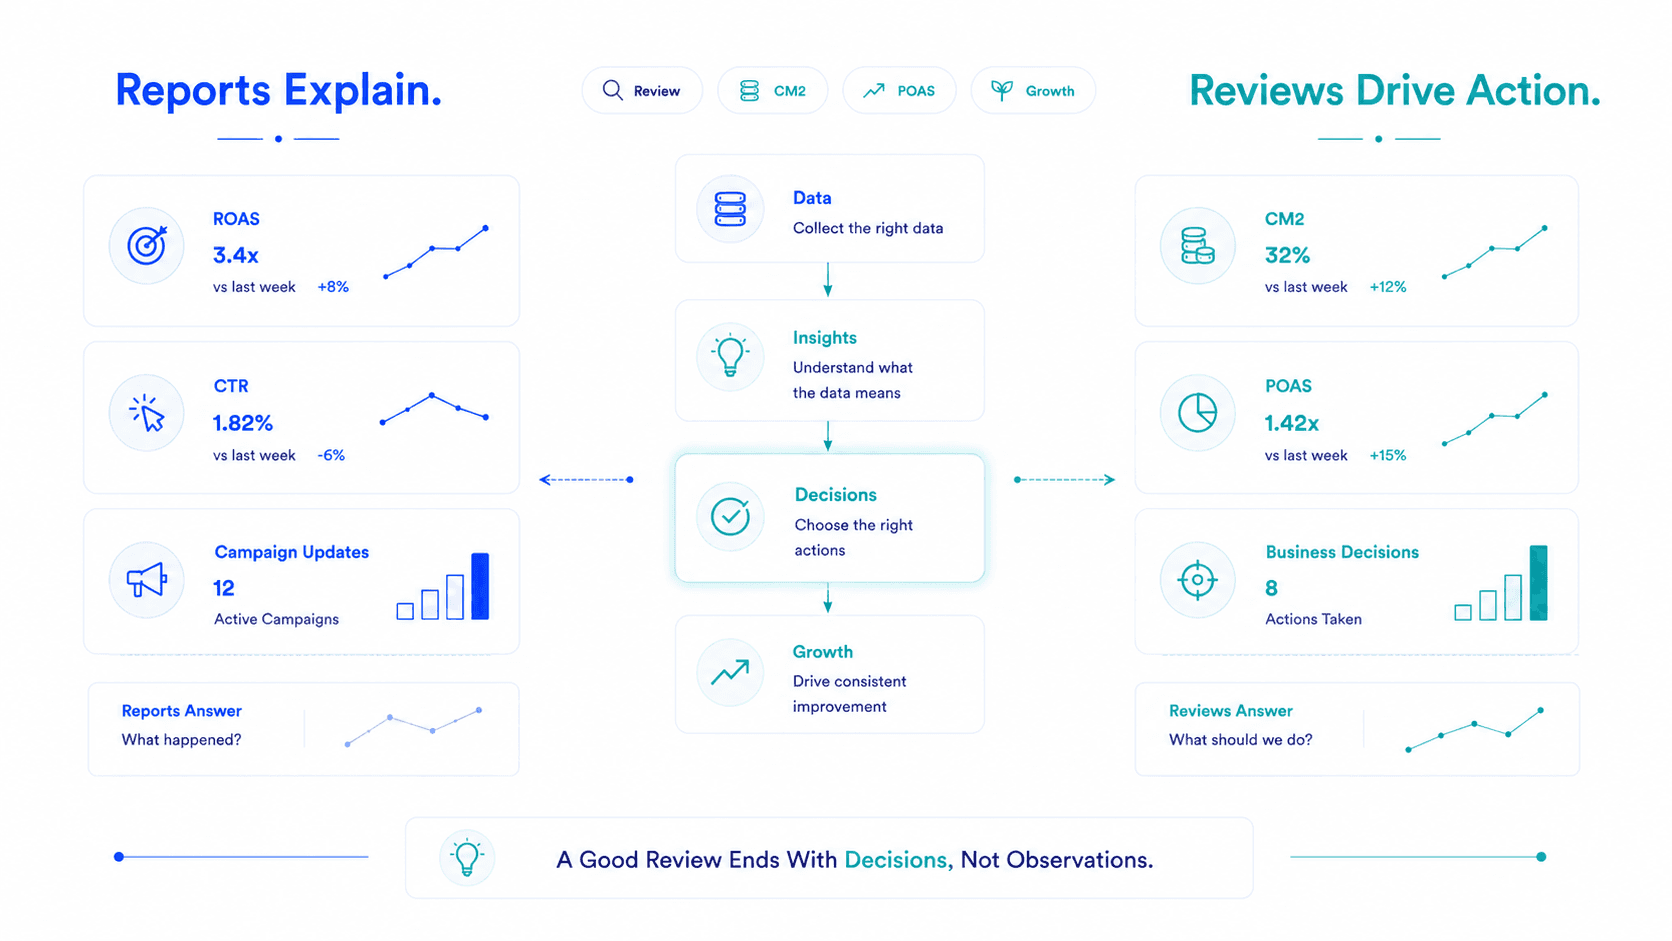
Replace passive ROAS presentations with a 45-minute decision-making framework based on CM2, POAS, MER, and creative fatigue.

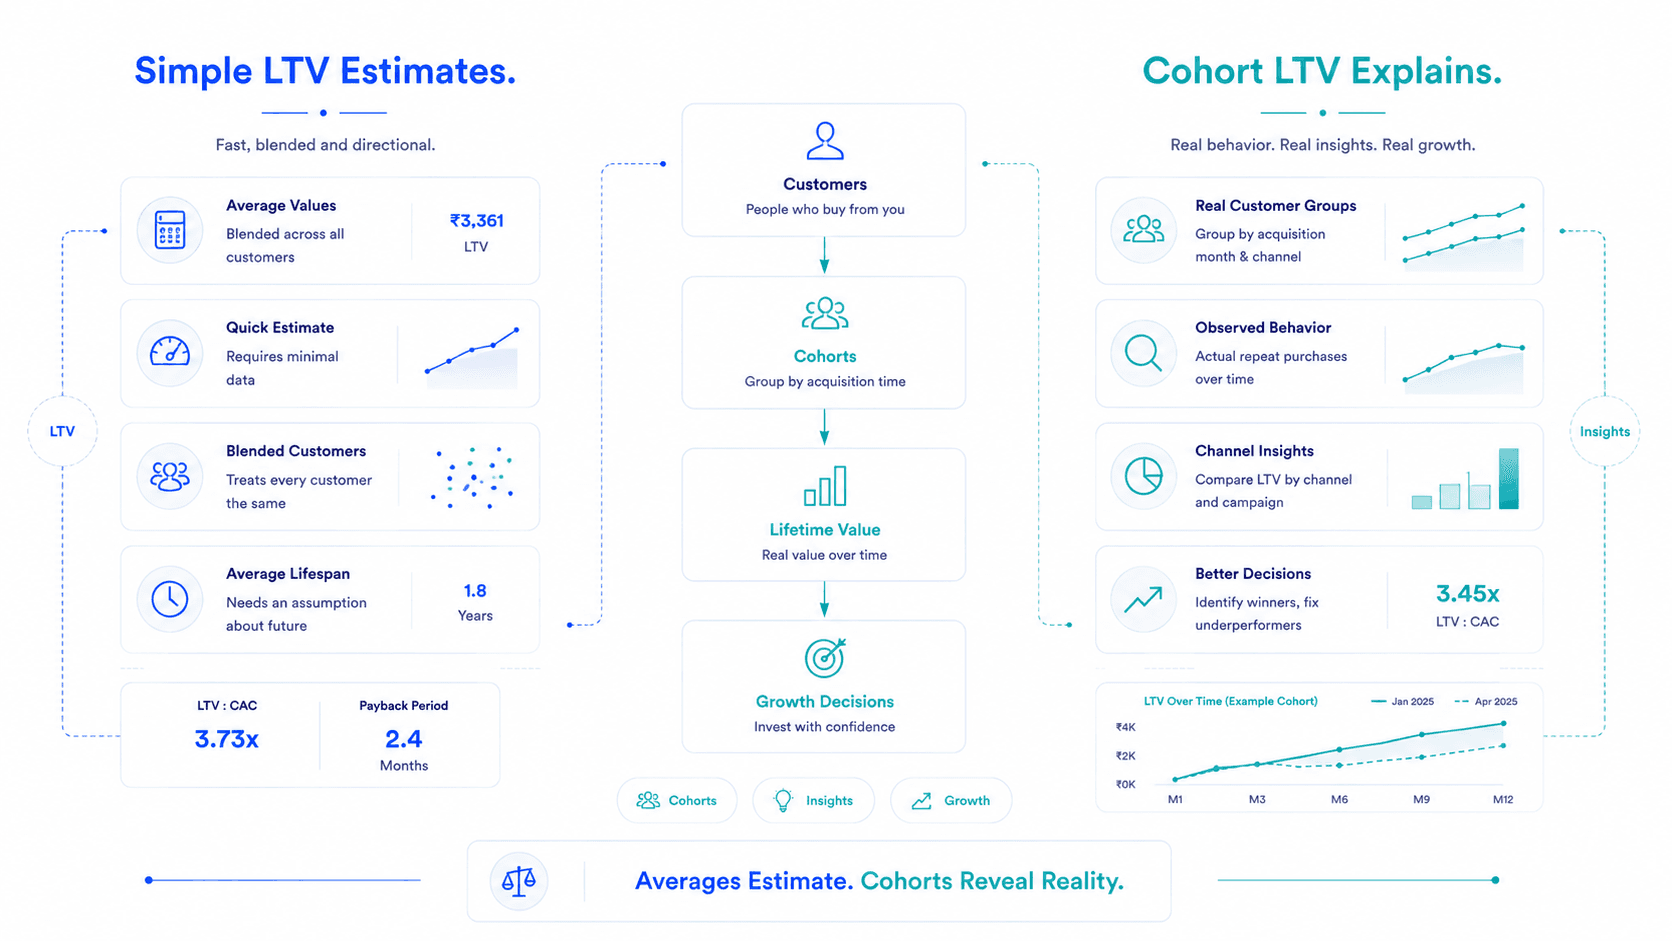
Discover why simple LTV formulas mislead founders and learn how cohort LTV by acquisition channel justifies true CAC payback periods.
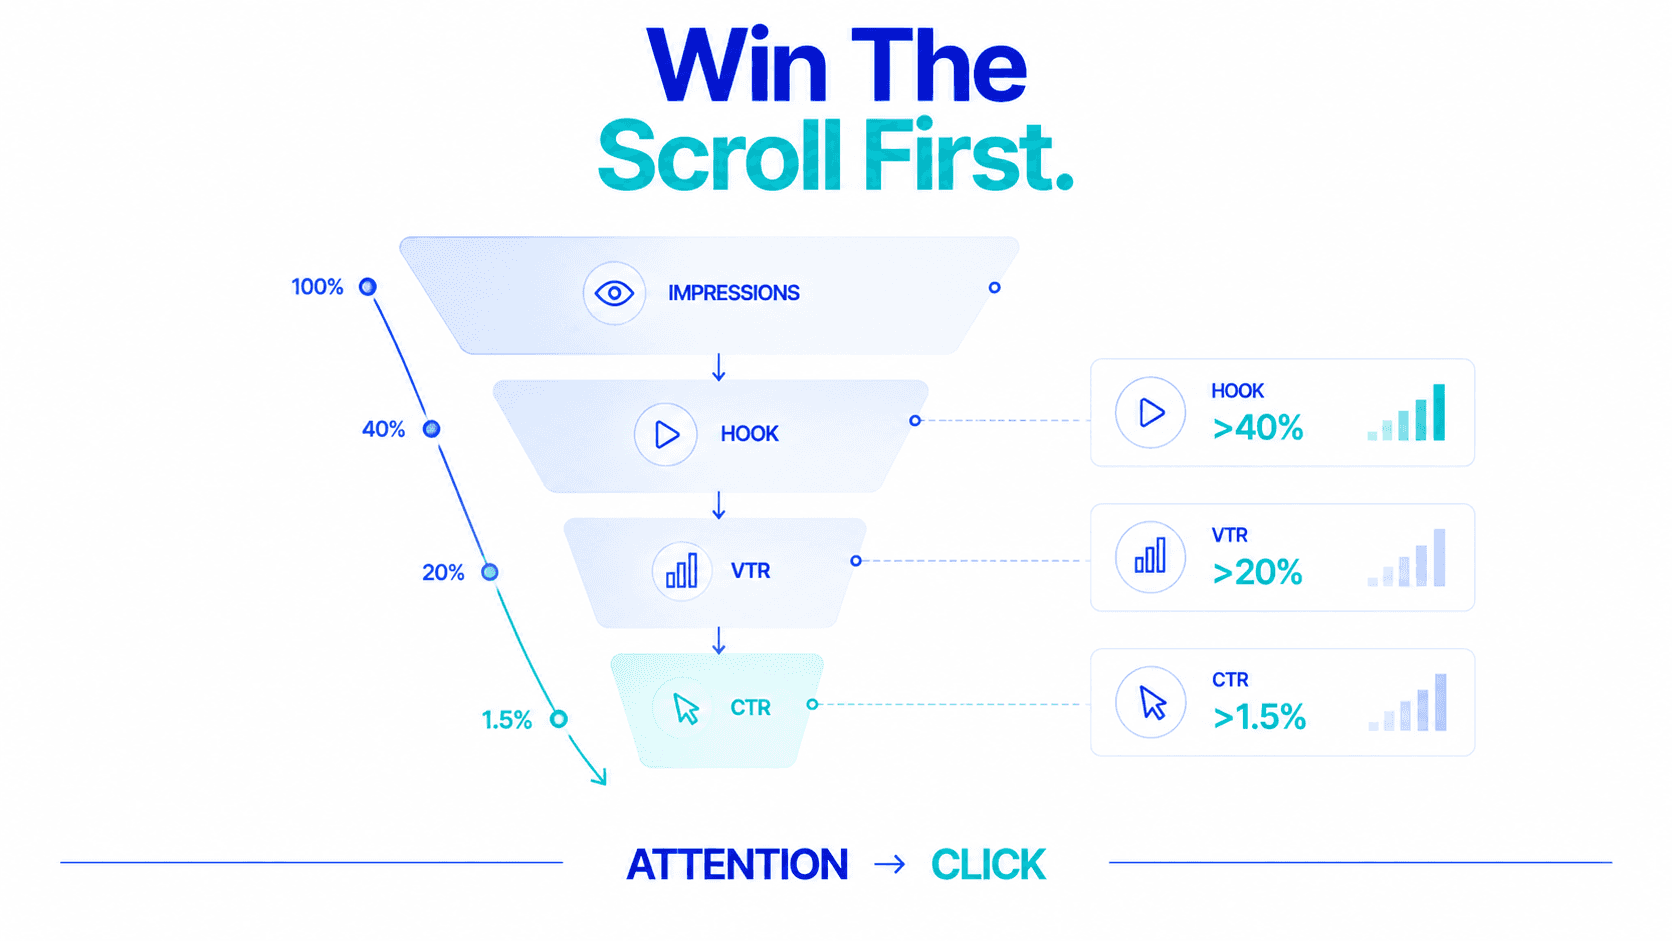
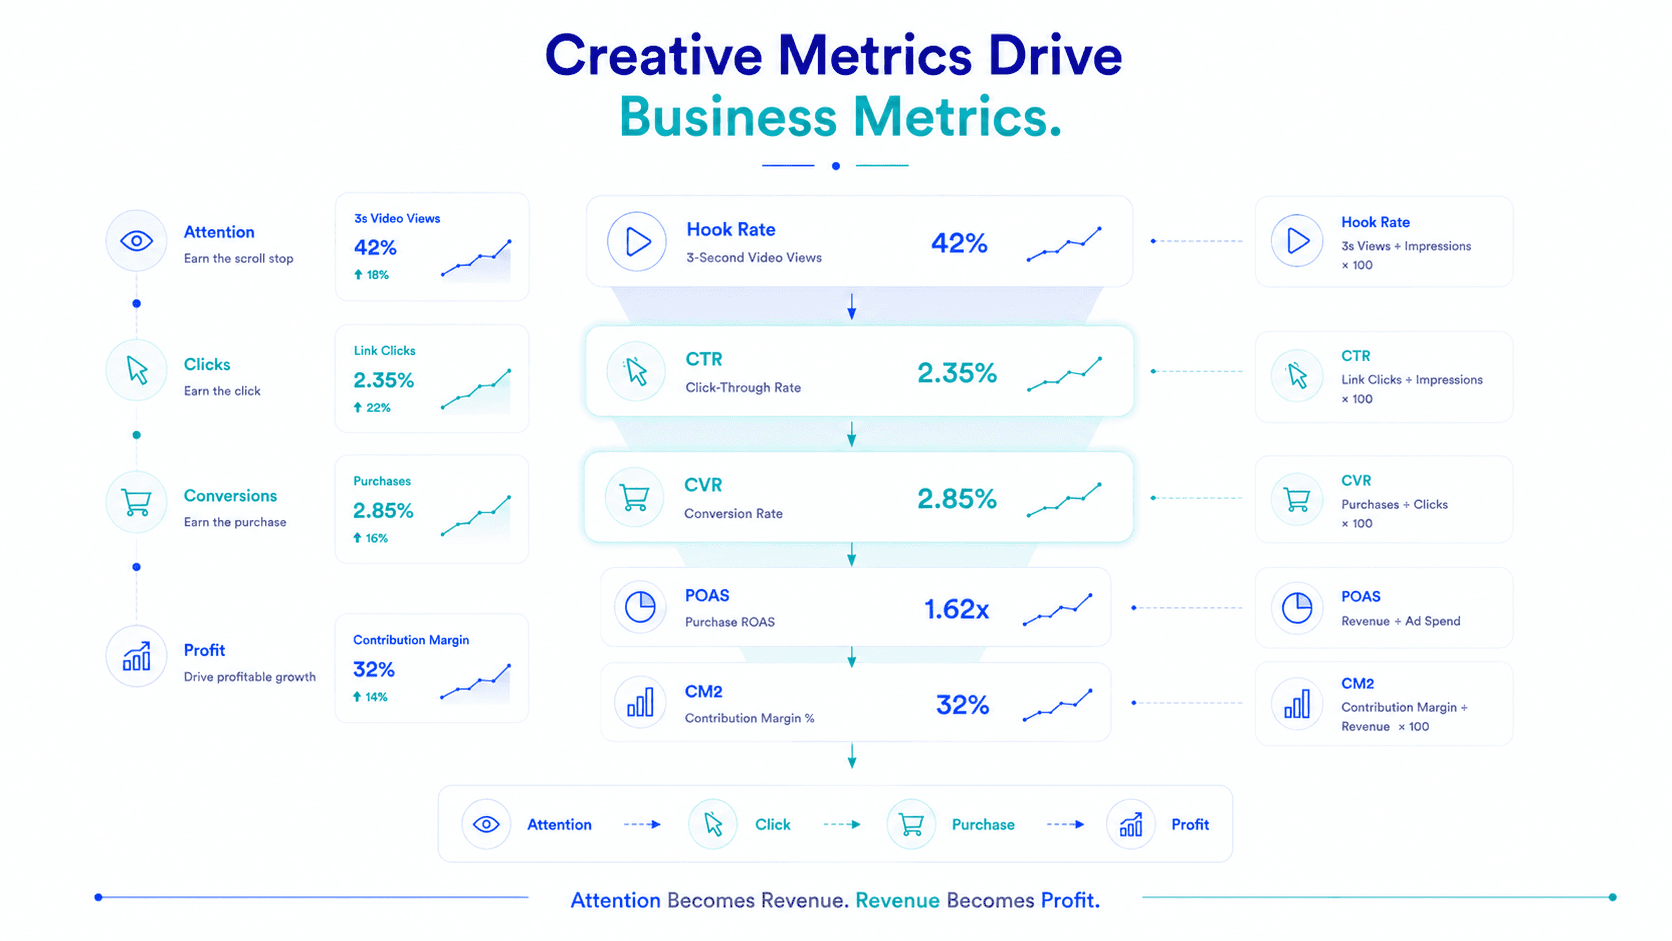
Creative metrics sit upstream of every financial metric. Learn what good looks like across CTR, CVR, Hook Rate, Thumb-Stop Rate, and CPM.

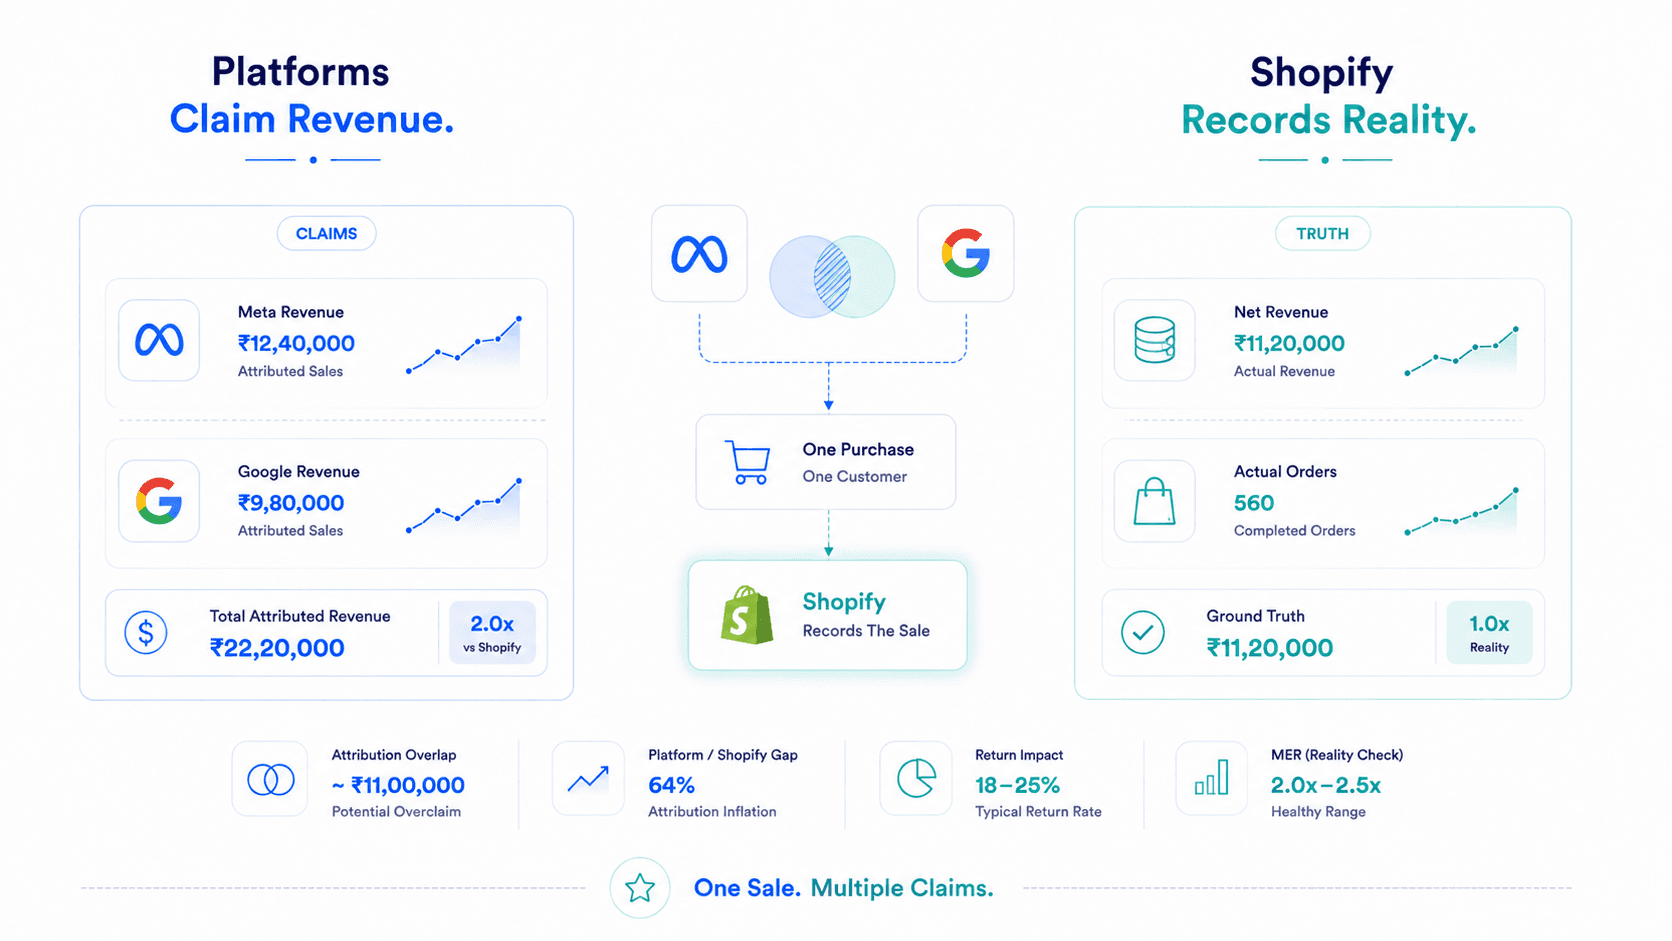
Meta Ads Manager shows ₹18.4L revenue while Shopify shows ₹11.2L. Learn why platform revenue reports disagree and how to reconcile the gap.

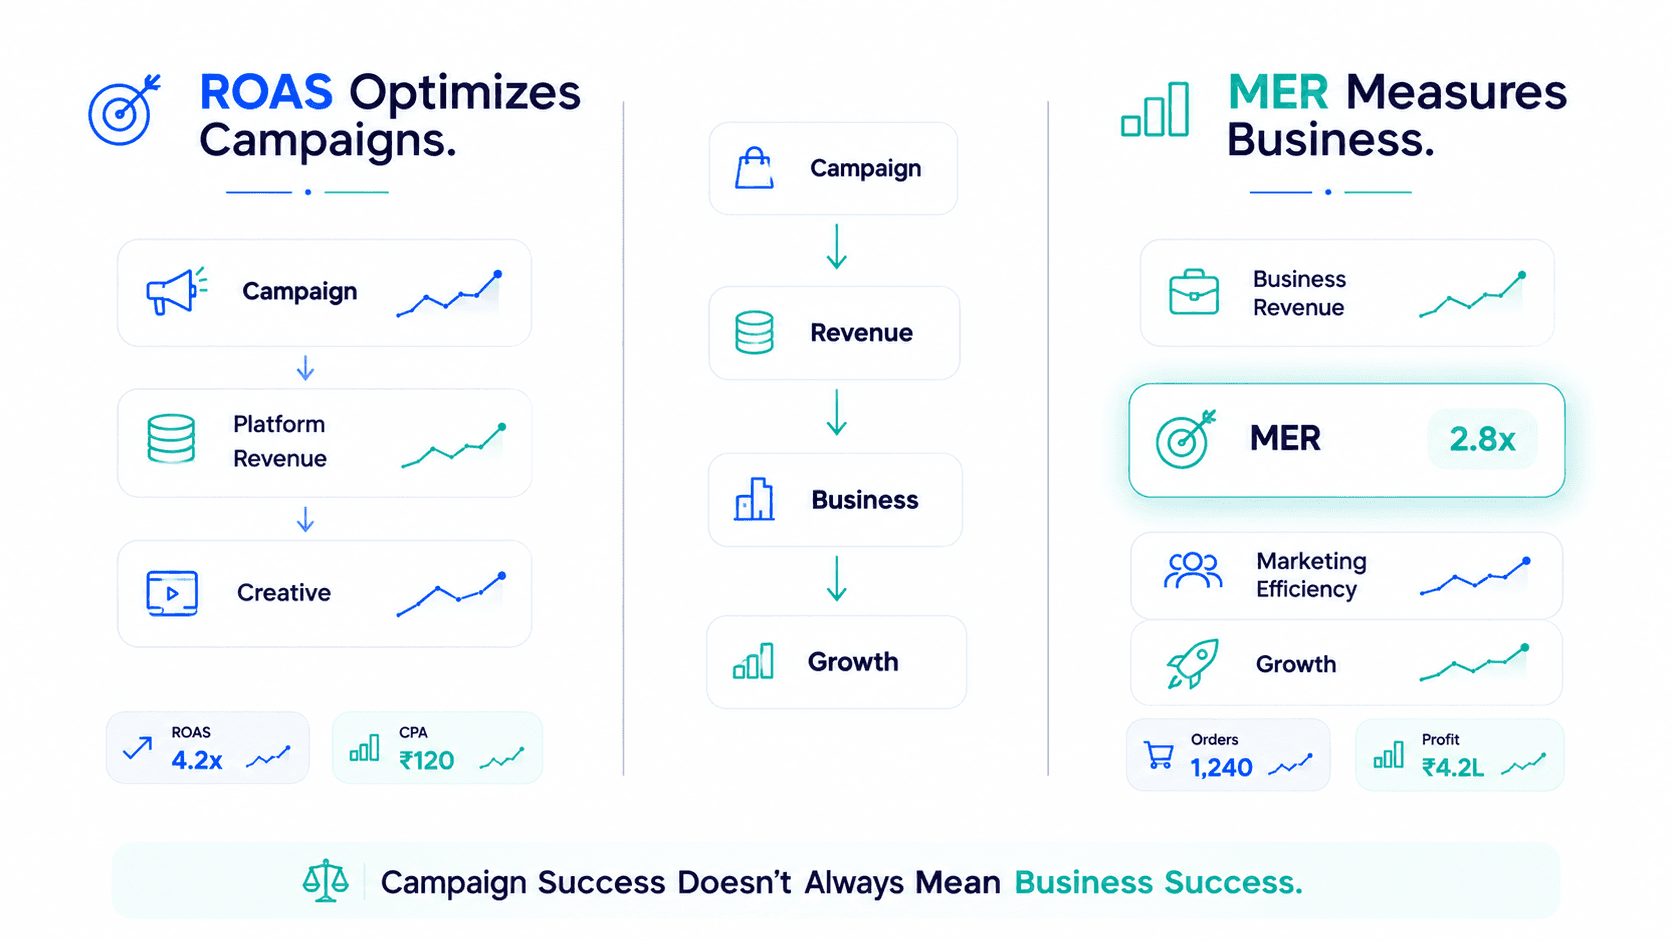
ROAS measures channel-level platform returns, while MER measures total business efficiency. Discover how to use both metrics together.

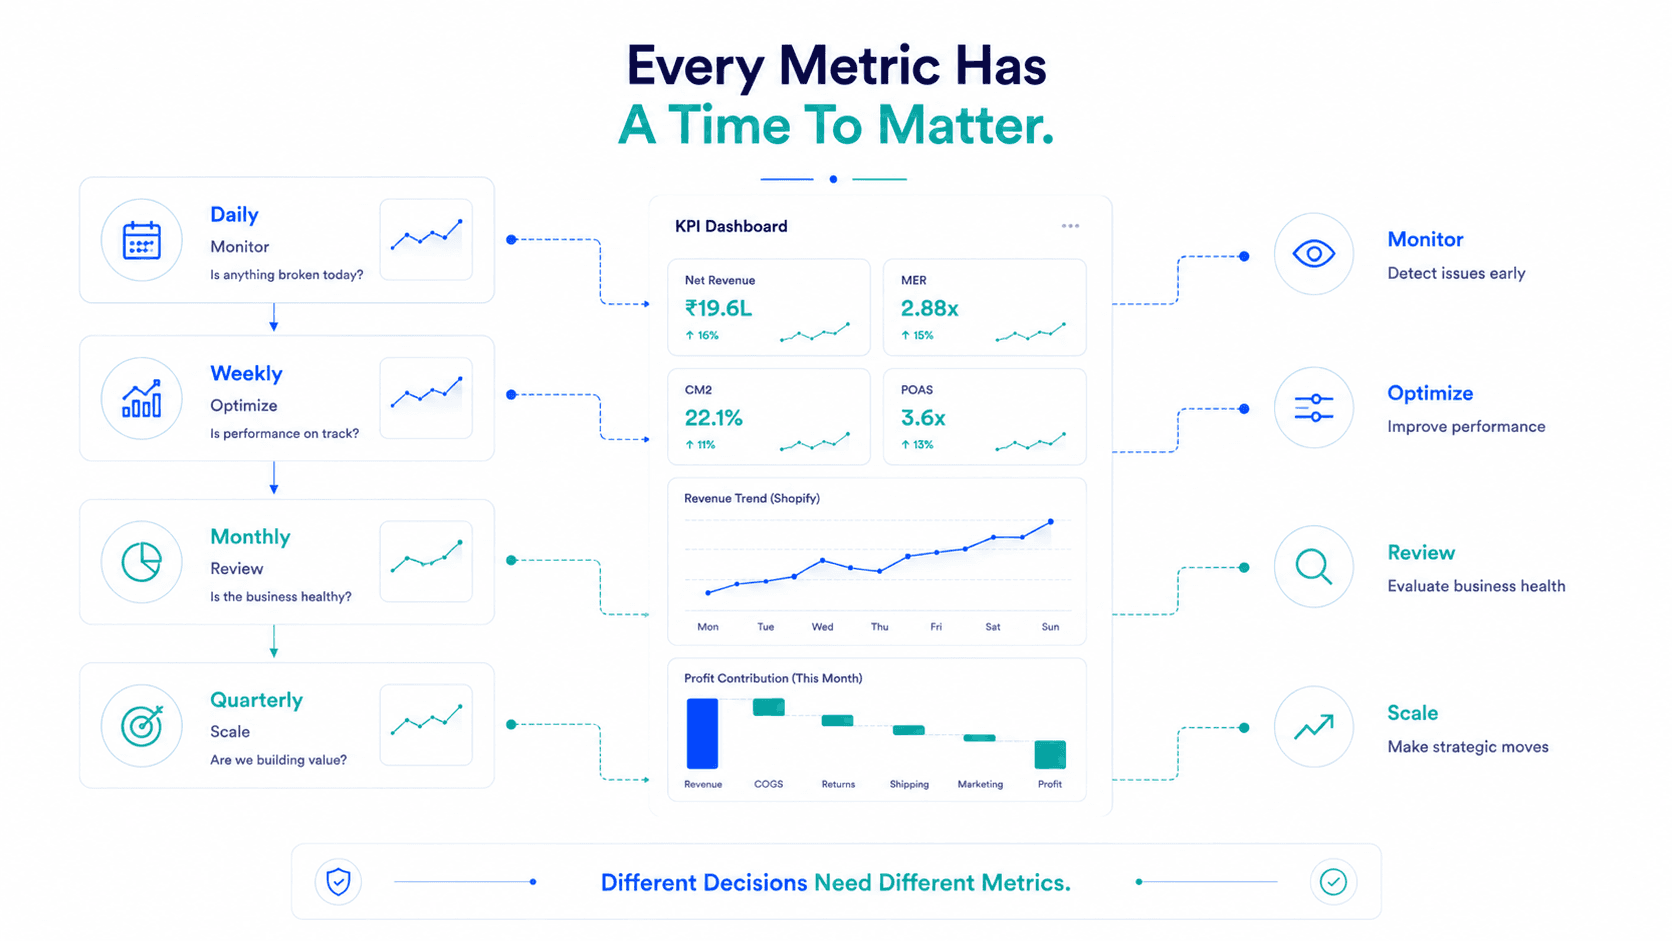
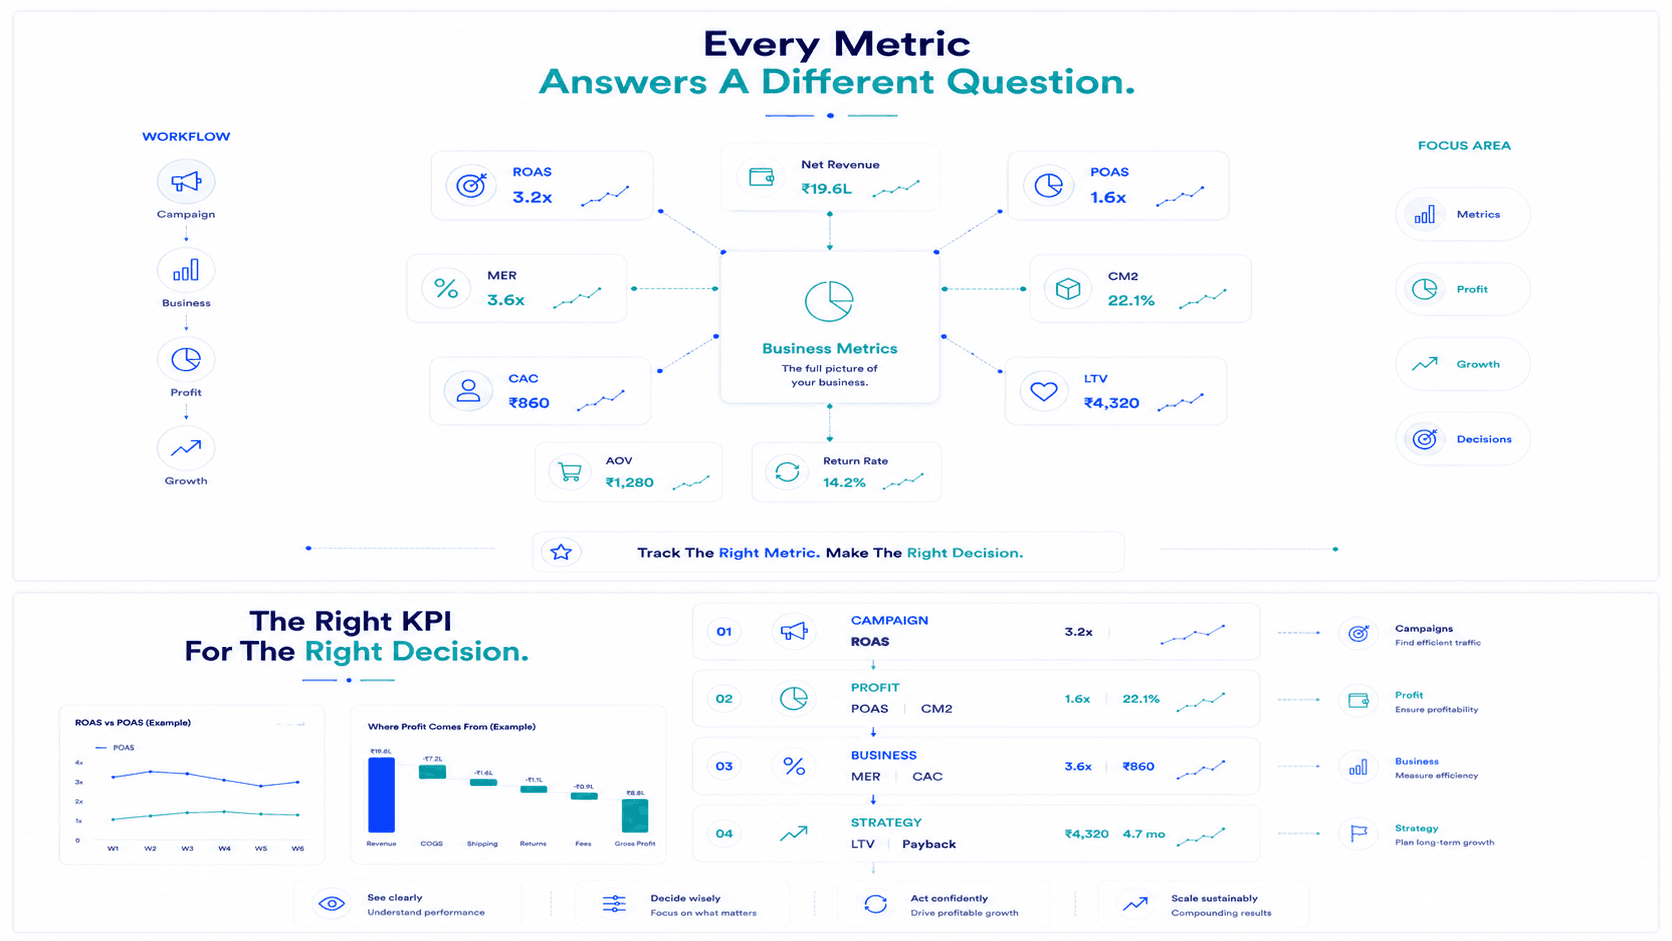
Organize your D2C metrics into 4 decision tiers: Daily Media Buying, Weekly Channel Allocation, Monthly Unit Economics, and Board/CEO Reporting.

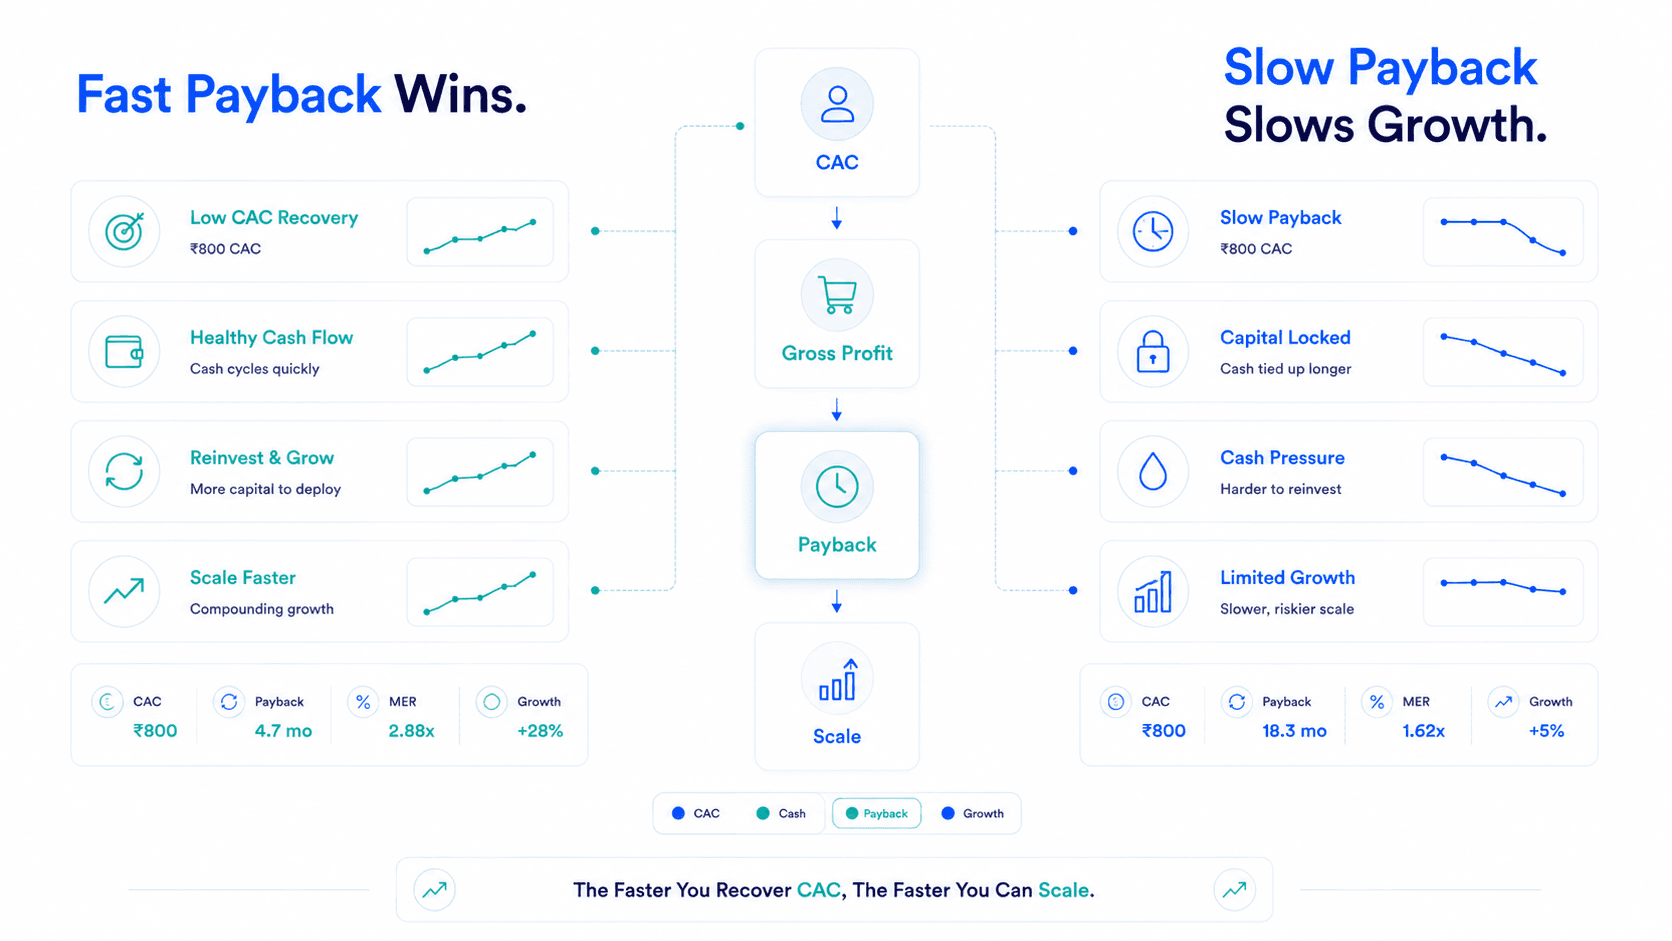
Why two brands with identical CAC have completely different cash paths. Learn how CAC payback period dictates how fast your D2C brand can scale.

The definitive 2026 D2C glossary covering ROAS, POAS, MER, CAC, LTV, CM1, CM2, AOV, CPA, CTR, CVR, CAPI, RTO, tROAS with exact formulas and benchmarks.

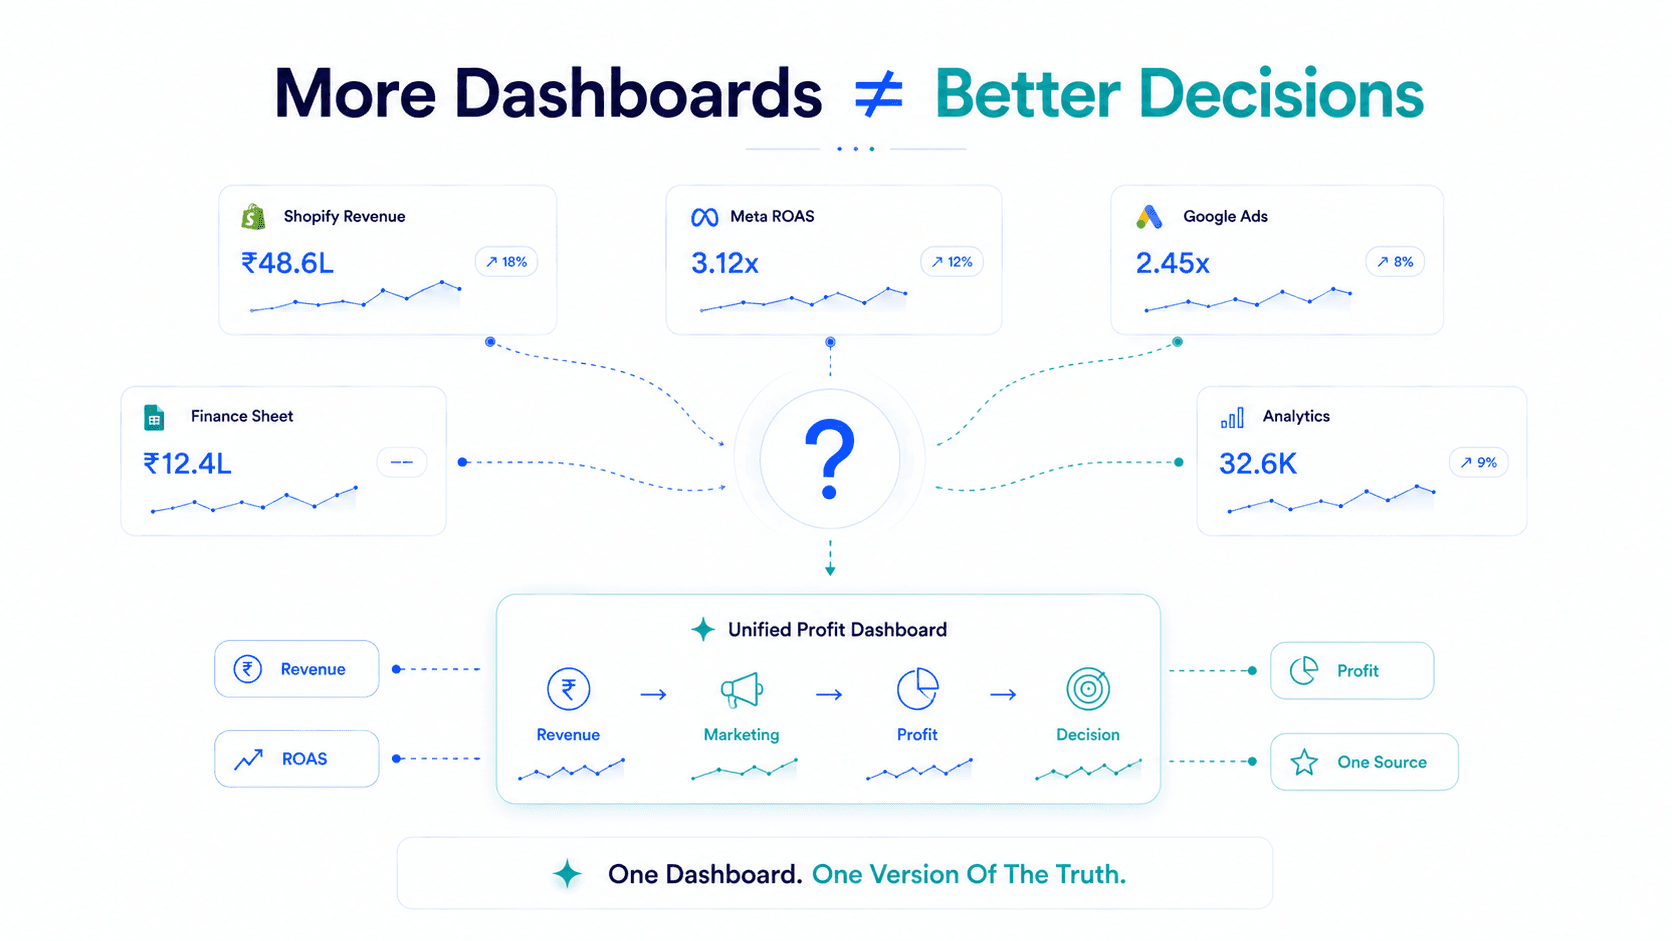
Most D2C founders don't have a dashboard problem — they have too many dashboards telling different stories. Here is the 5-layer framework.

Meta Advantage+ and Google PMax optimize for revenue by default. Here is why revenue-optimized AI can scale losses efficiently.

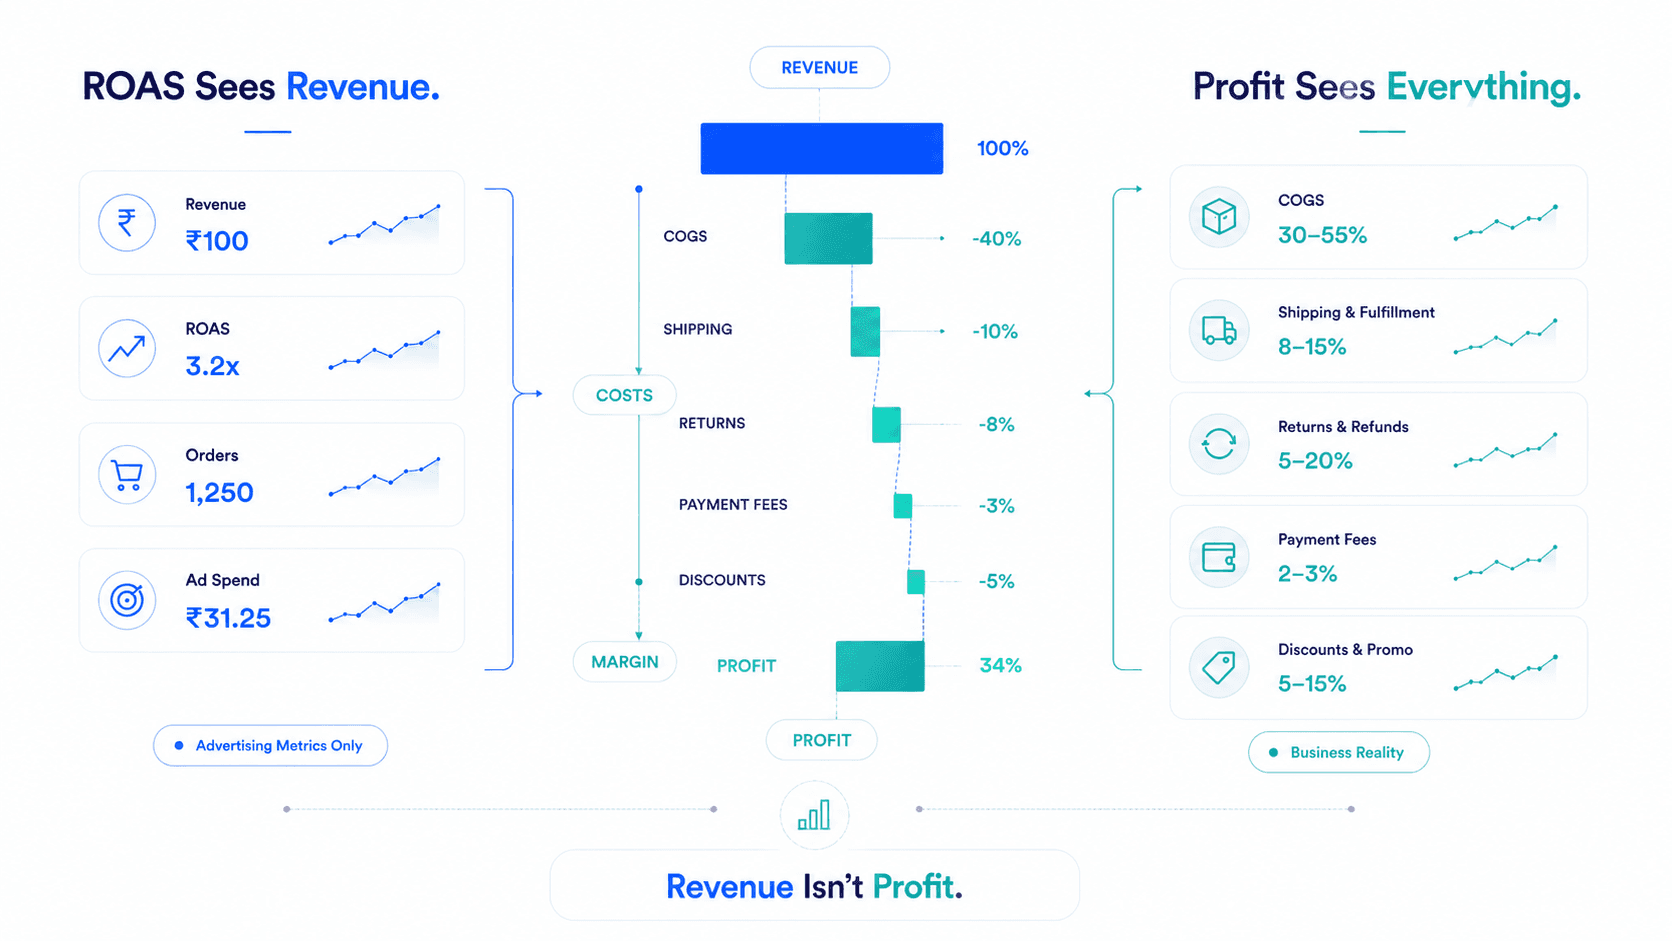
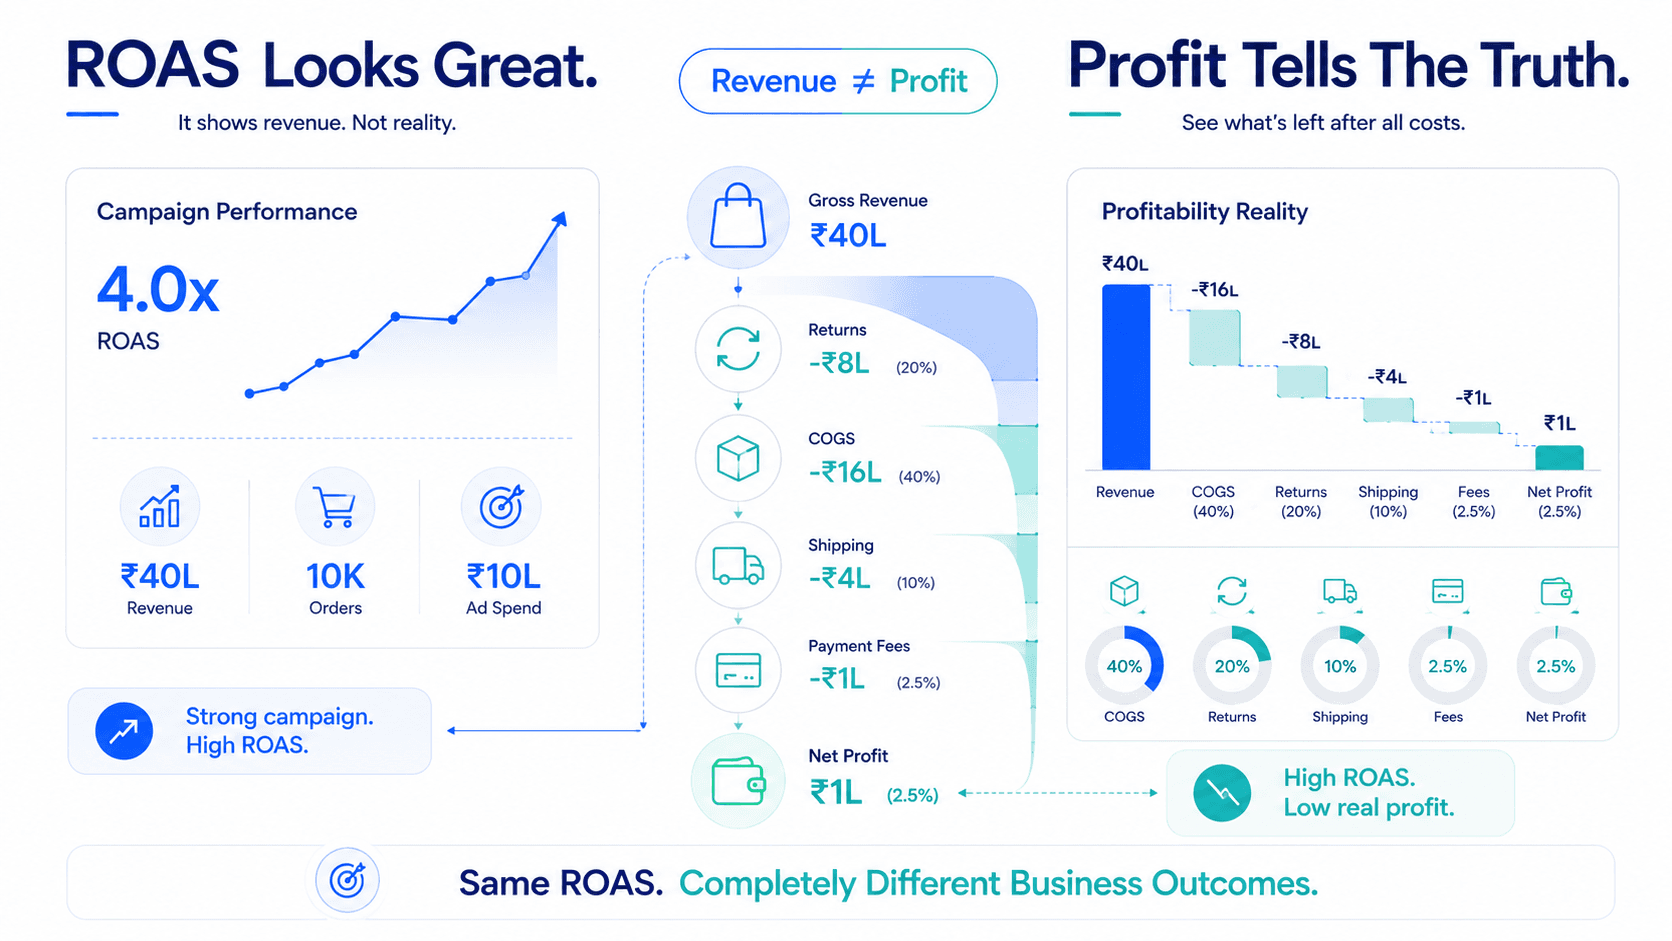
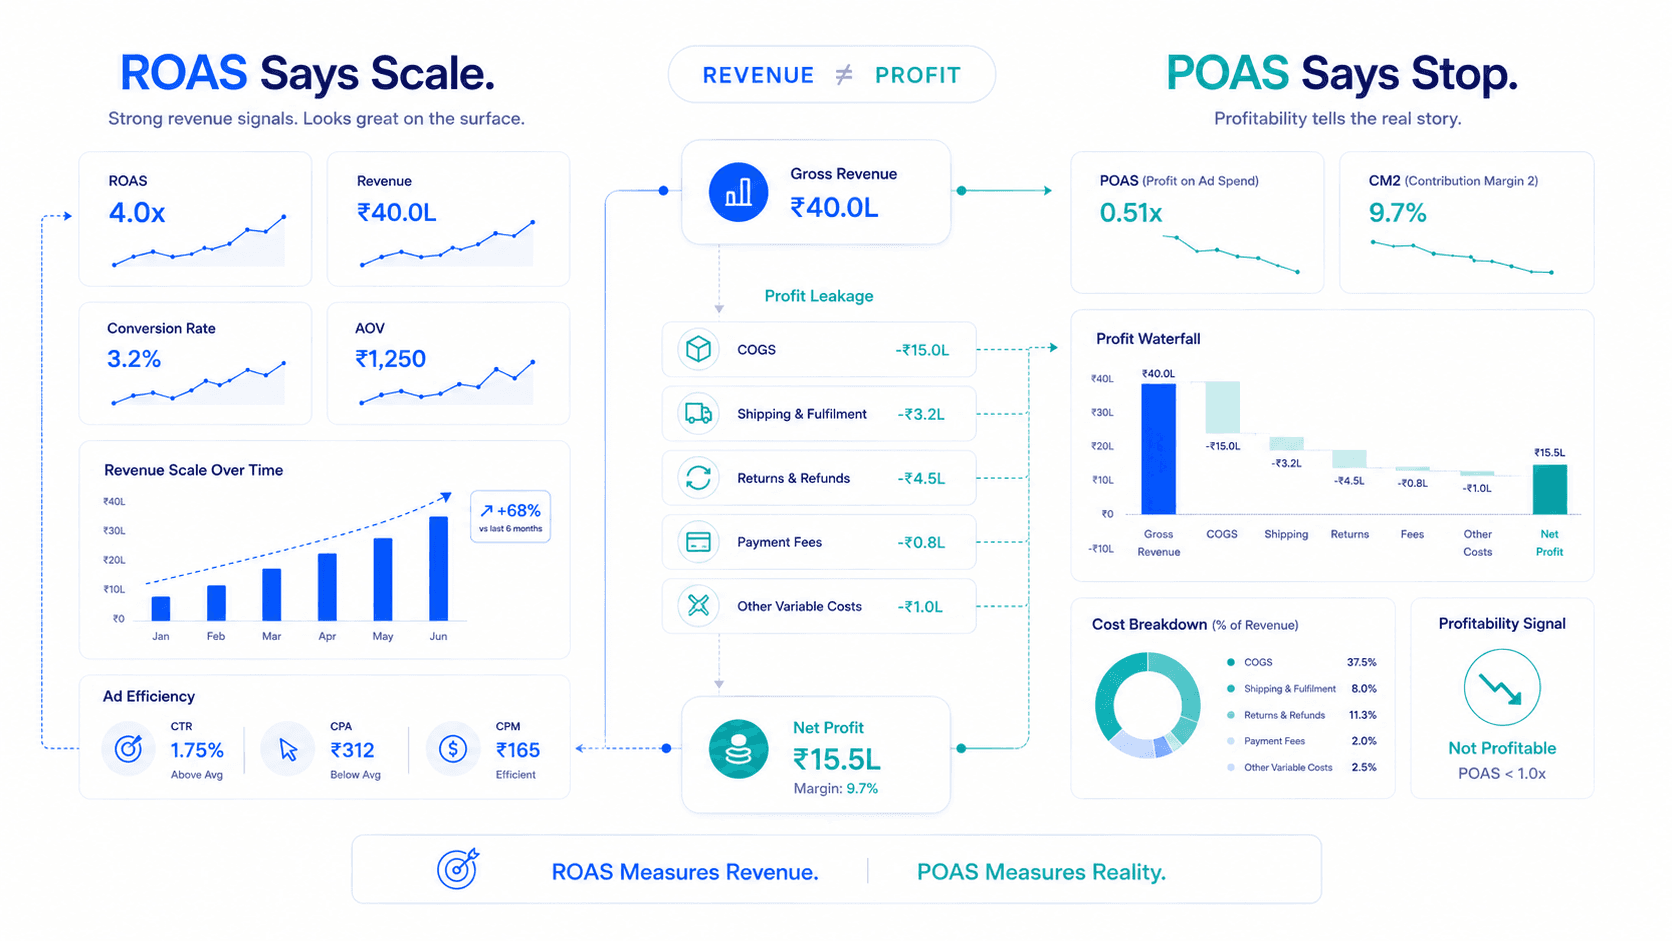
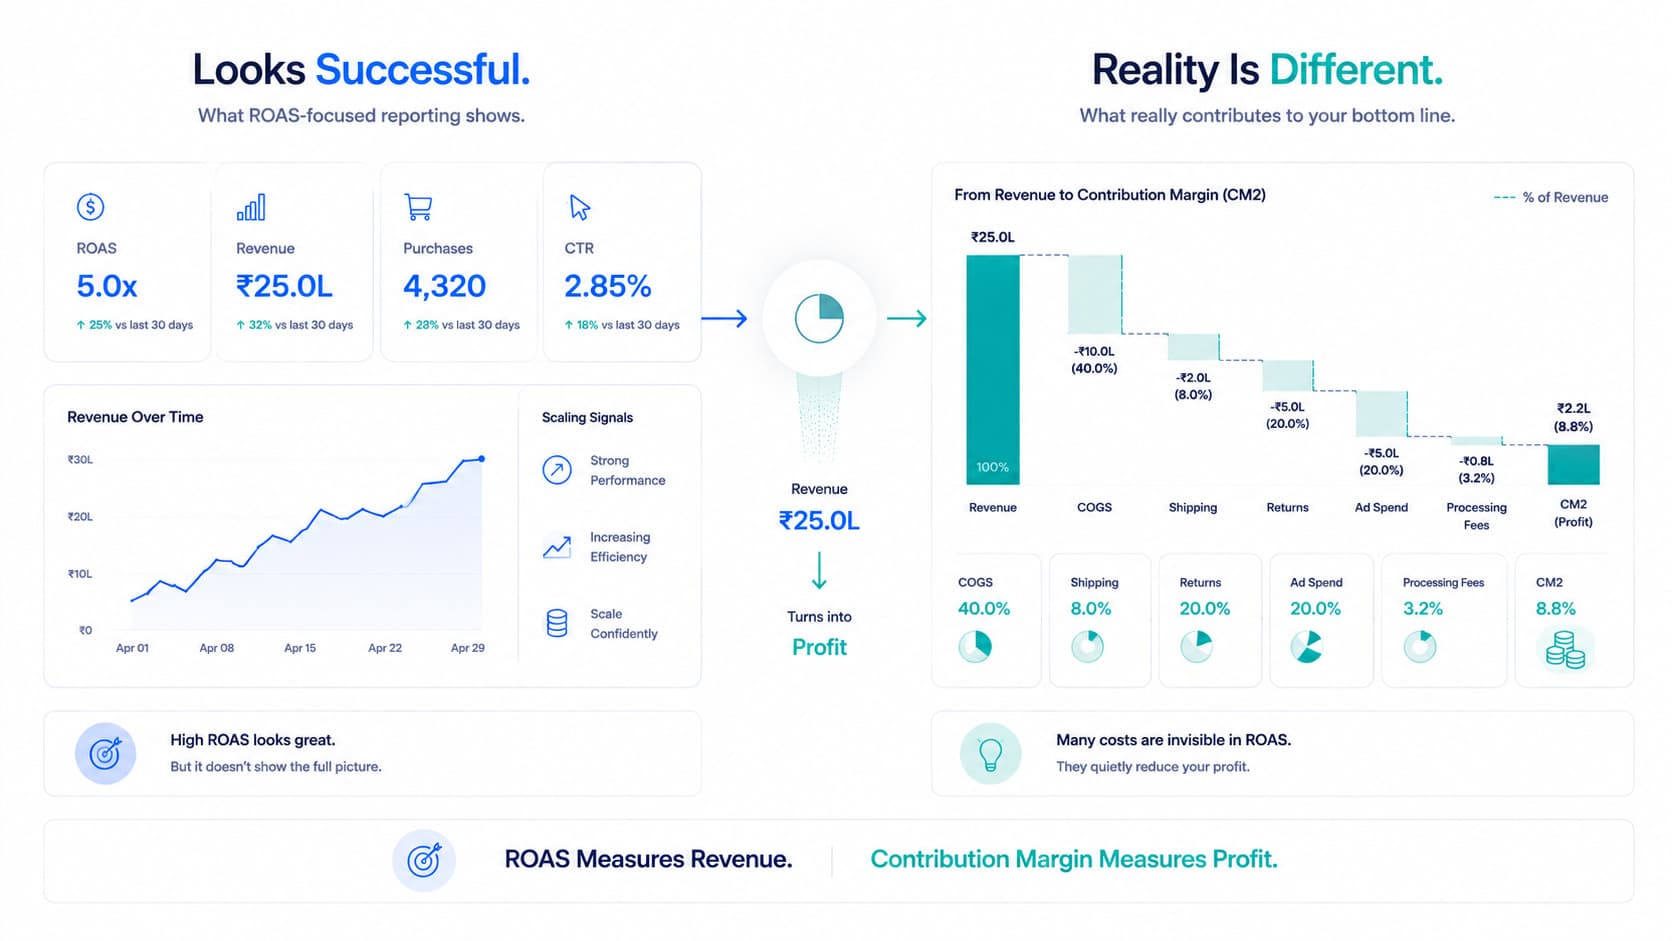
ROAS ignores COGS, shipping, payment fees, and return rates. Discover how these hidden cost categories silently destroy D2C margins.

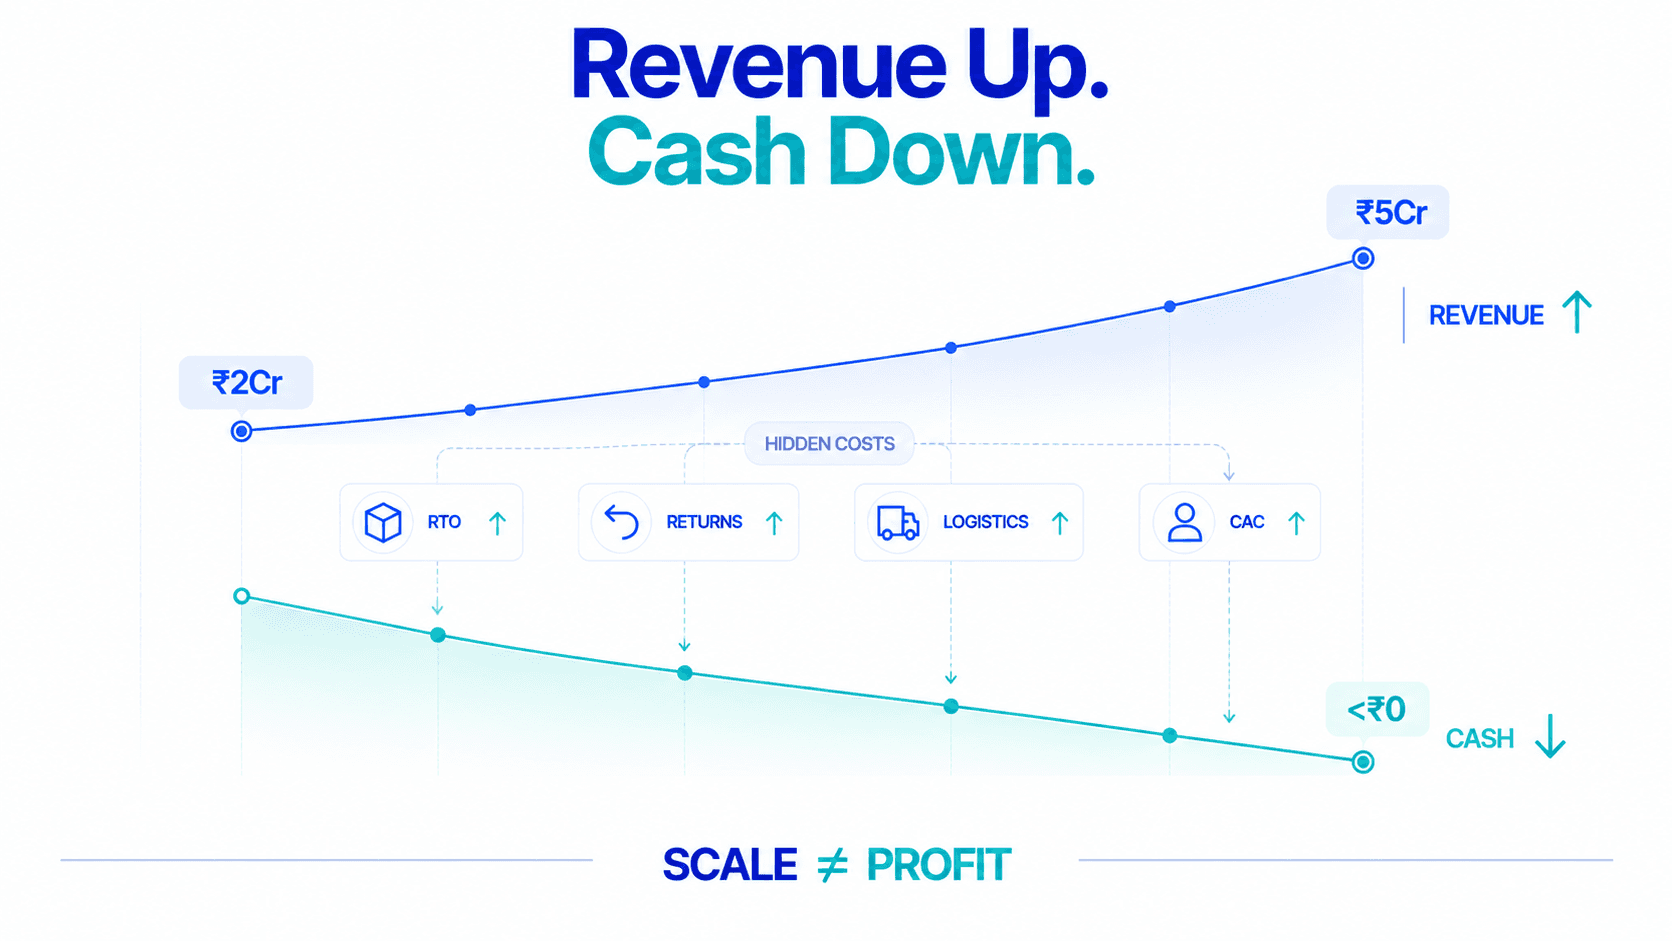
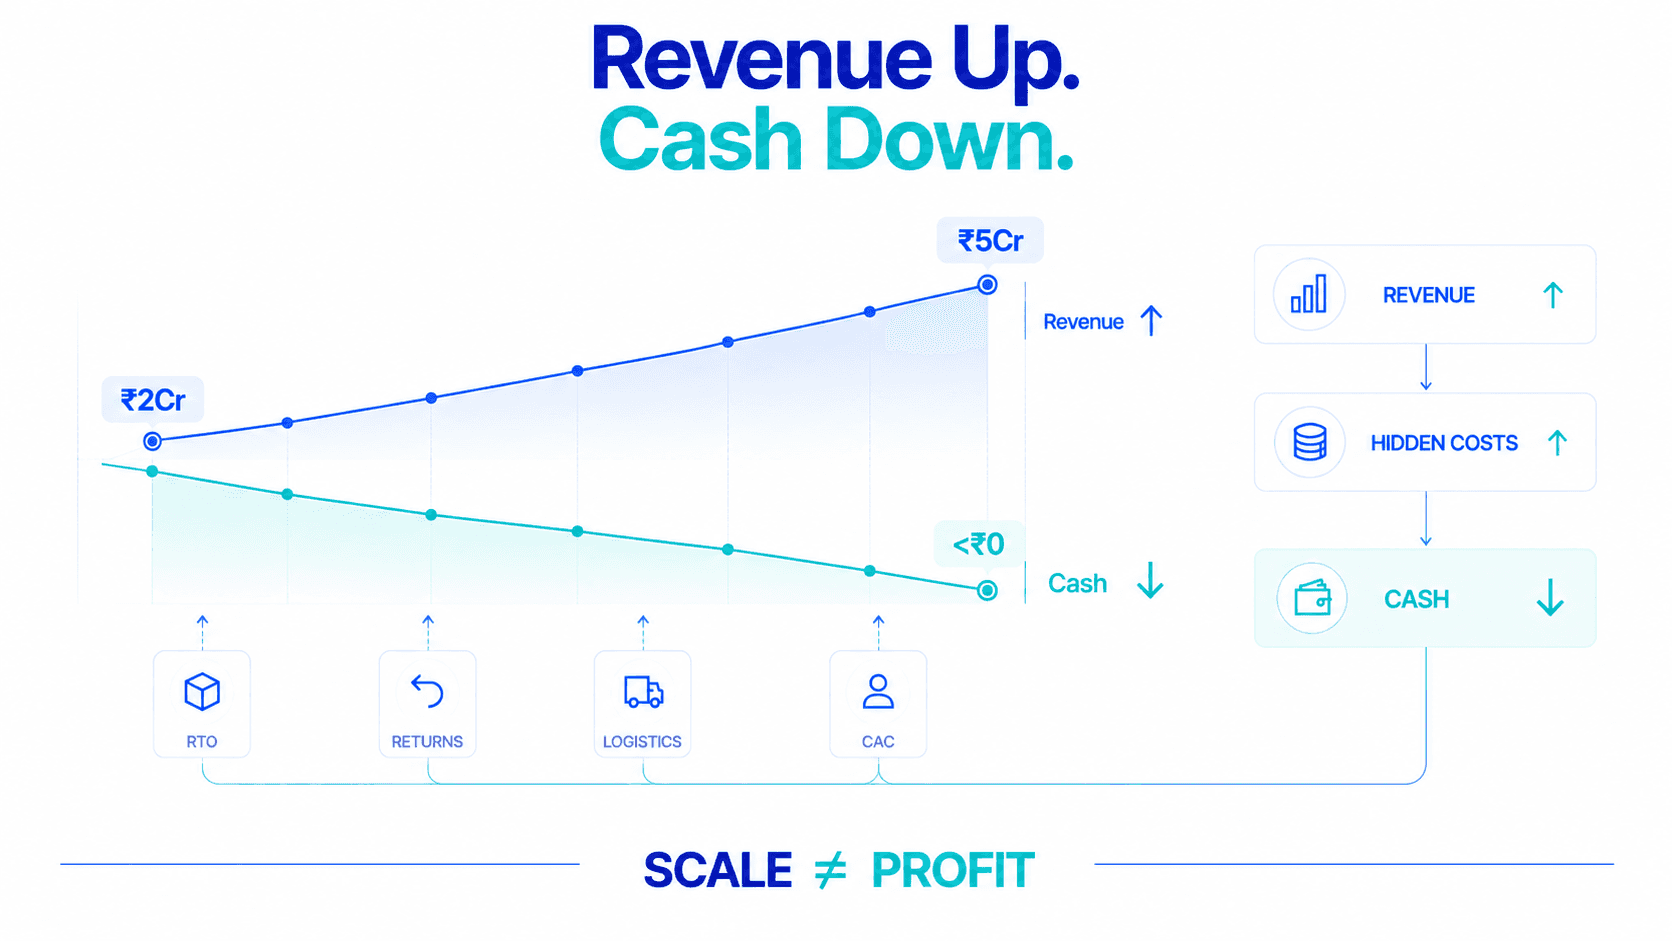
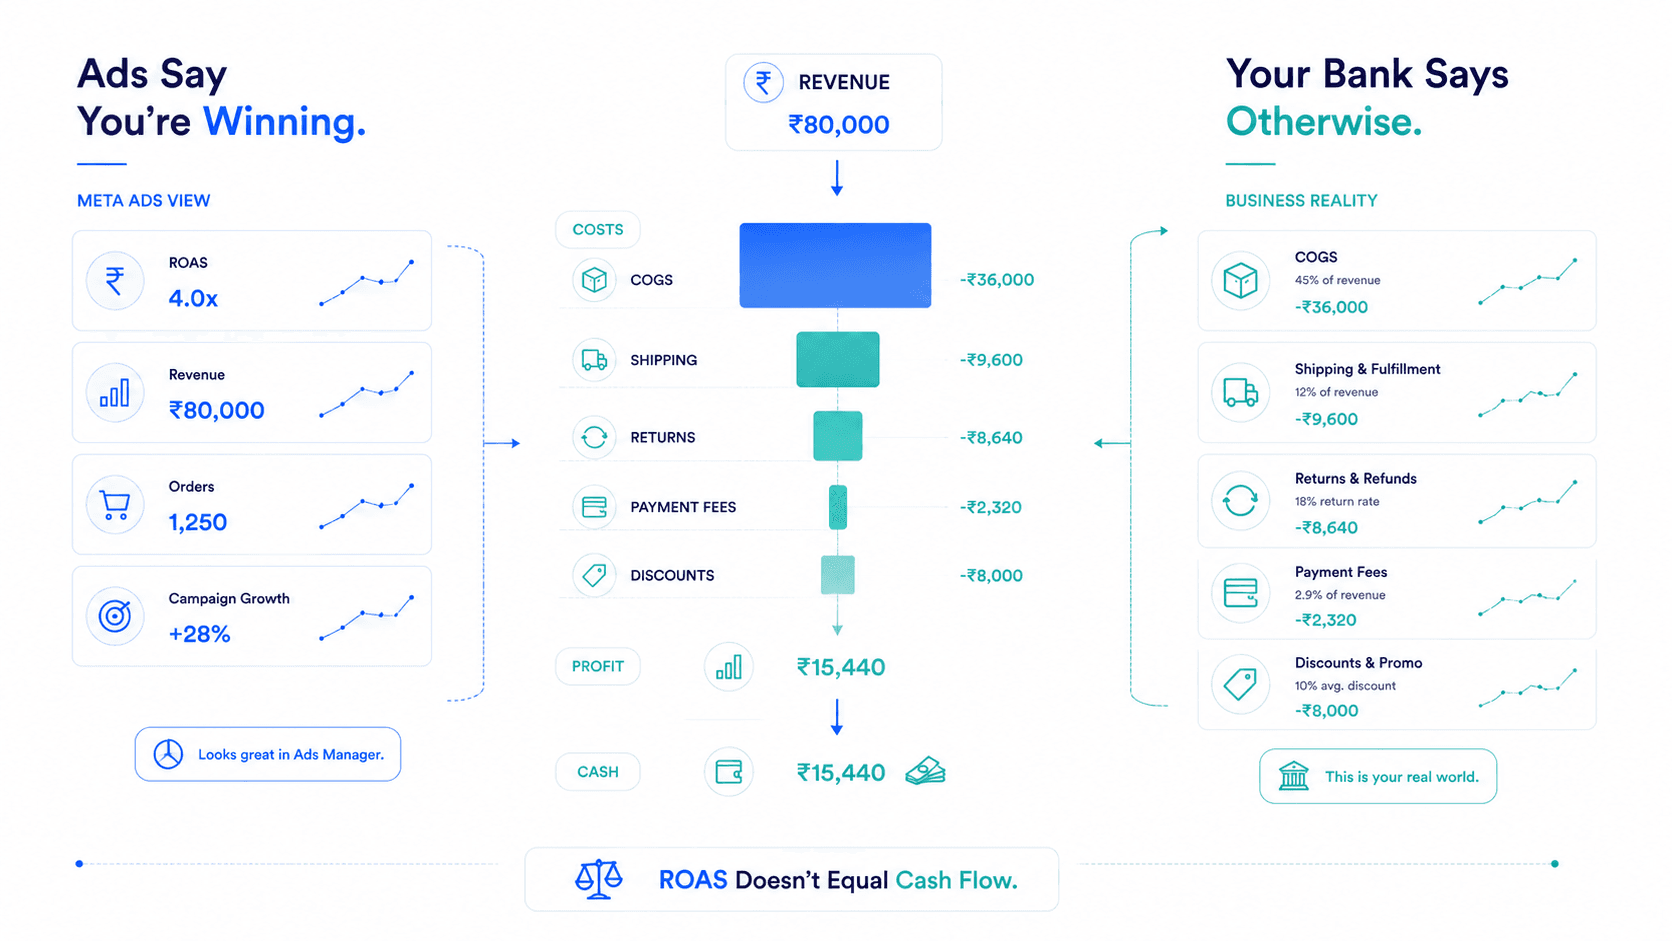
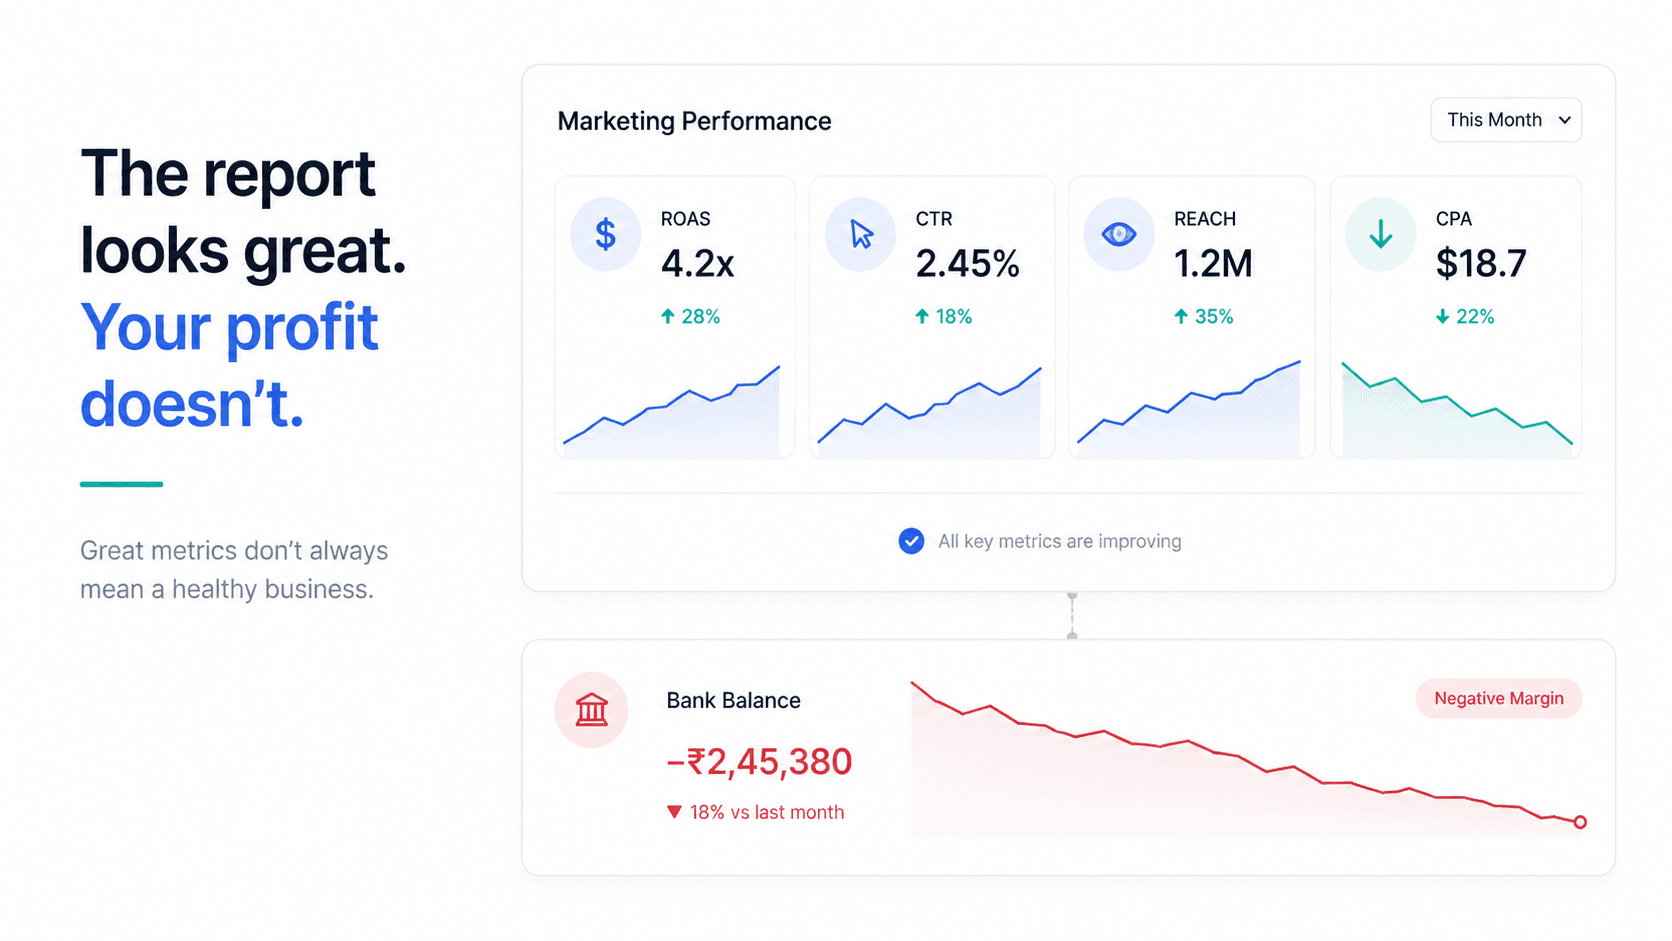
Meta Ads Manager shows 4.0x ROAS, but your bank account is draining. Learn the 6 main causes of the disconnect between reported ROAS and bank balance.

ROAS measures ad platform efficiency, MER measures top-line store efficiency, and POAS measures actual profit. Learn how to use all three together.
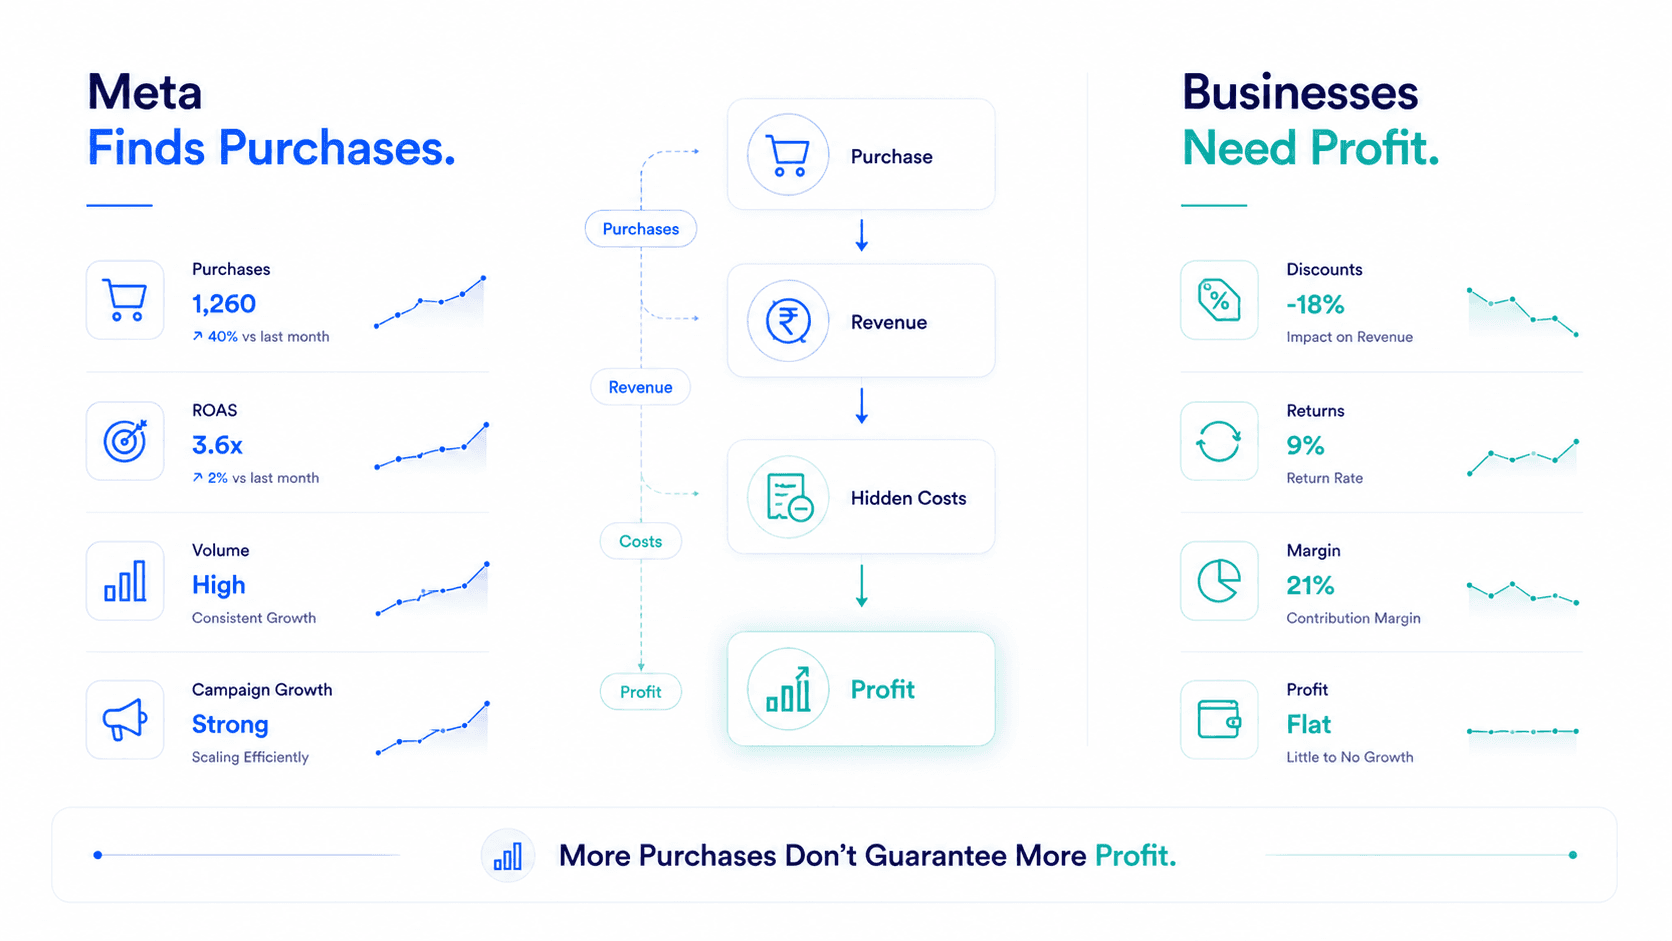
Purchase volume is climbing, but bottom-line profit is stagnant or shrinking. Here is why optimizing for raw conversion count causes margin compression.

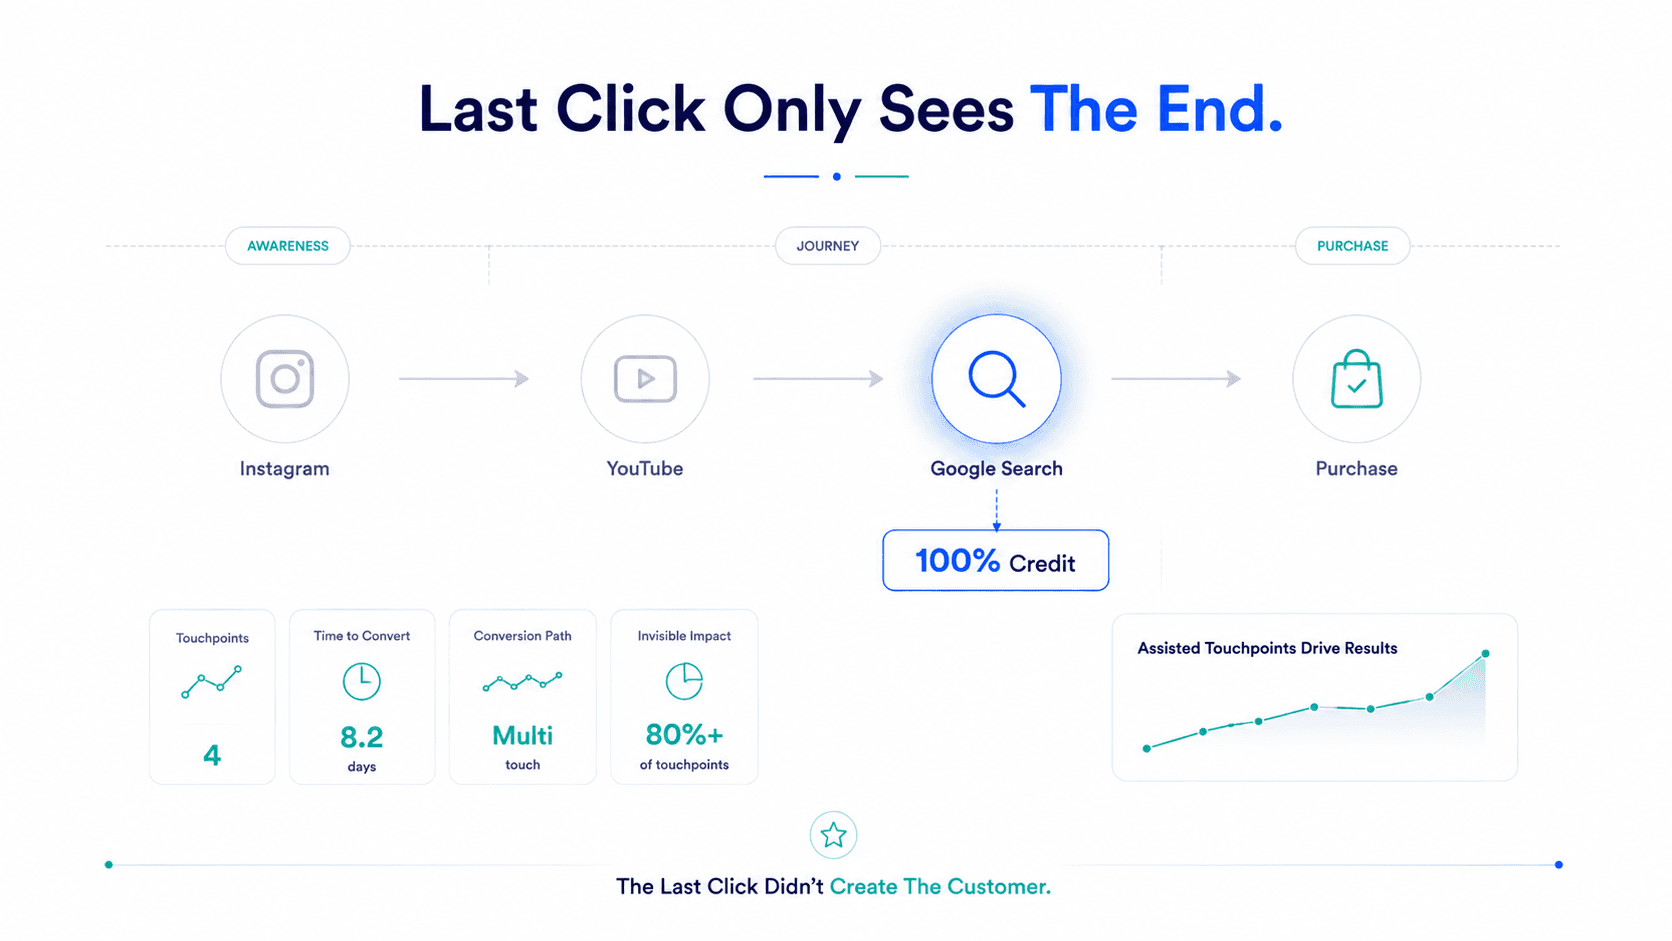
Last-click attribution rewards whoever was last in line while ignoring awareness and assist channels. Learn how D2C brands combine MTA, MMM, and testing.

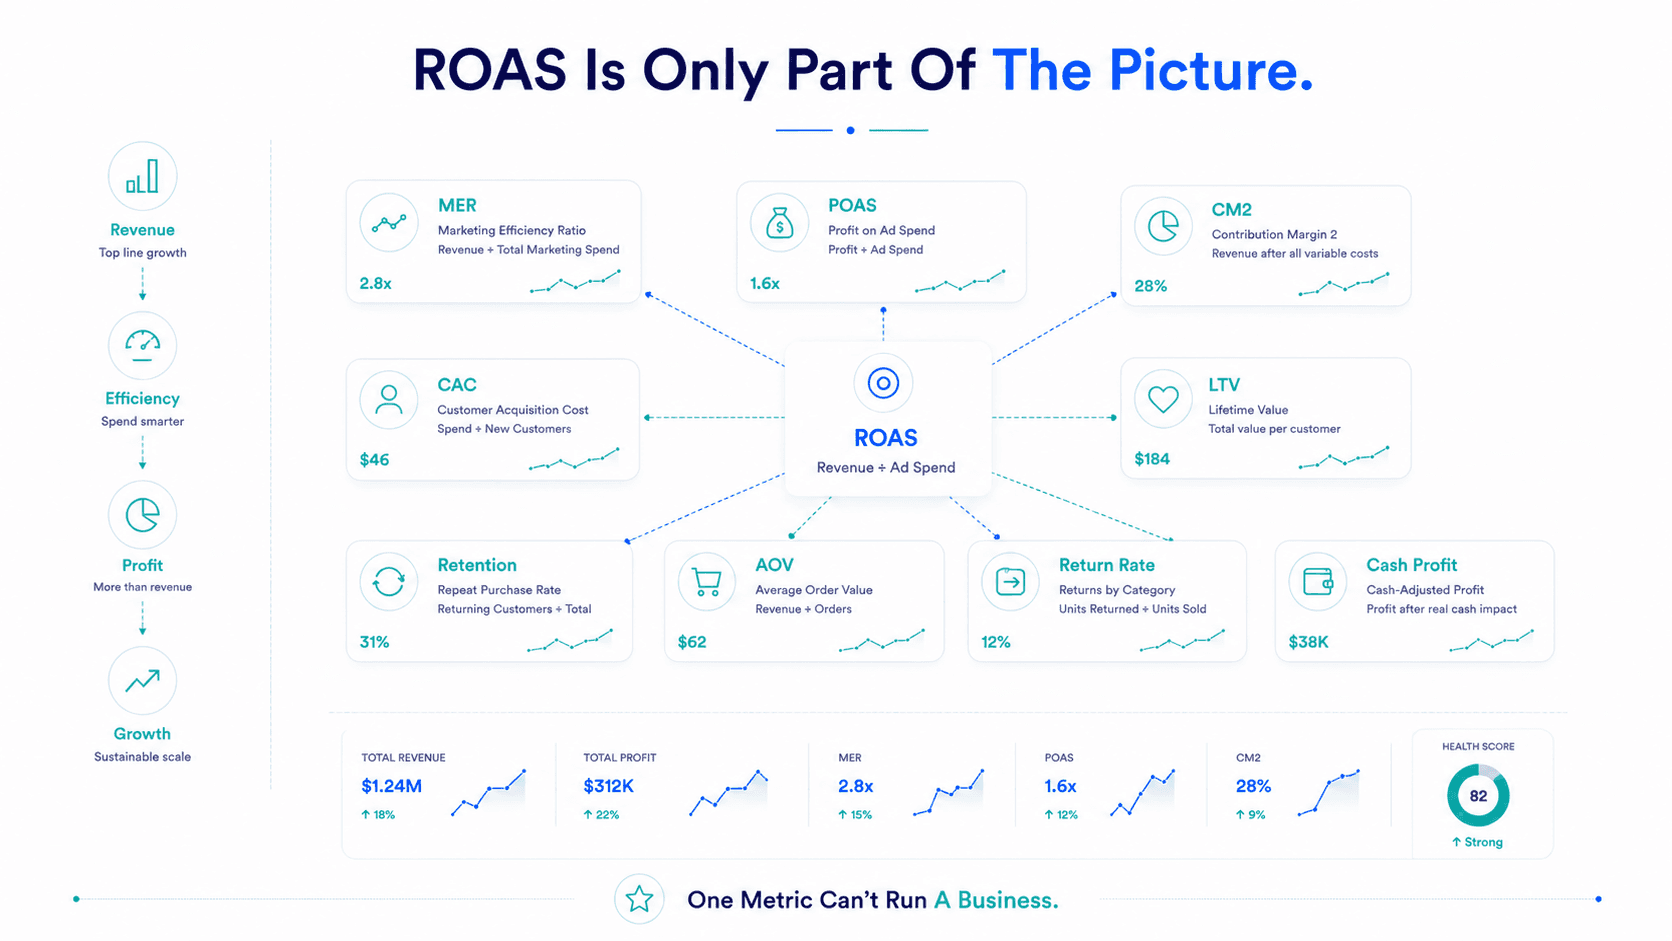
ROAS was designed by ad networks to spend more money. Here are 10 vital metrics every D2C founder needs to build a resilient, profitable brand.

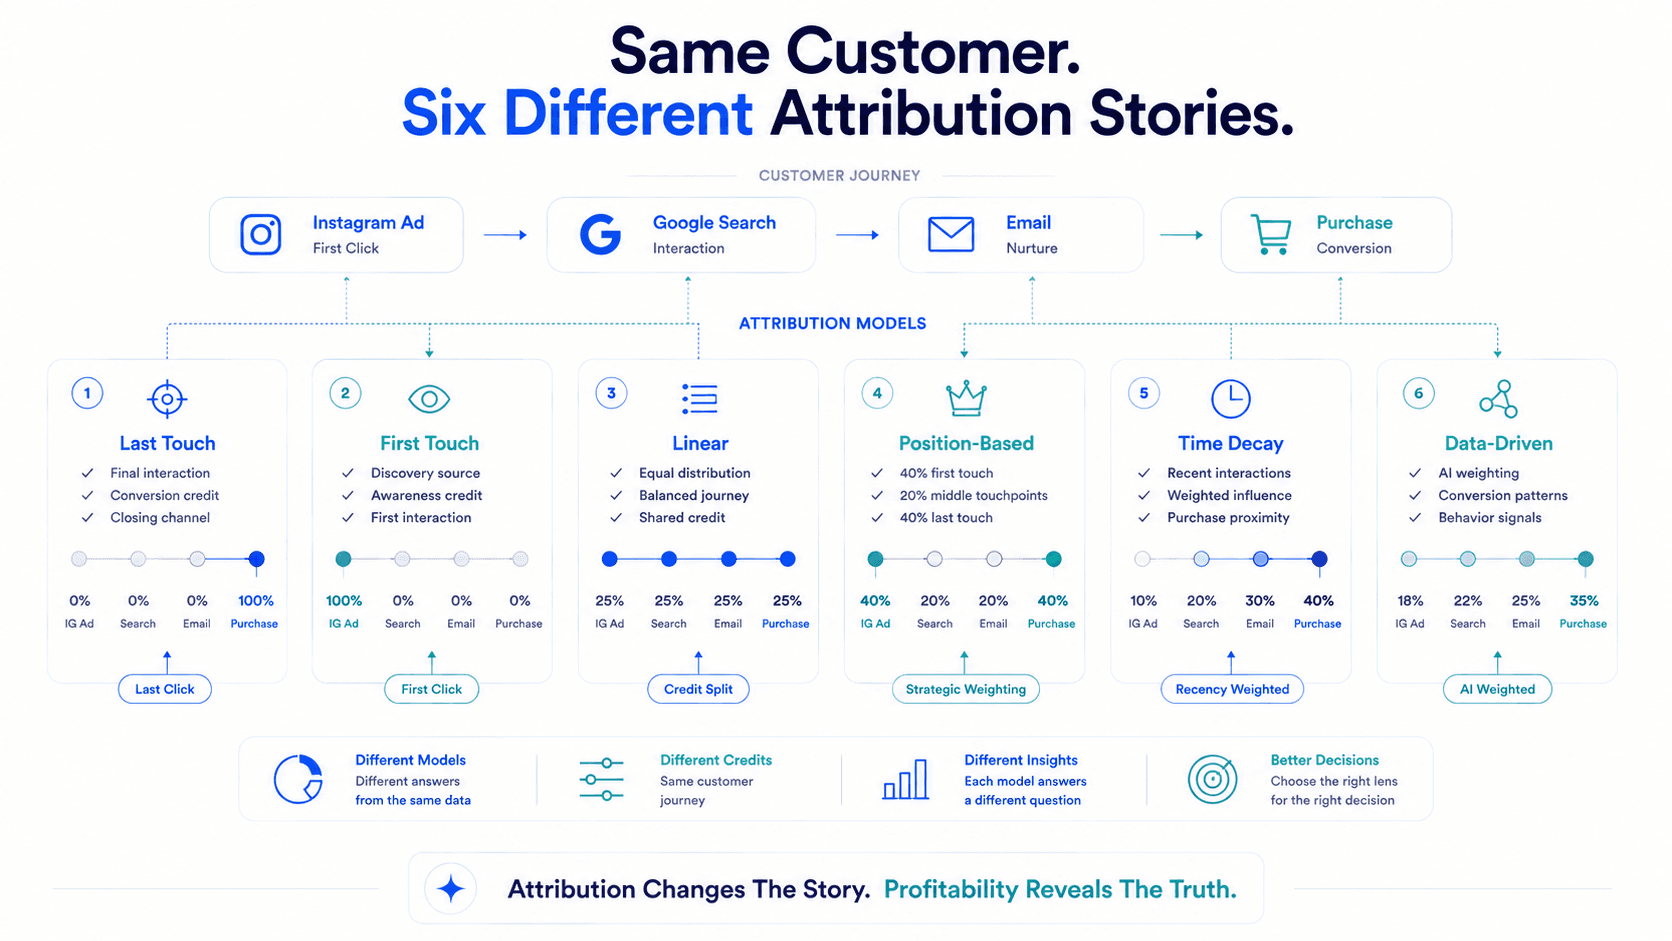
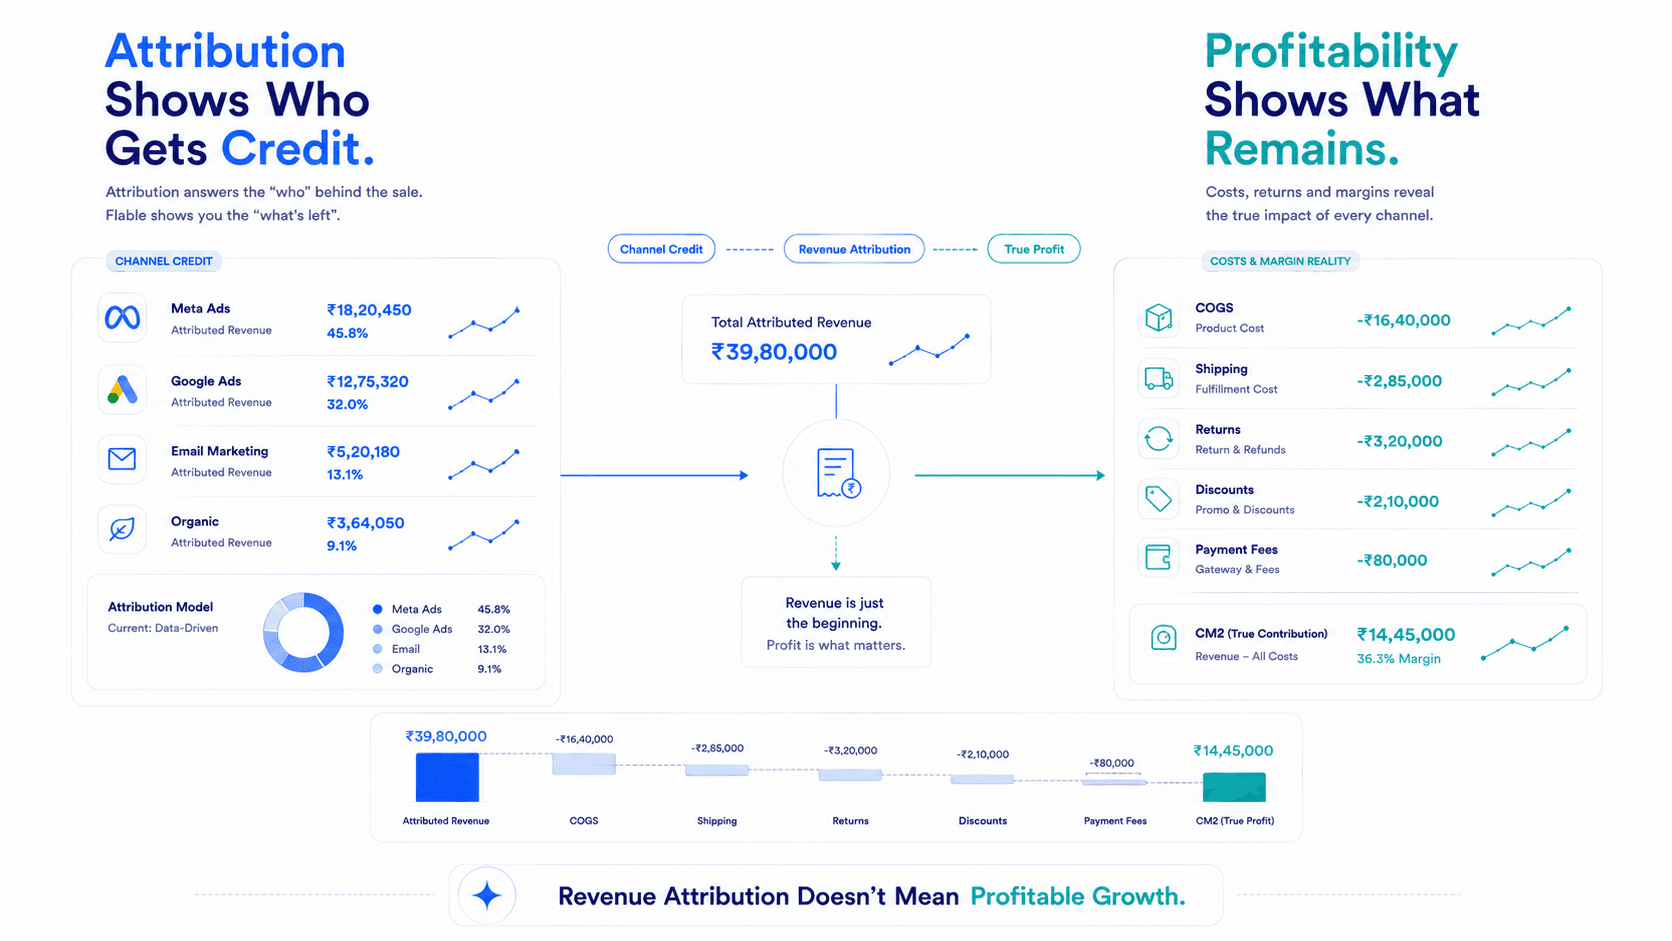
Explore attribution modeling for D2C brands. Understand the 6 attribution models and why contribution margin is the ultimate truth for profitability.

Learn the pros and cons of First Touch, Last Touch, Linear, Time Decay, Position-Based, and Data-Driven attribution models.

Claude Fable 5 is Anthropic's most powerful model. But if you run a D2C brand trying to figure out why ad spend isn't converting to profit, Flable AI is what you need.

Revenue is vanity. Contribution margin is sanity. Learn how to calculate CM1 and CM2 with real formulas and benchmarks.

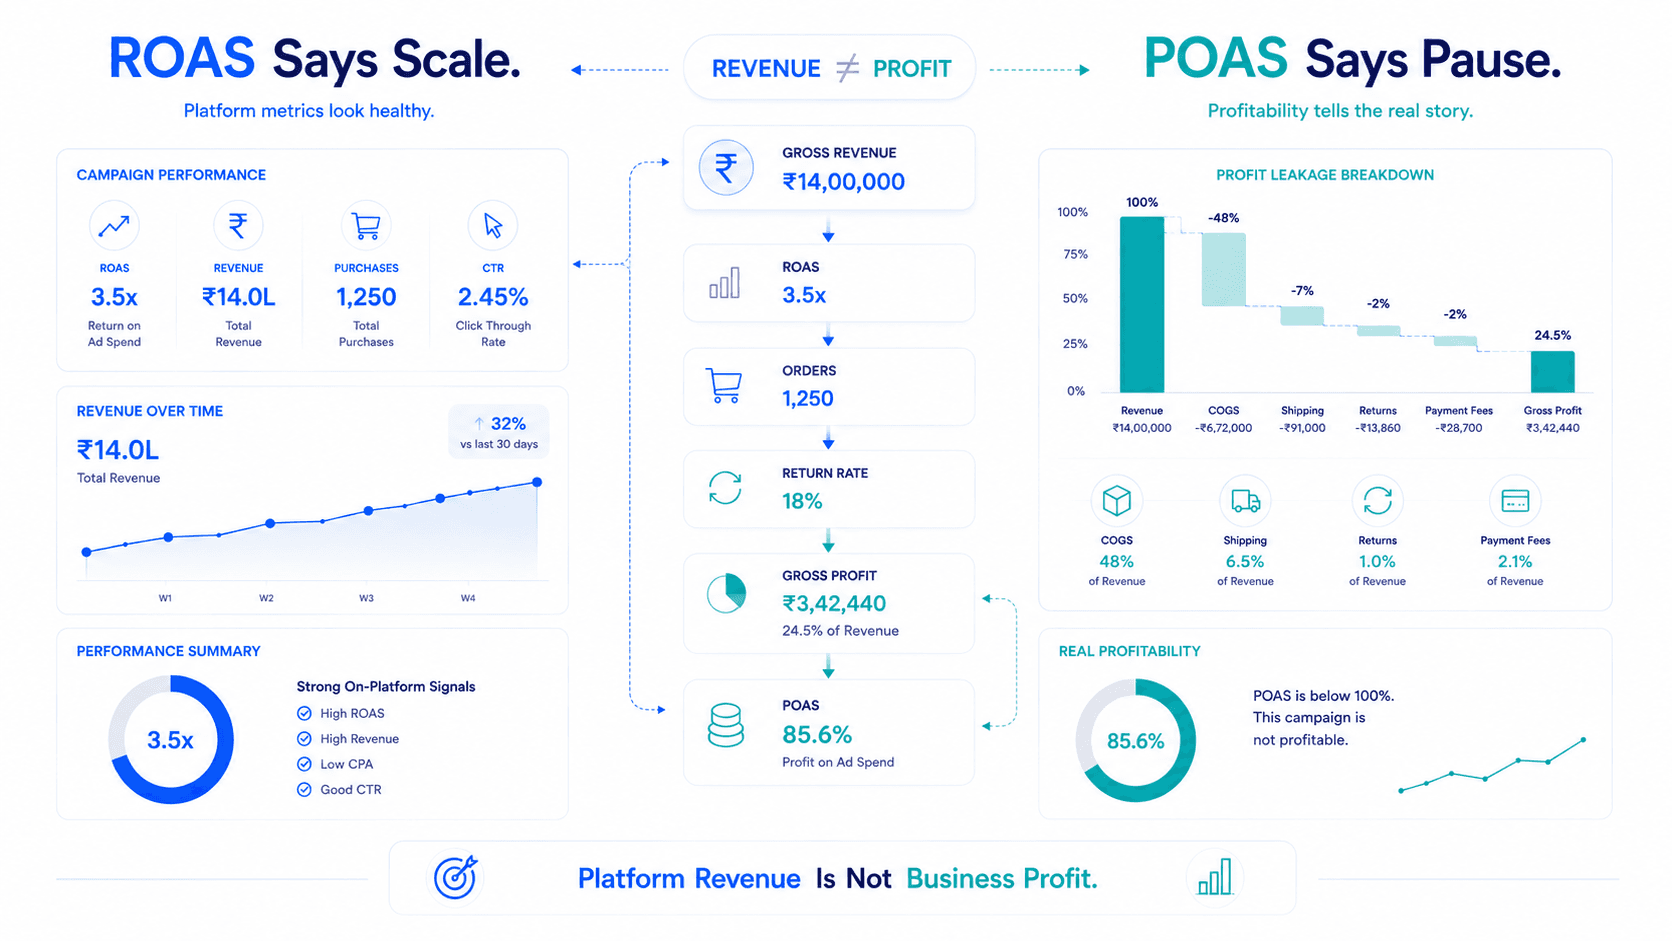
ROAS is a revenue metric pretending to be a profitability metric. Learn how to make the switch to POAS optimisation.

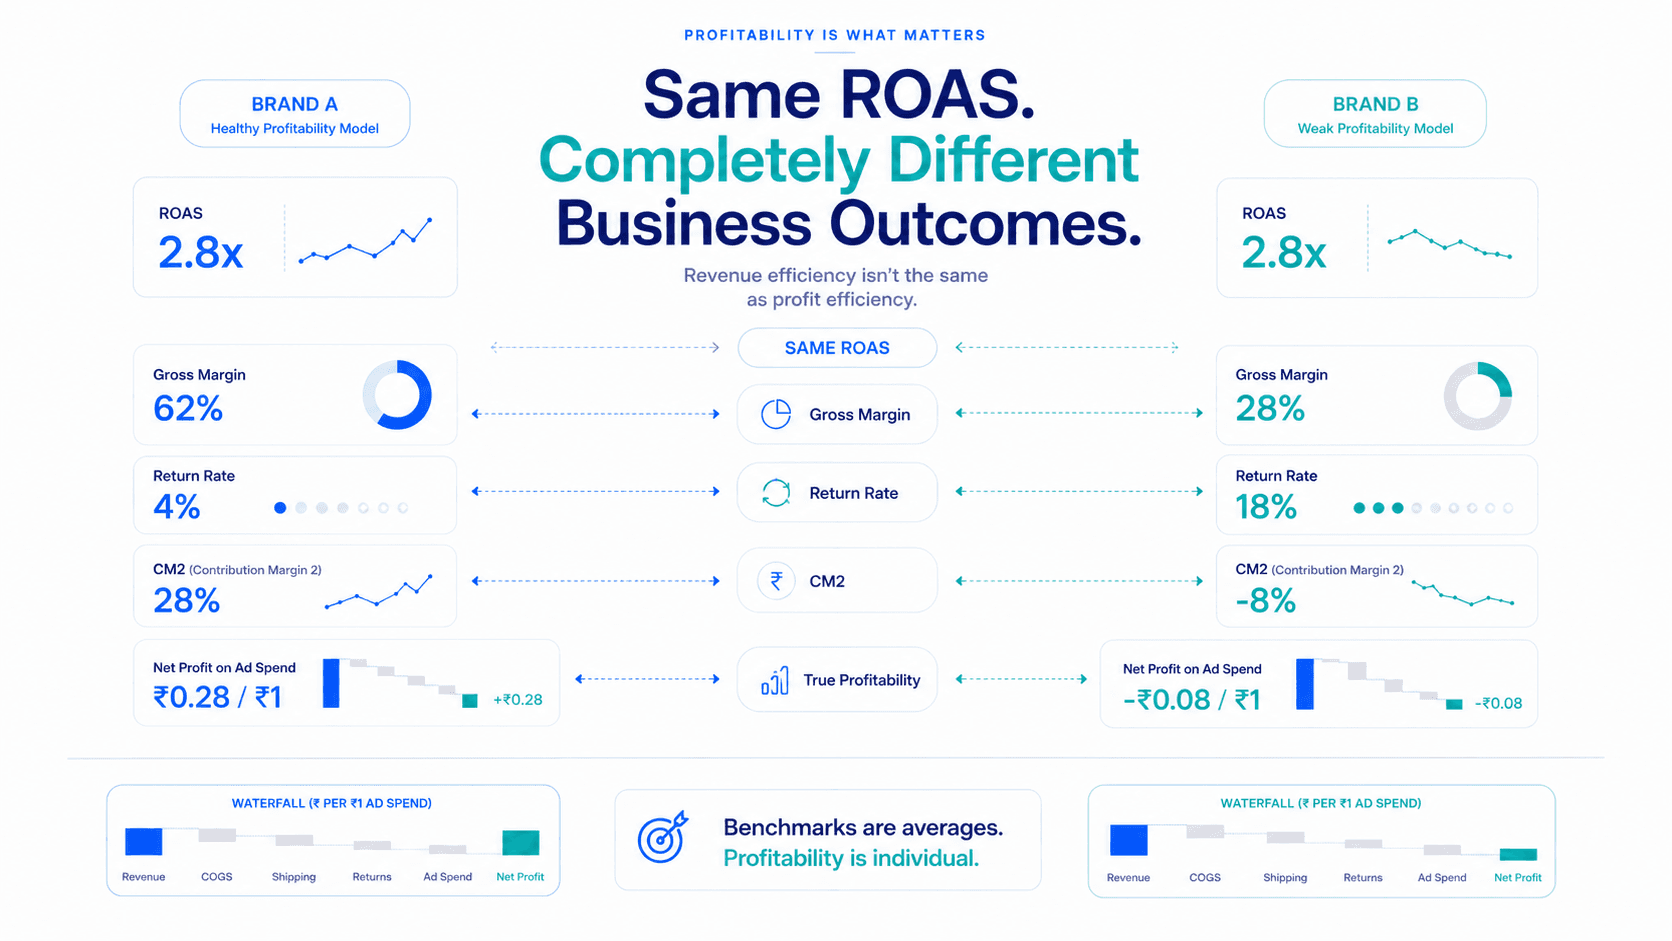
Return rates are the silent margin killer in D2C advertising. Learn how returns distort ROAS and destroy your CM2.

Your Meta ROAS is 3.1x. Your Google ROAS is 4.4x. But total attributed revenue exceeds Shopify revenue. How to fix attribution overlap.

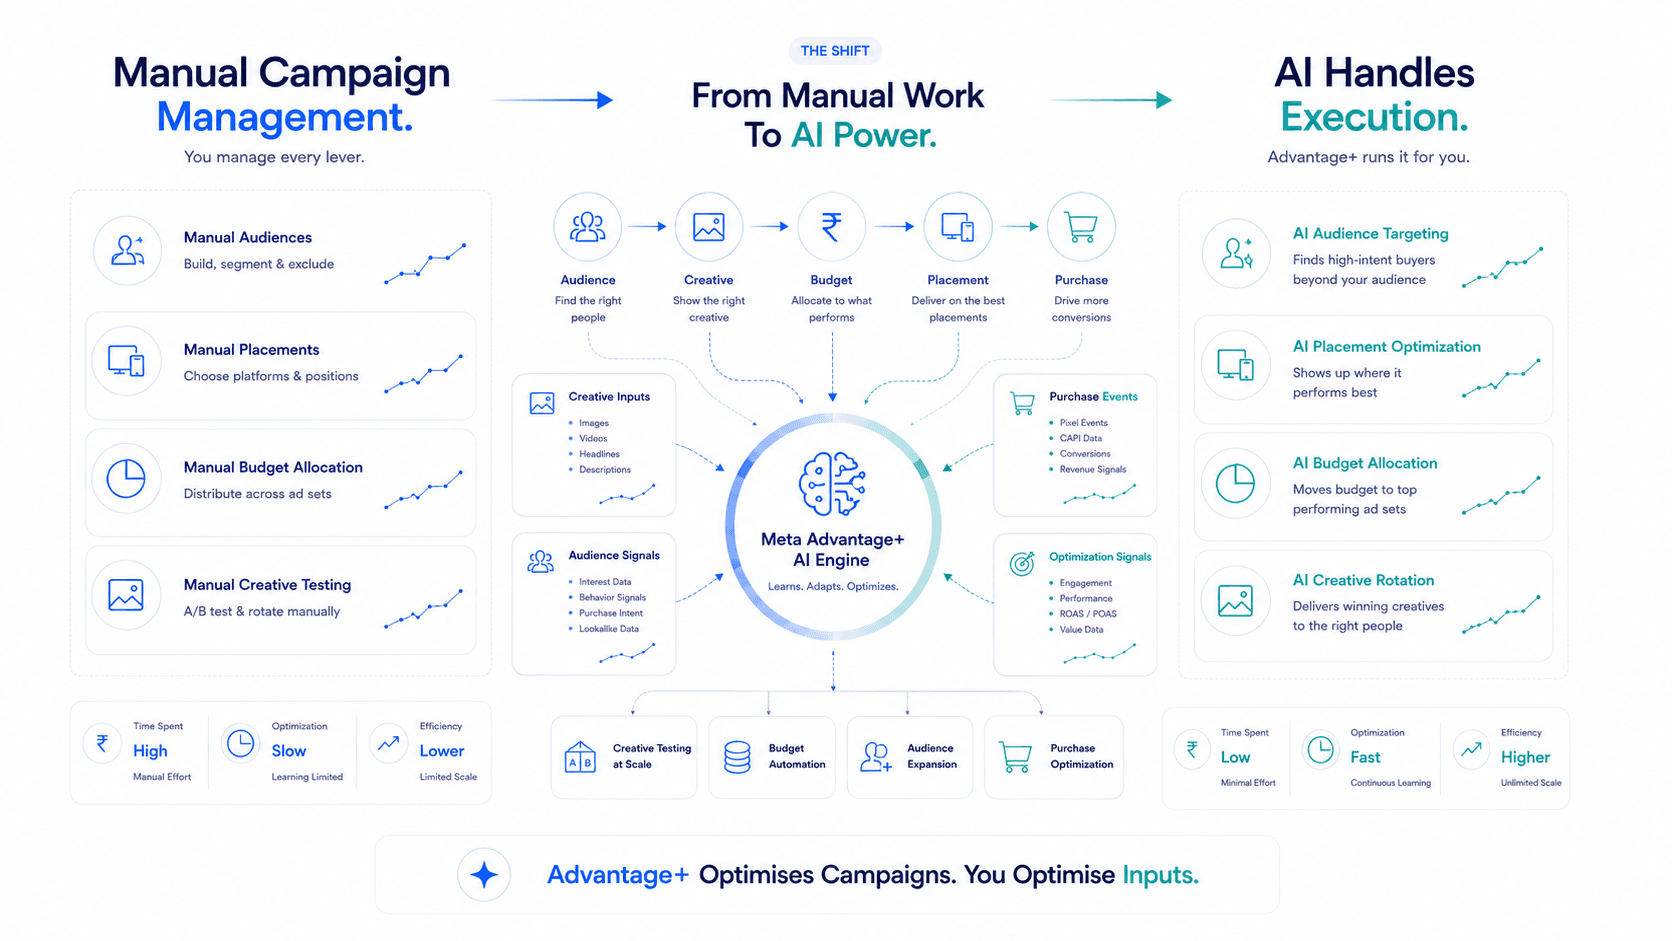
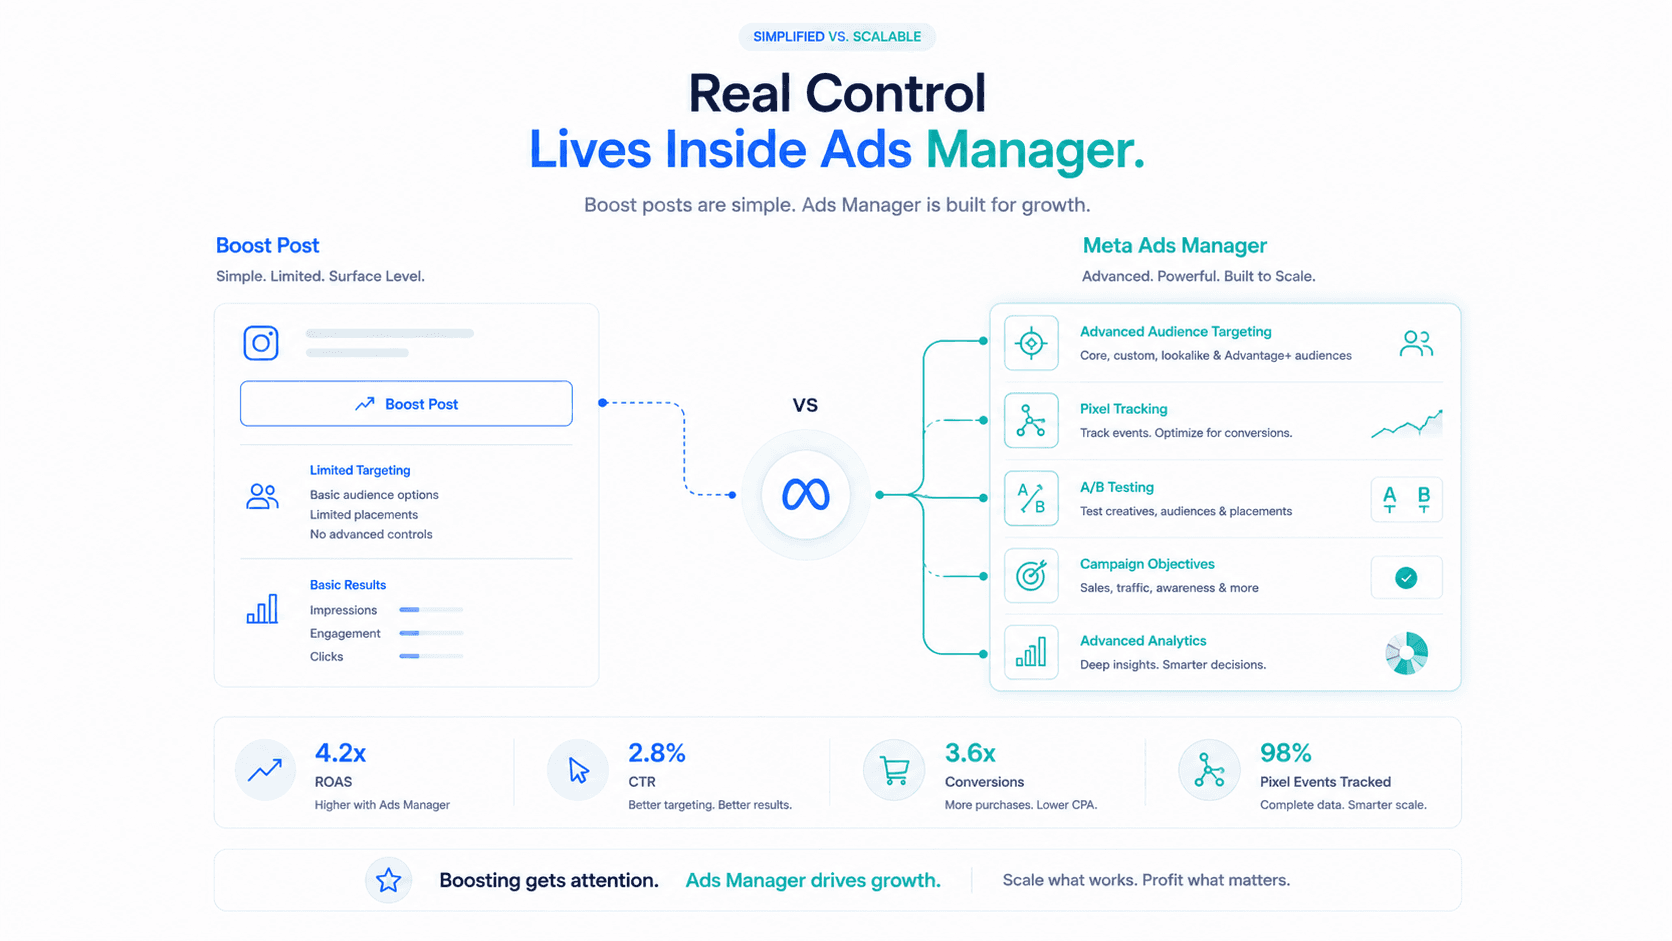
The complete 2026 guide to setting up, optimising, and scaling Meta Advantage+ Shopping Campaigns with POAS-driven strategies.
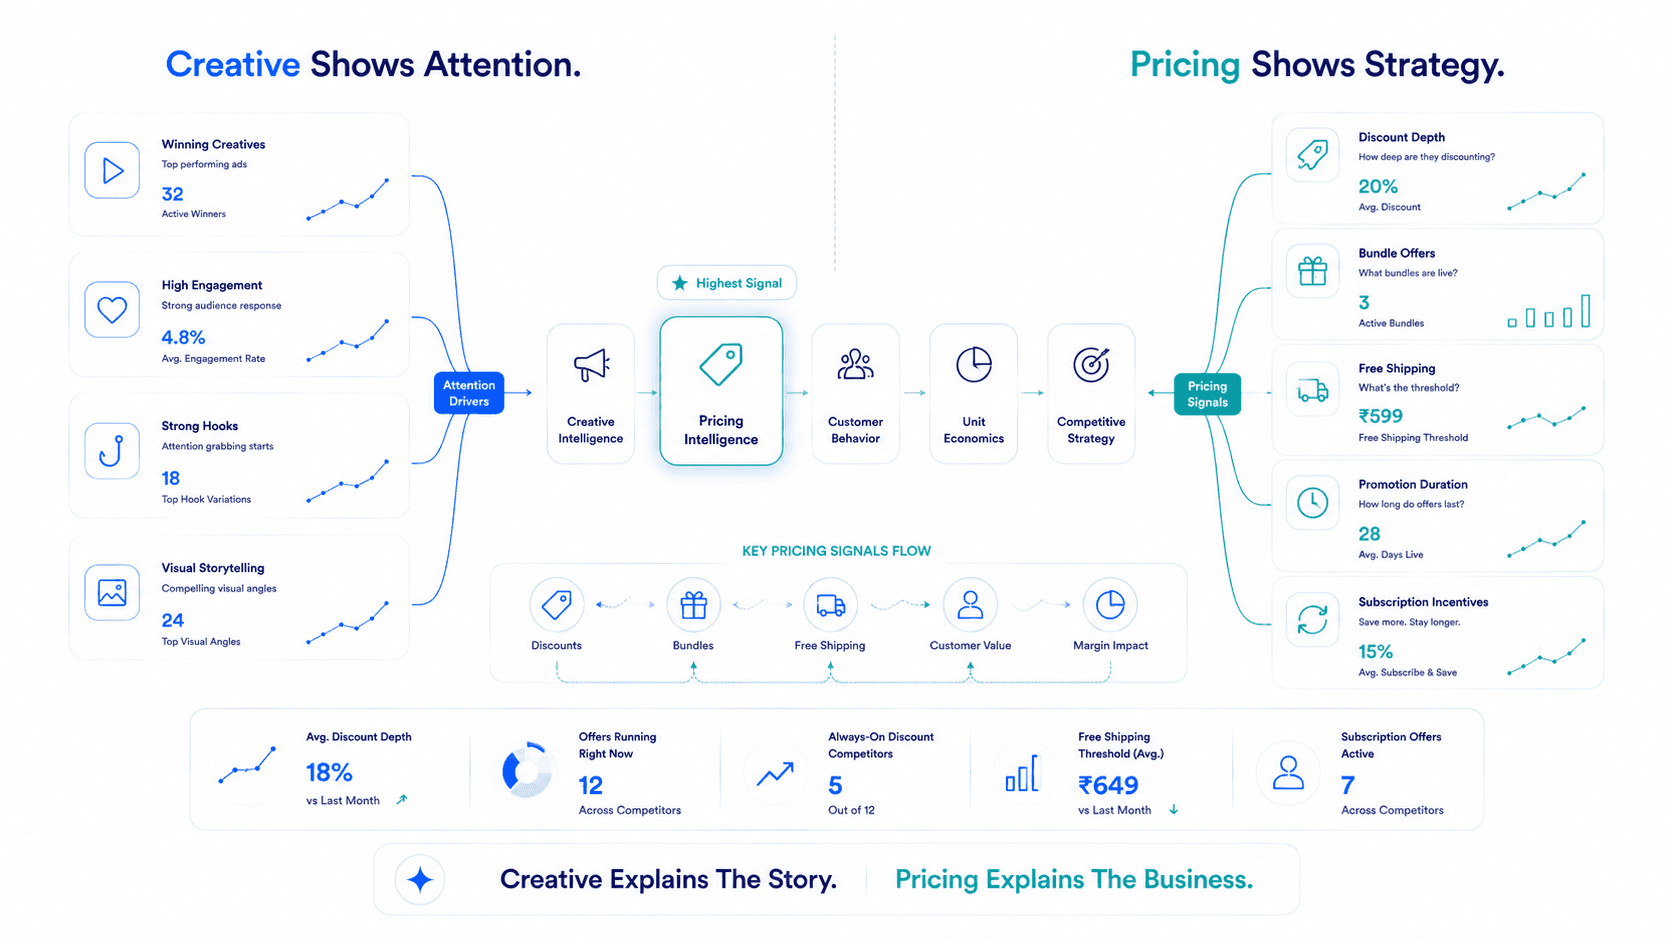
Most brands track creative but ignore pricing. A competitor's discount structure reveals more about their unit economics than any ad.

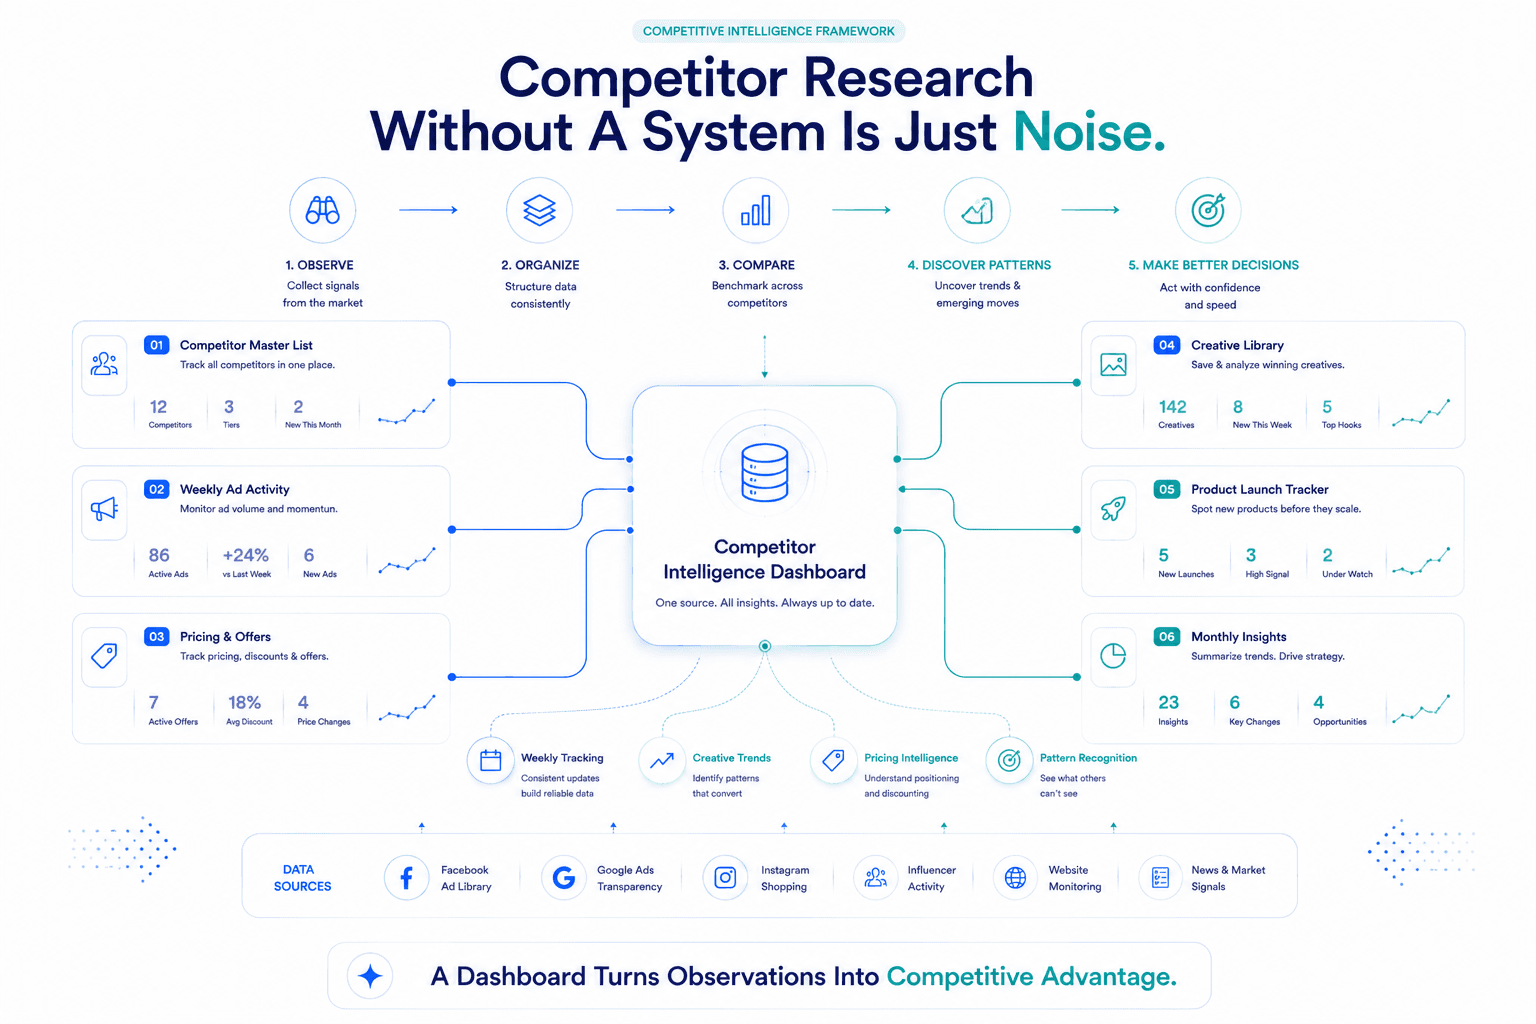
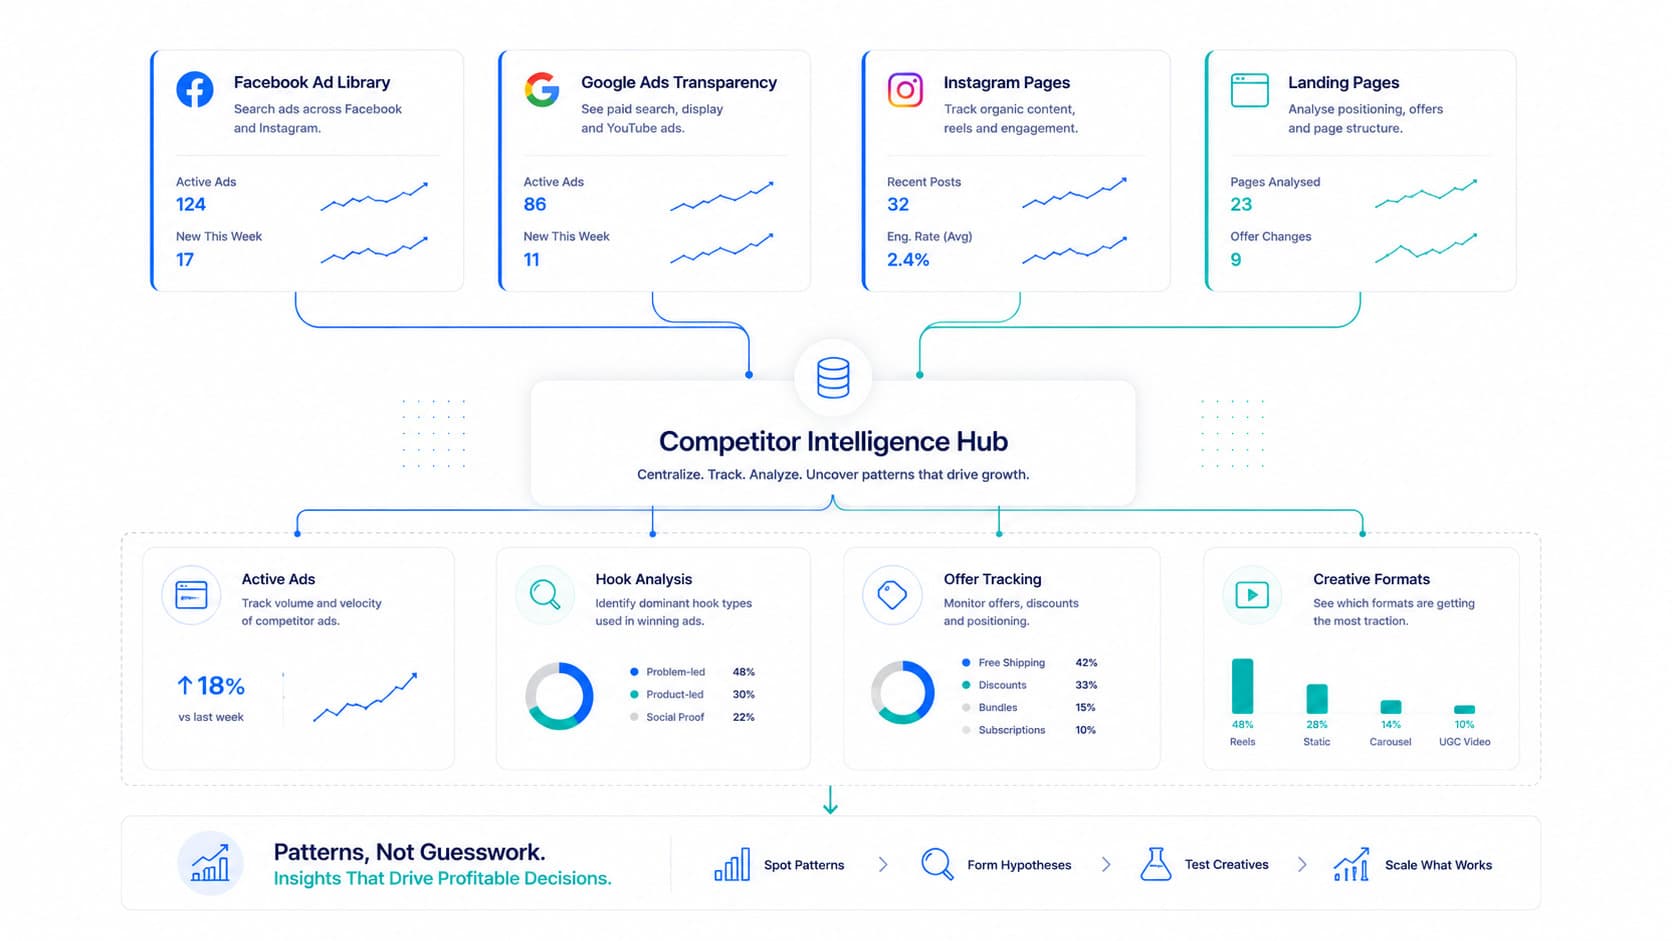
Competitor research without a system is just one-off observations. Learn how to build a structured intelligence dashboard.

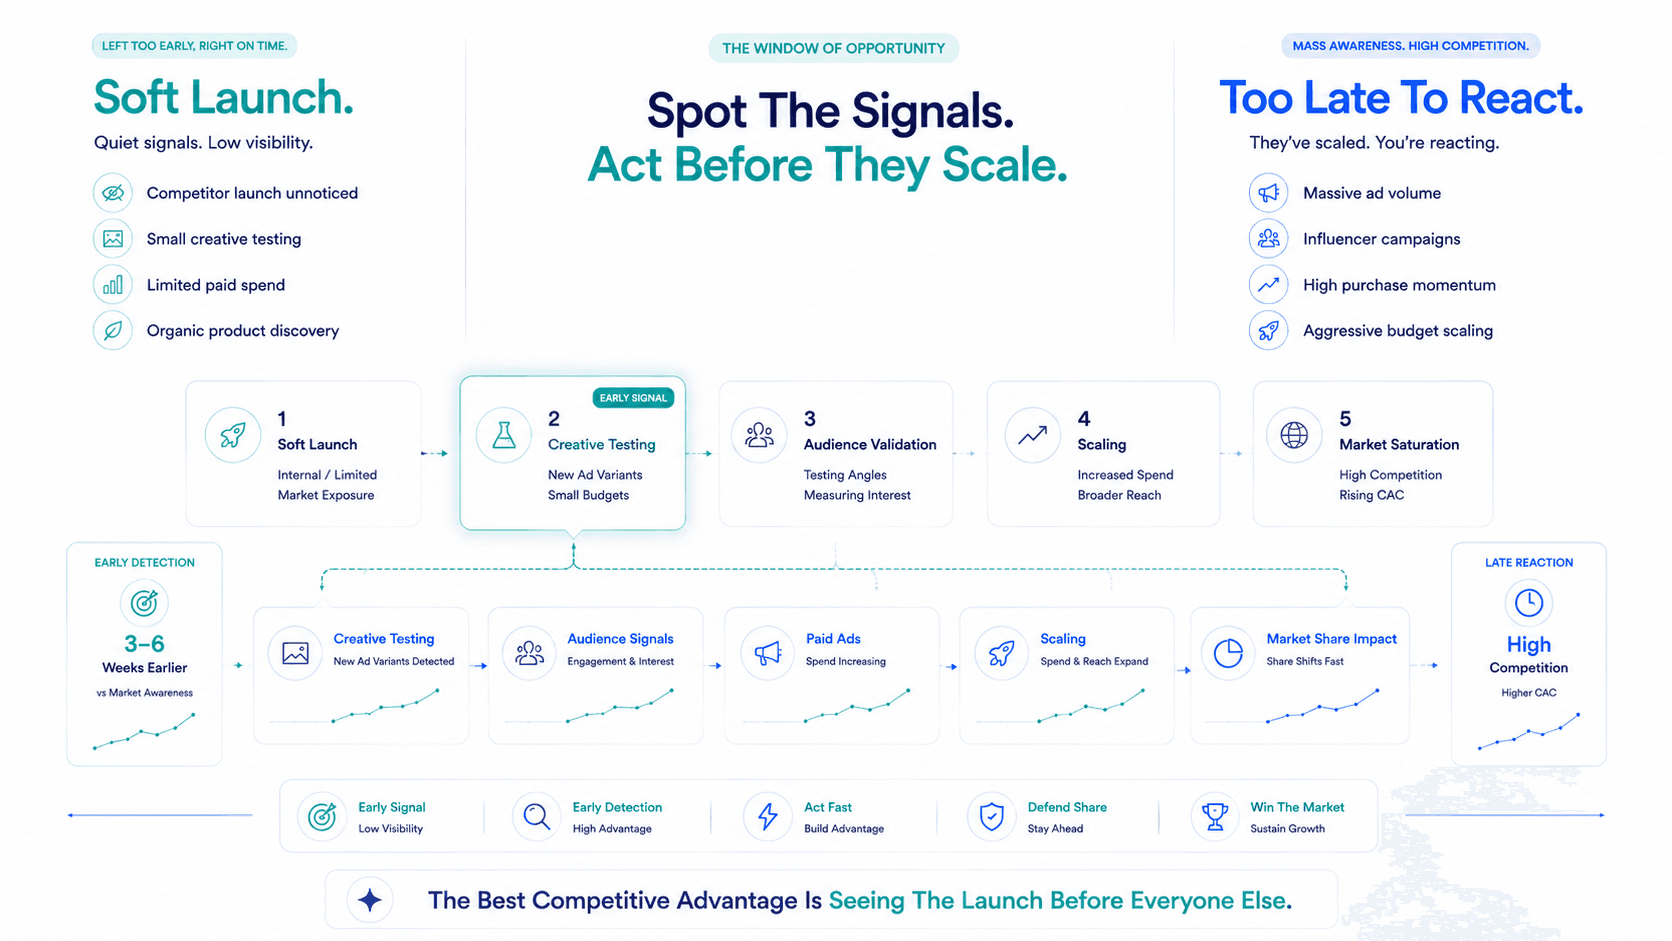
By the time a new product is all over your feed, it's too late. The early-detection framework for spotting competitor launches.

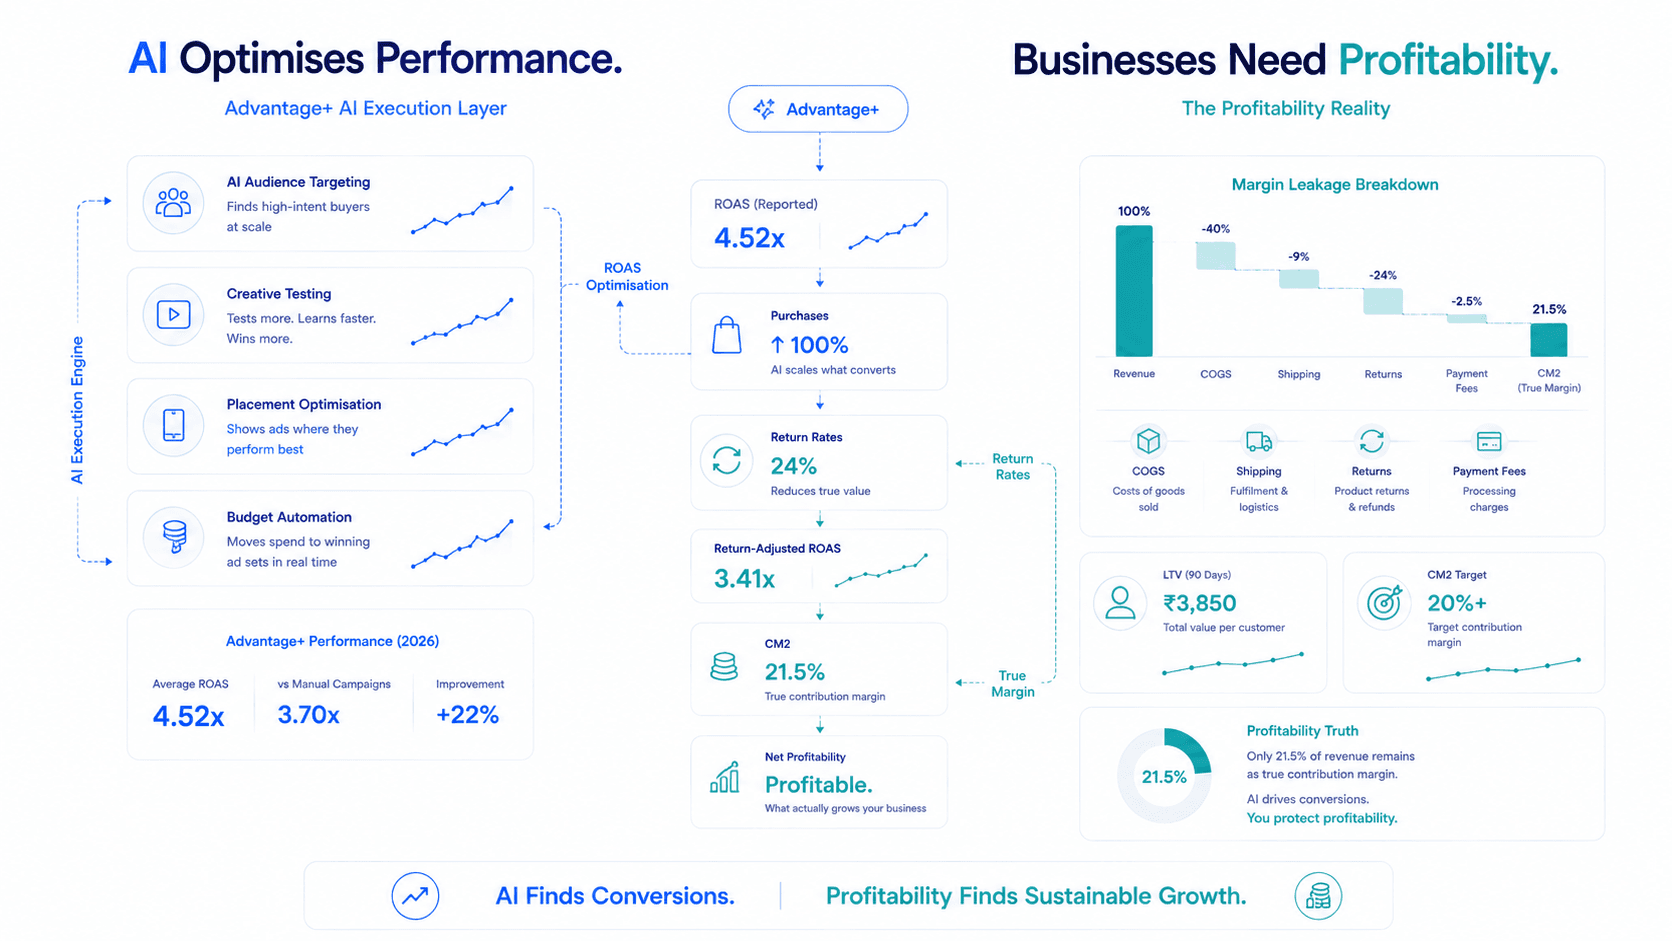
Meta's Advantage+ campaigns deliver 22% higher ROAS—but they optimise for conversions, not profit. Learn how to use AI campaigns alongside profitability measurement.

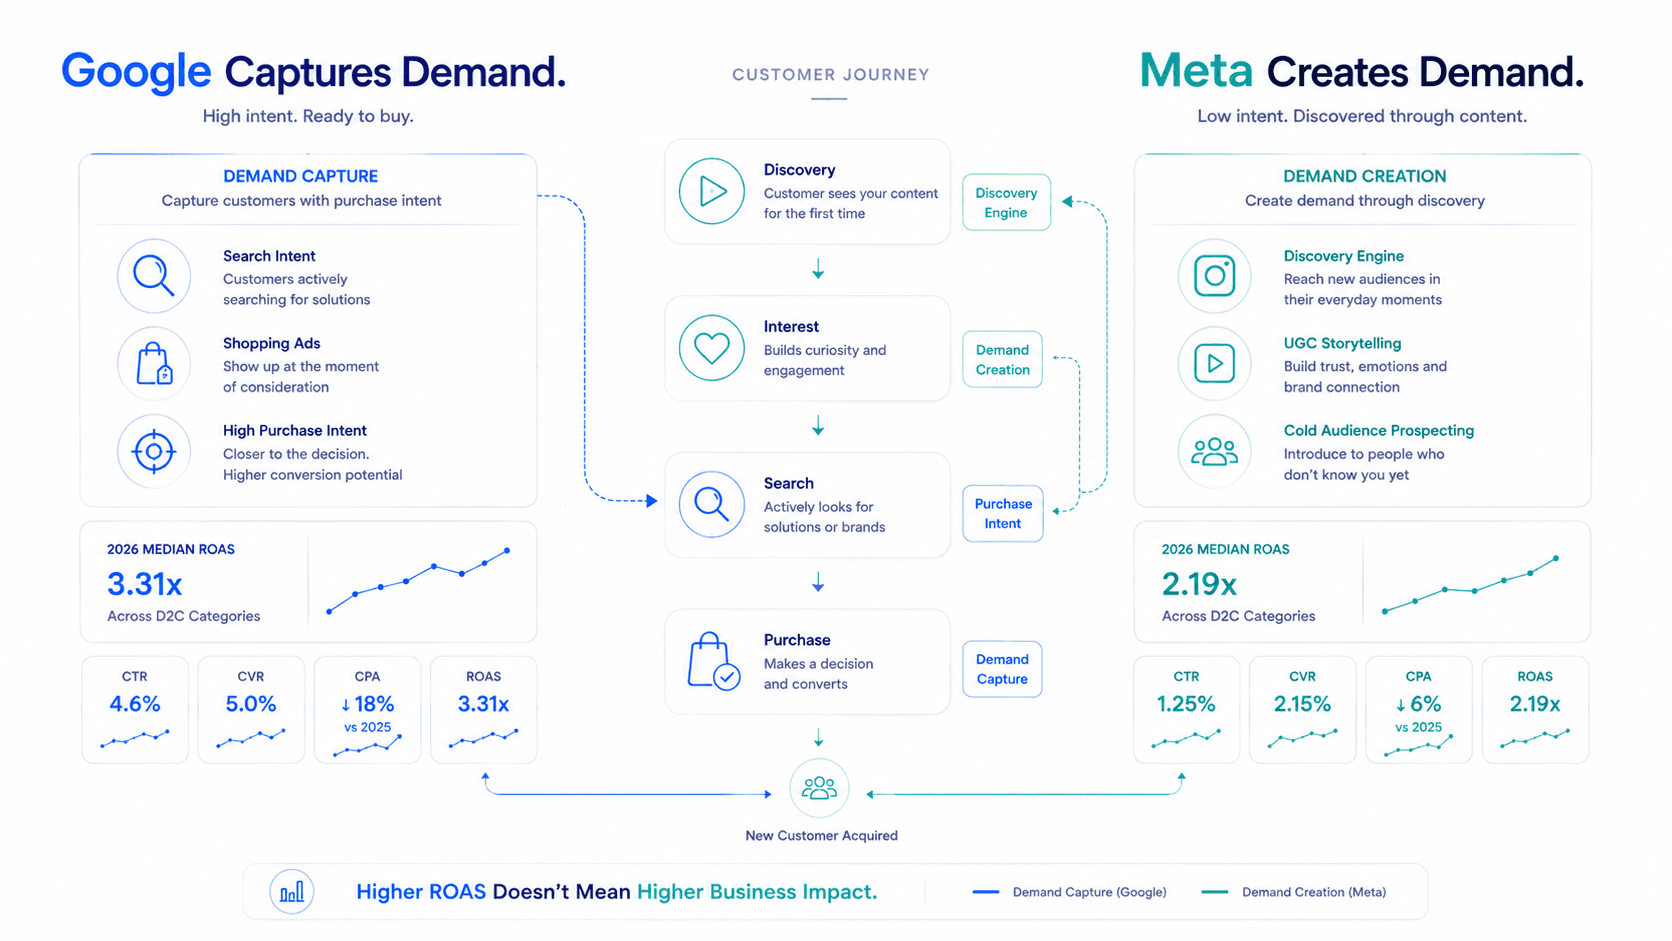
Google's 3.31x median ROAS vs Meta's 2.19x—what does it actually mean? Learn the right framework for channel allocation based on CM2.

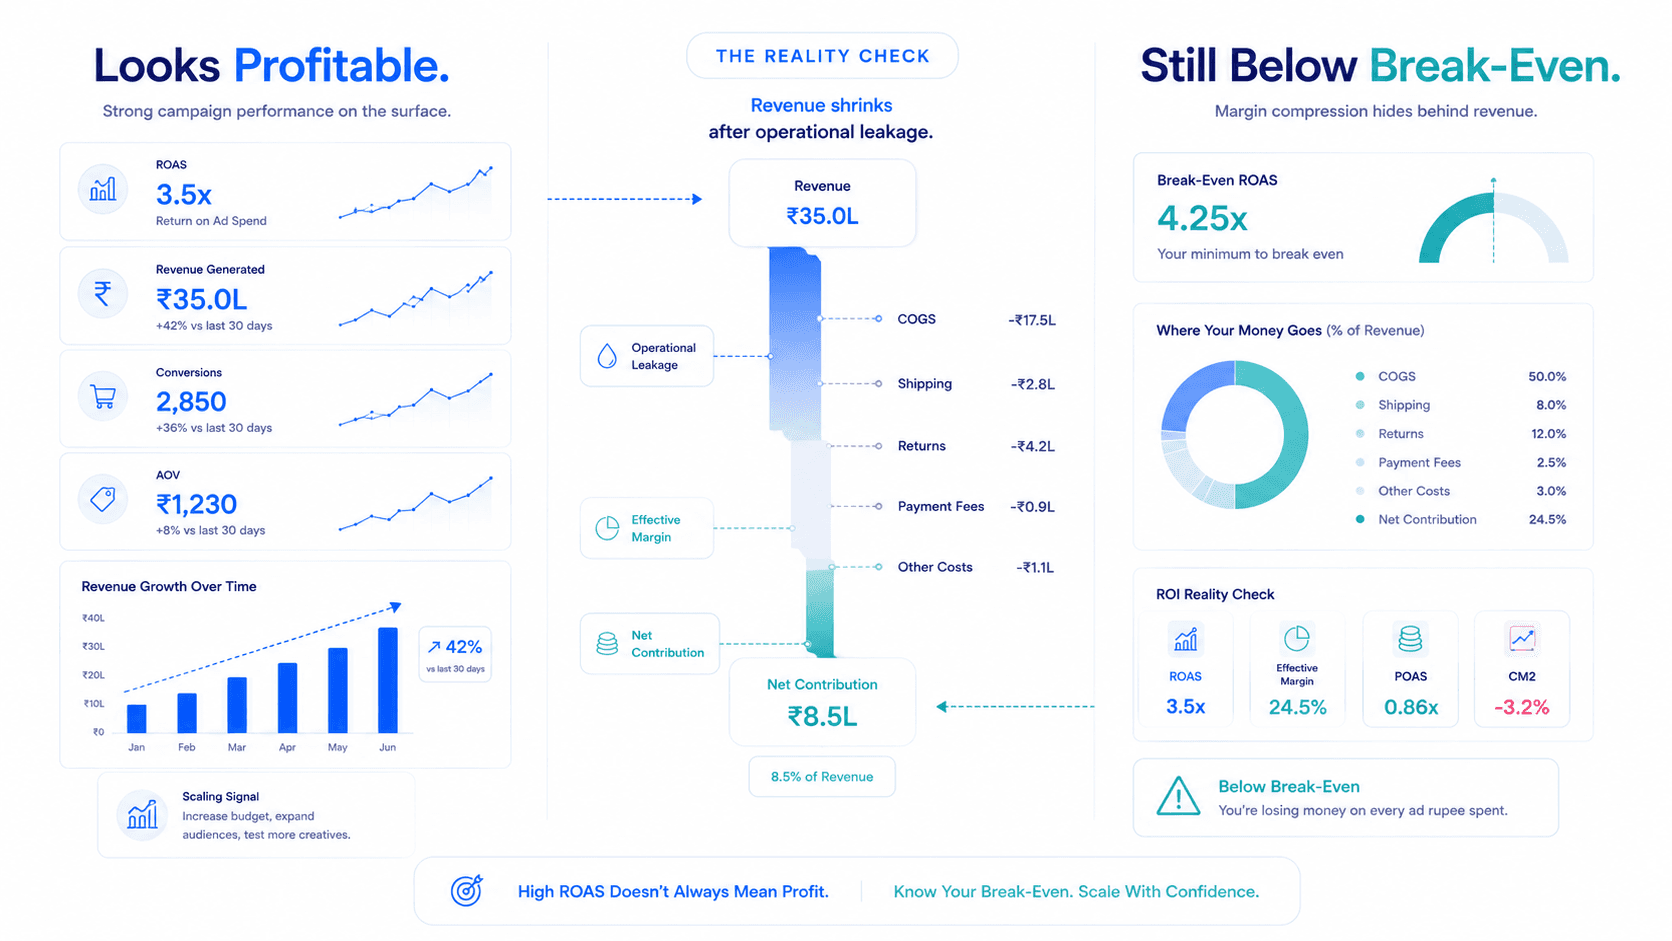
The standard break-even ROAS formula is broken. Learn how to calculate your real break-even ROAS for D2C by including shipping, returns, and payment fees.

ROAS was never measuring profitability to begin with. Learn the difference between ROAS and POAS, and how to calculate the metric that actually guides scaling decisions.

Stop benchmarking against revenue efficiency. Explore the 2026 Meta Ads profitability benchmarks that account for COGS, returns, and shipping across D2C industries.

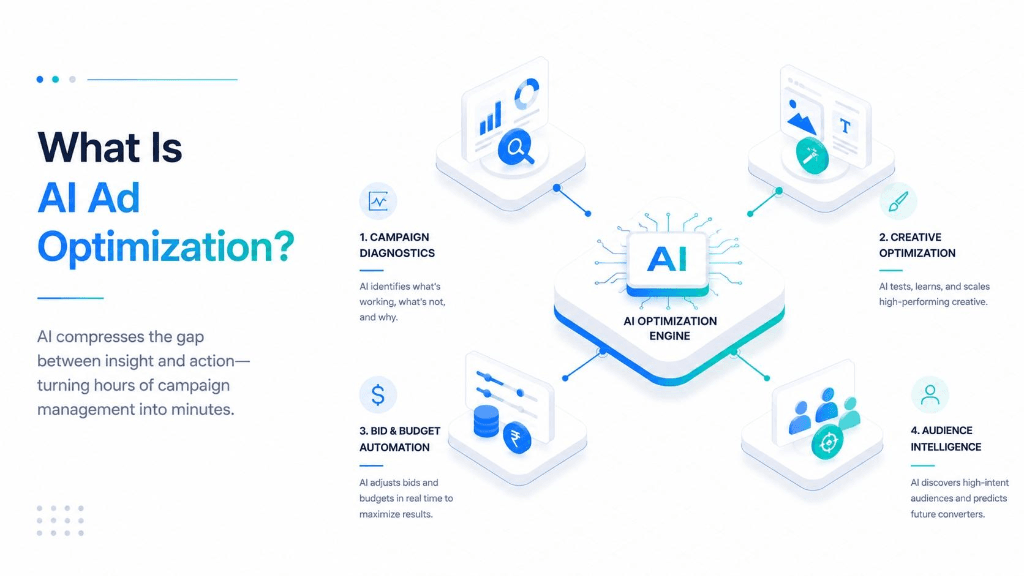
AI is getting better at optimising campaigns. It is not getting better at understanding your business. That's the gap performance marketing AI hasn't filled.

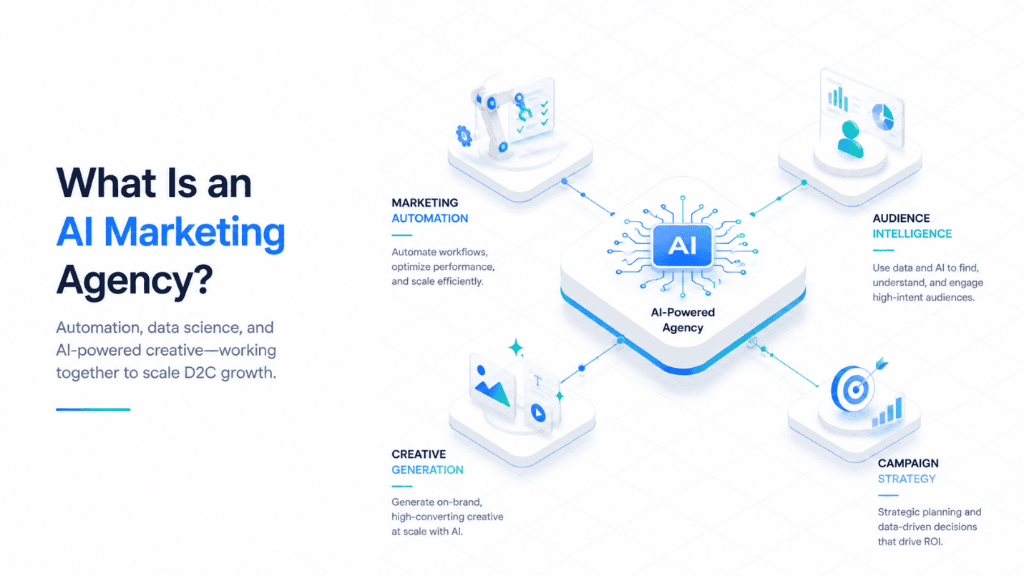
Every pitch promises smarter targeting, better ROI, and campaigns that optimise themselves. But underneath the hype, there is a genuine shift happening.

A breakdown of the top AI ad optimization tools for D2C brands — what they do, where they fall short, and the one capability gap every brand needs to fill.

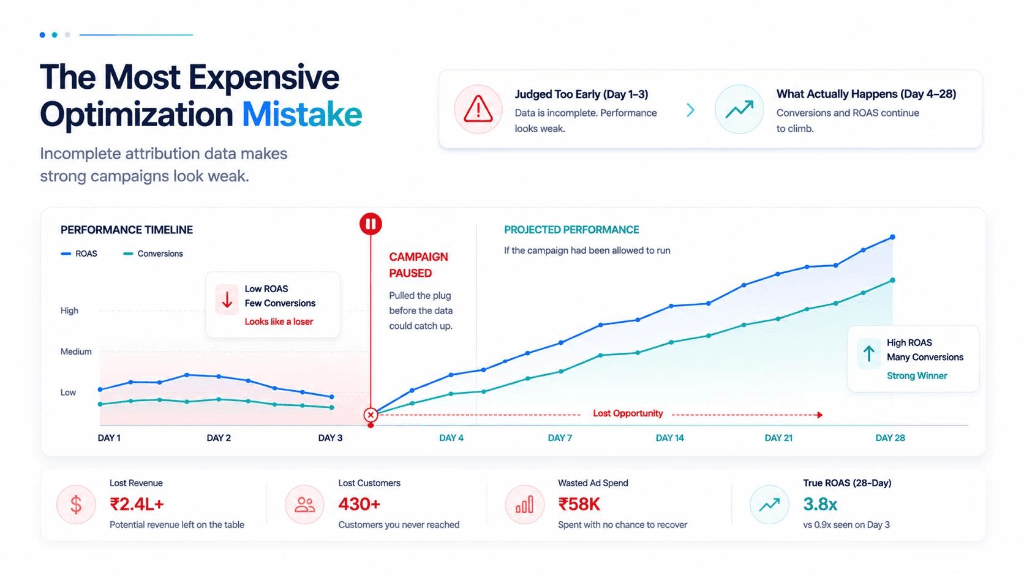
You launch a new Meta campaign. Day 3 CPA looks high. ROAS looks weak. So you kill it. What you didn't know is that 40% of the conversions hadn't been reported yet.

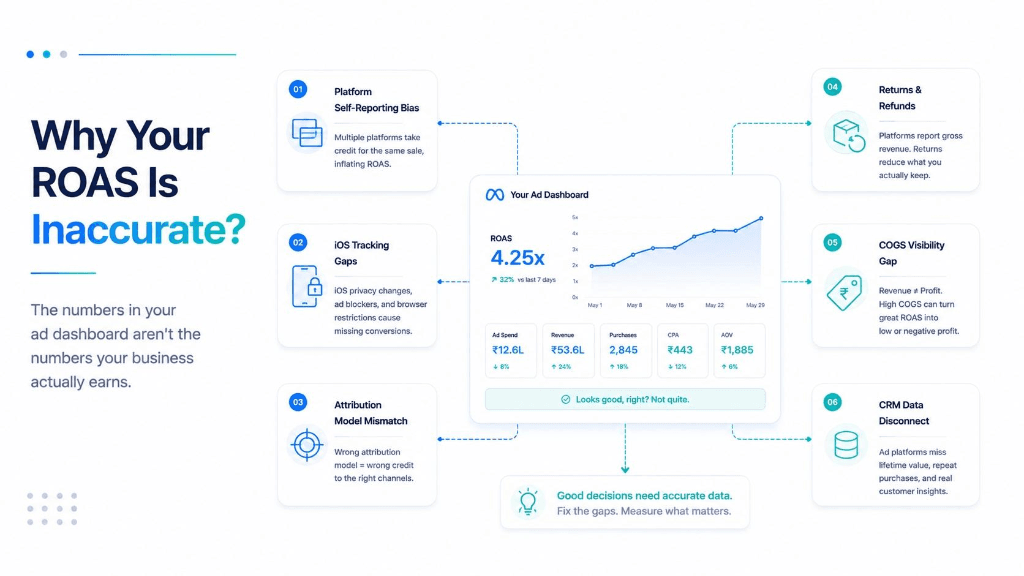
You open Meta Ads Manager on Monday morning. 4.2x ROAS. You flip to Google Ads. 3.8x there. You check your revenue dashboard. The actual number tells a completely different story.

It's the uncomfortable question nobody wants to sit with. Here are the 5 diagnostic tests to find out if your agency is optimising for your real CM2, or just keeping the dashboard green.

ROAS is the metric every D2C brand learns first. It's also the metric that misleads more D2C founders than any other. Discover why Contribution Margin (CM2) is the true fuel gauge.

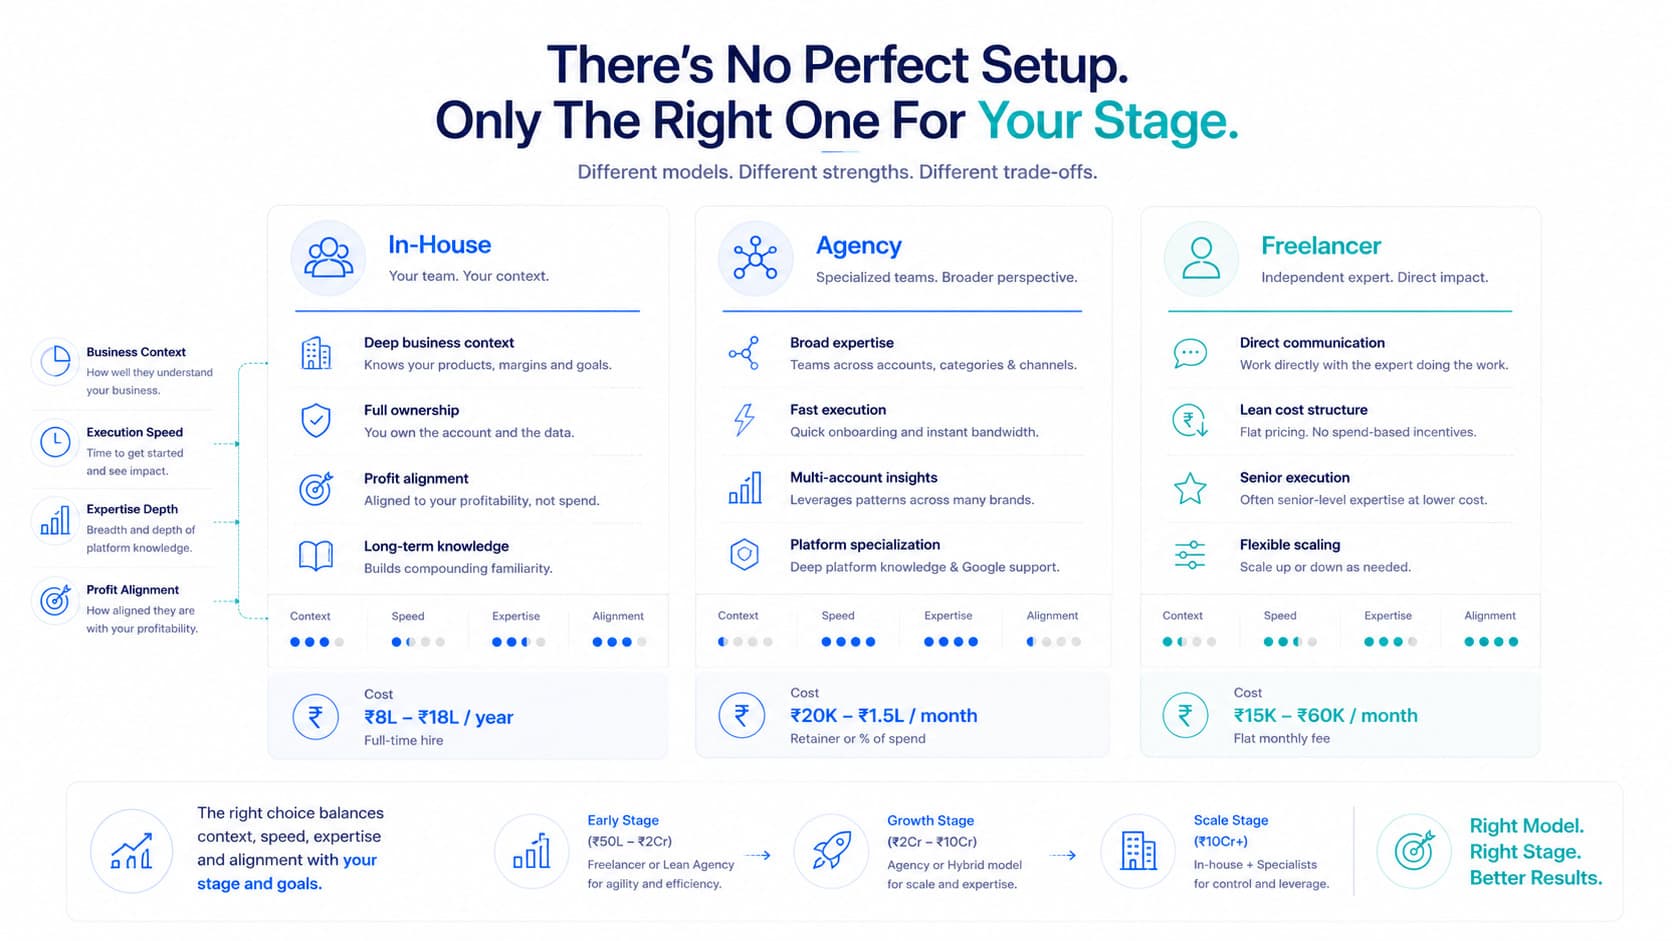
You've decided Google Ads is worth investing in. Now comes the question every D2C founder faces: who actually runs it? The honest breakdown of the 3 options and the hybrid model.

Most brands do competitor research wrong. They screenshot a few ads and call it intelligence. Here is the framework to extract patterns and translate them into profitable strategies.

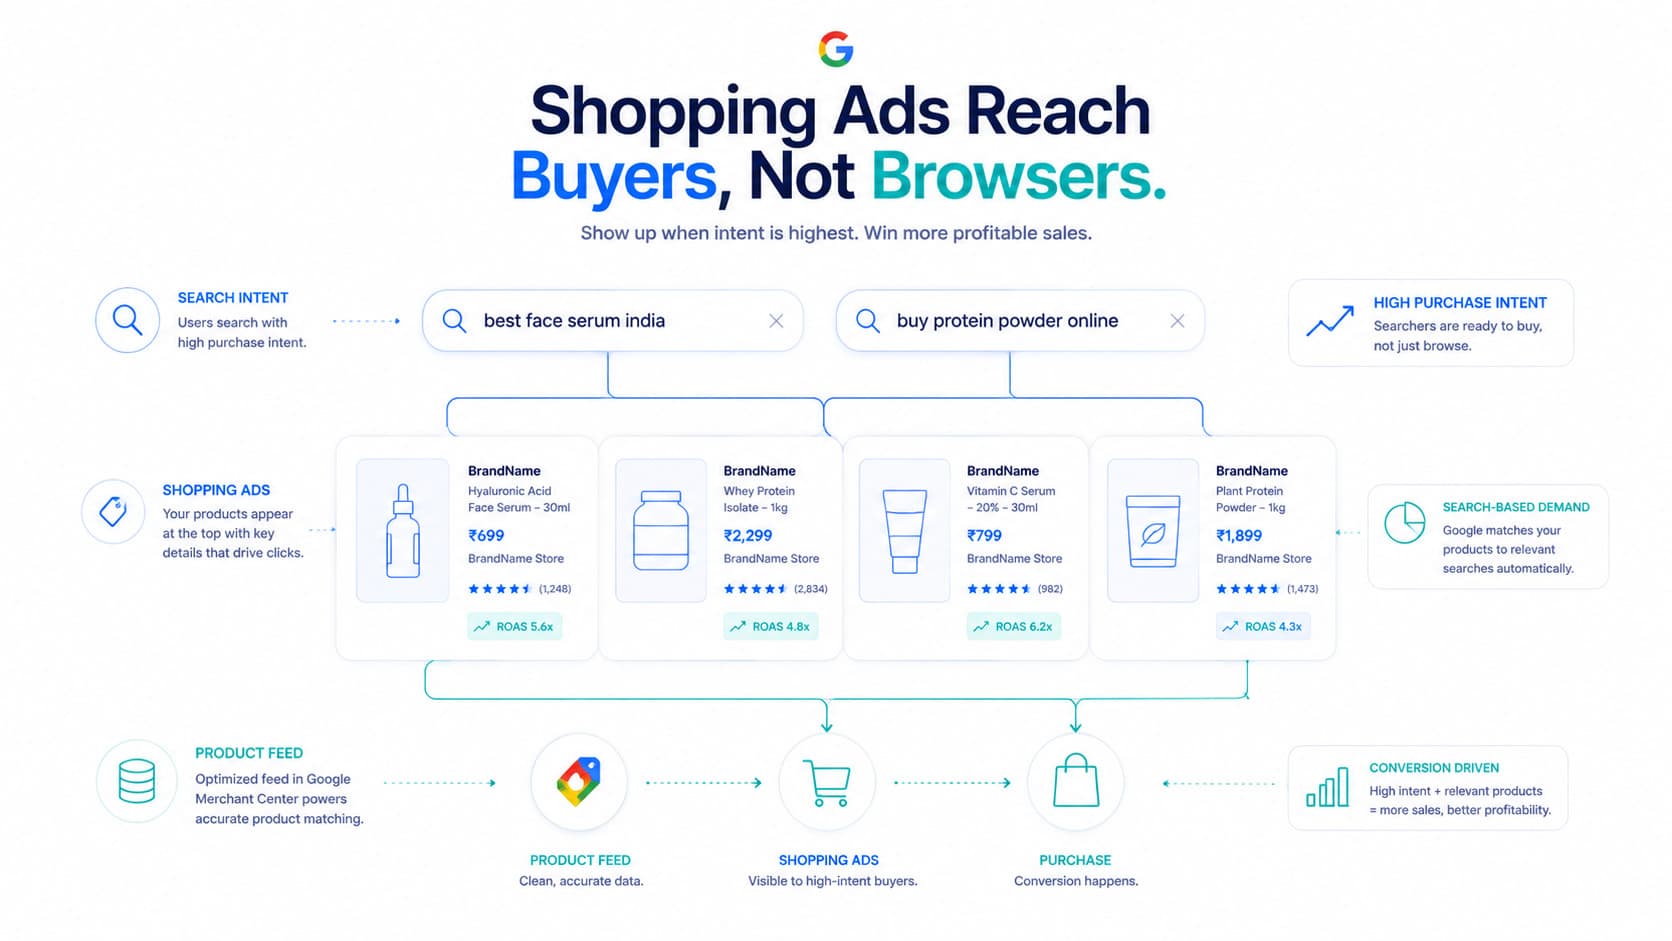
When someone searches on Google, they aren't browsing — they are buying. Here's how to master Google Shopping, optimize your product feed, and scale on true CM2 instead of ROAS.

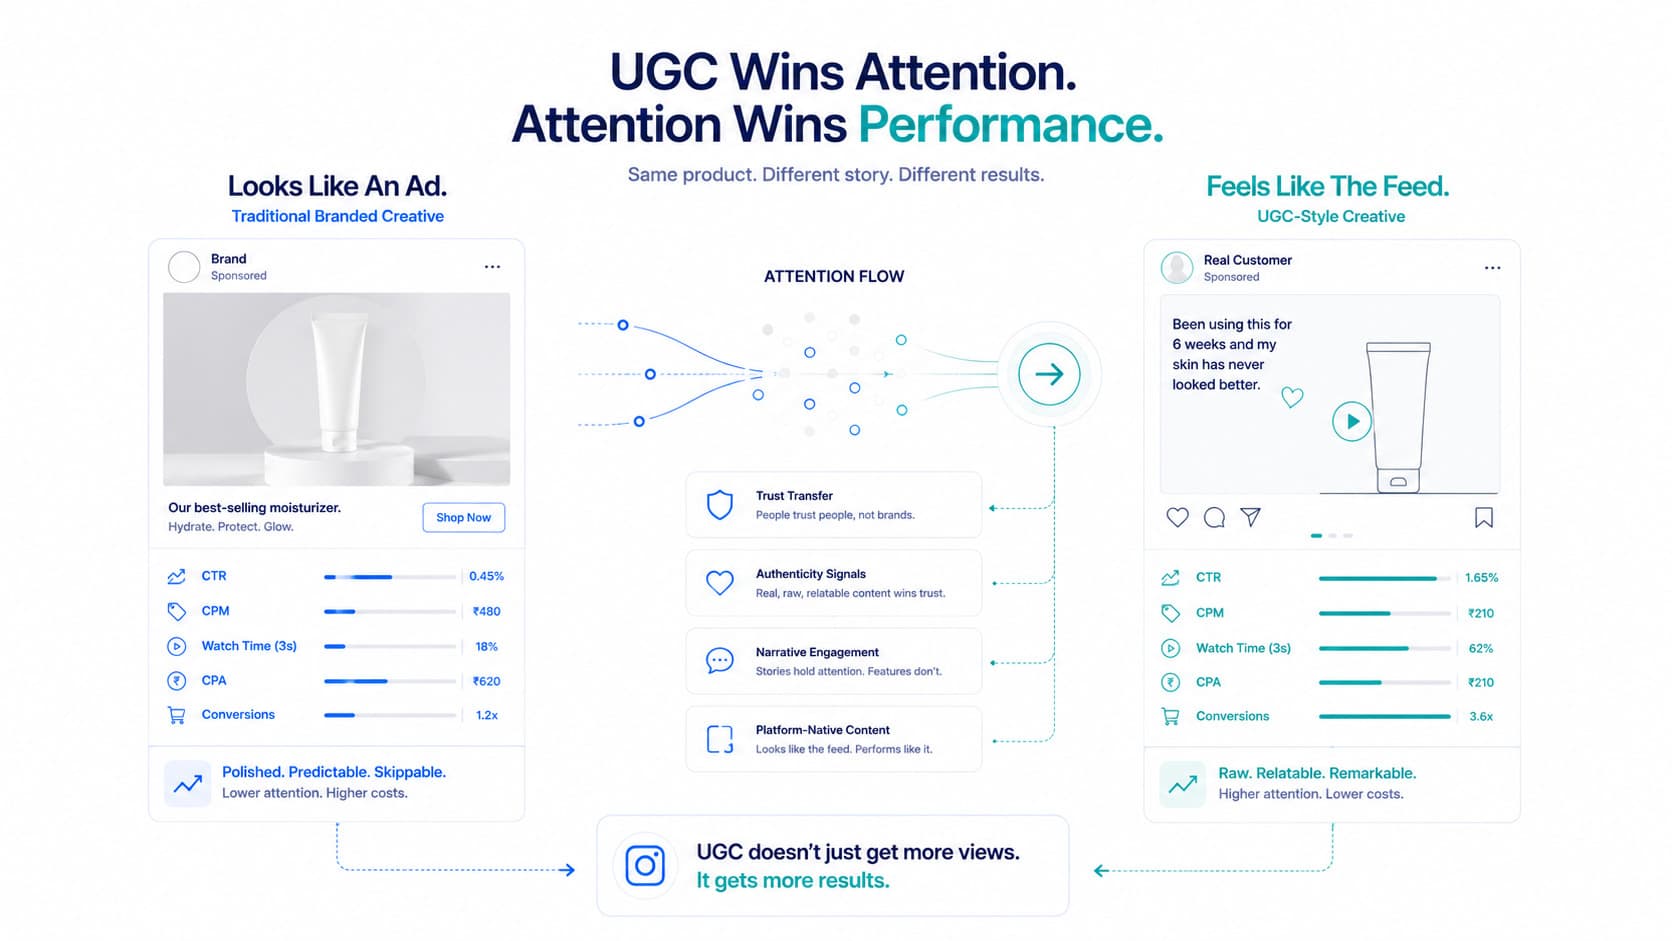
Your highest-performing Instagram ad probably won't come from a studio shoot. It'll come from a customer filming a 60-second video on their phone. Here's why UGC works and how to scale it.

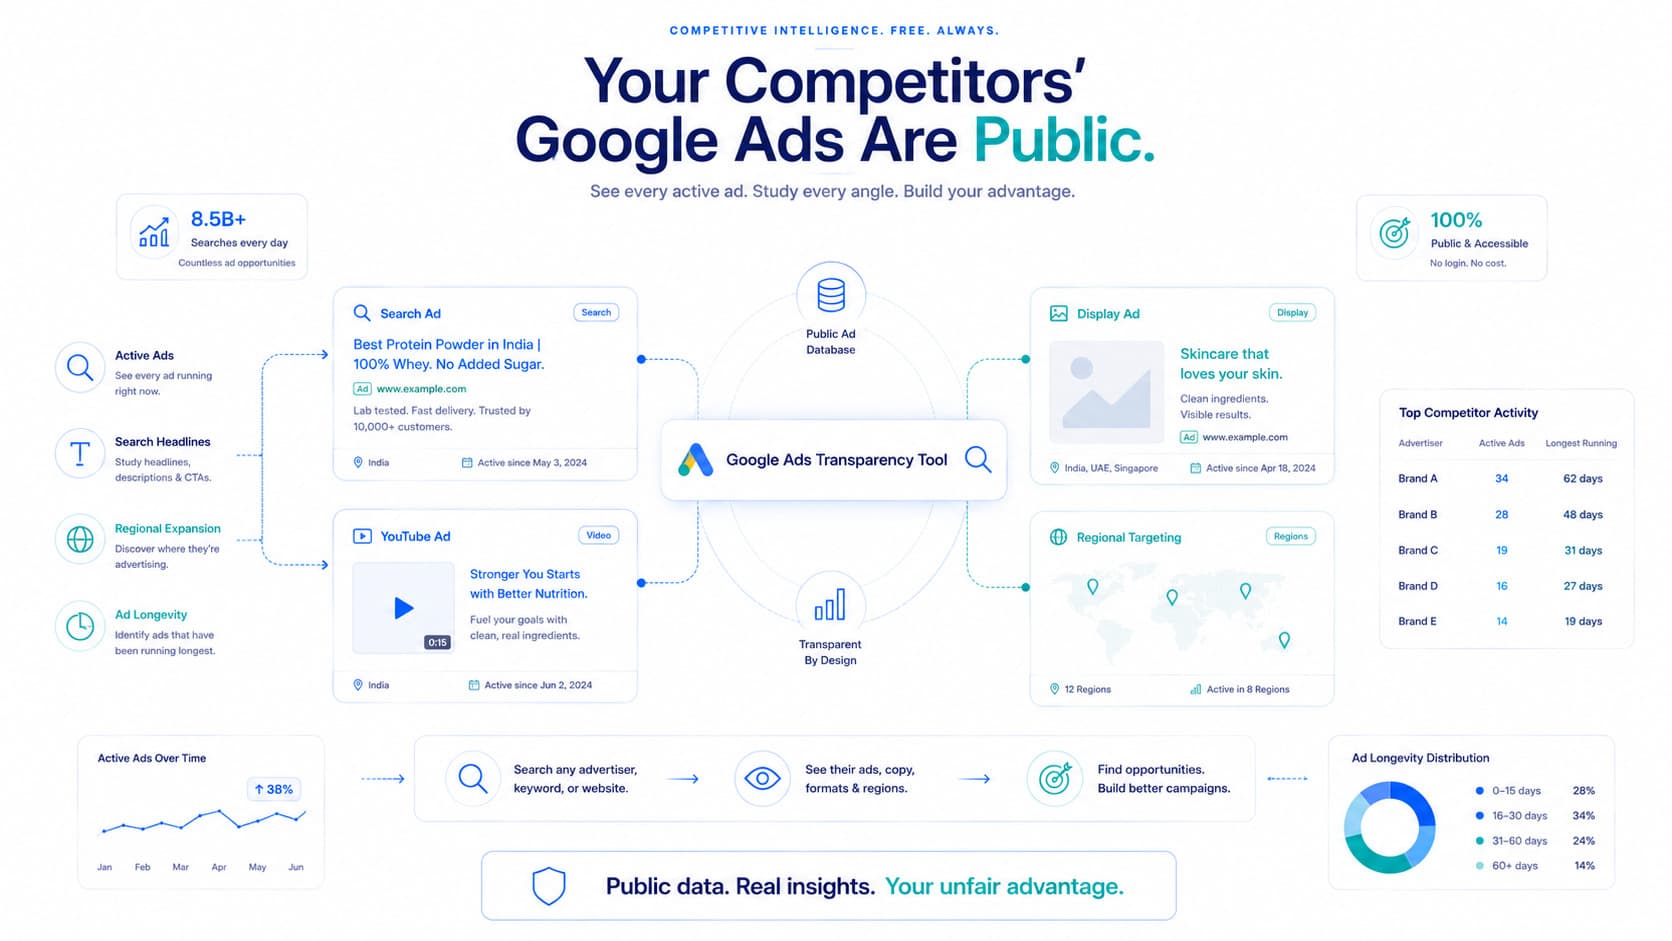
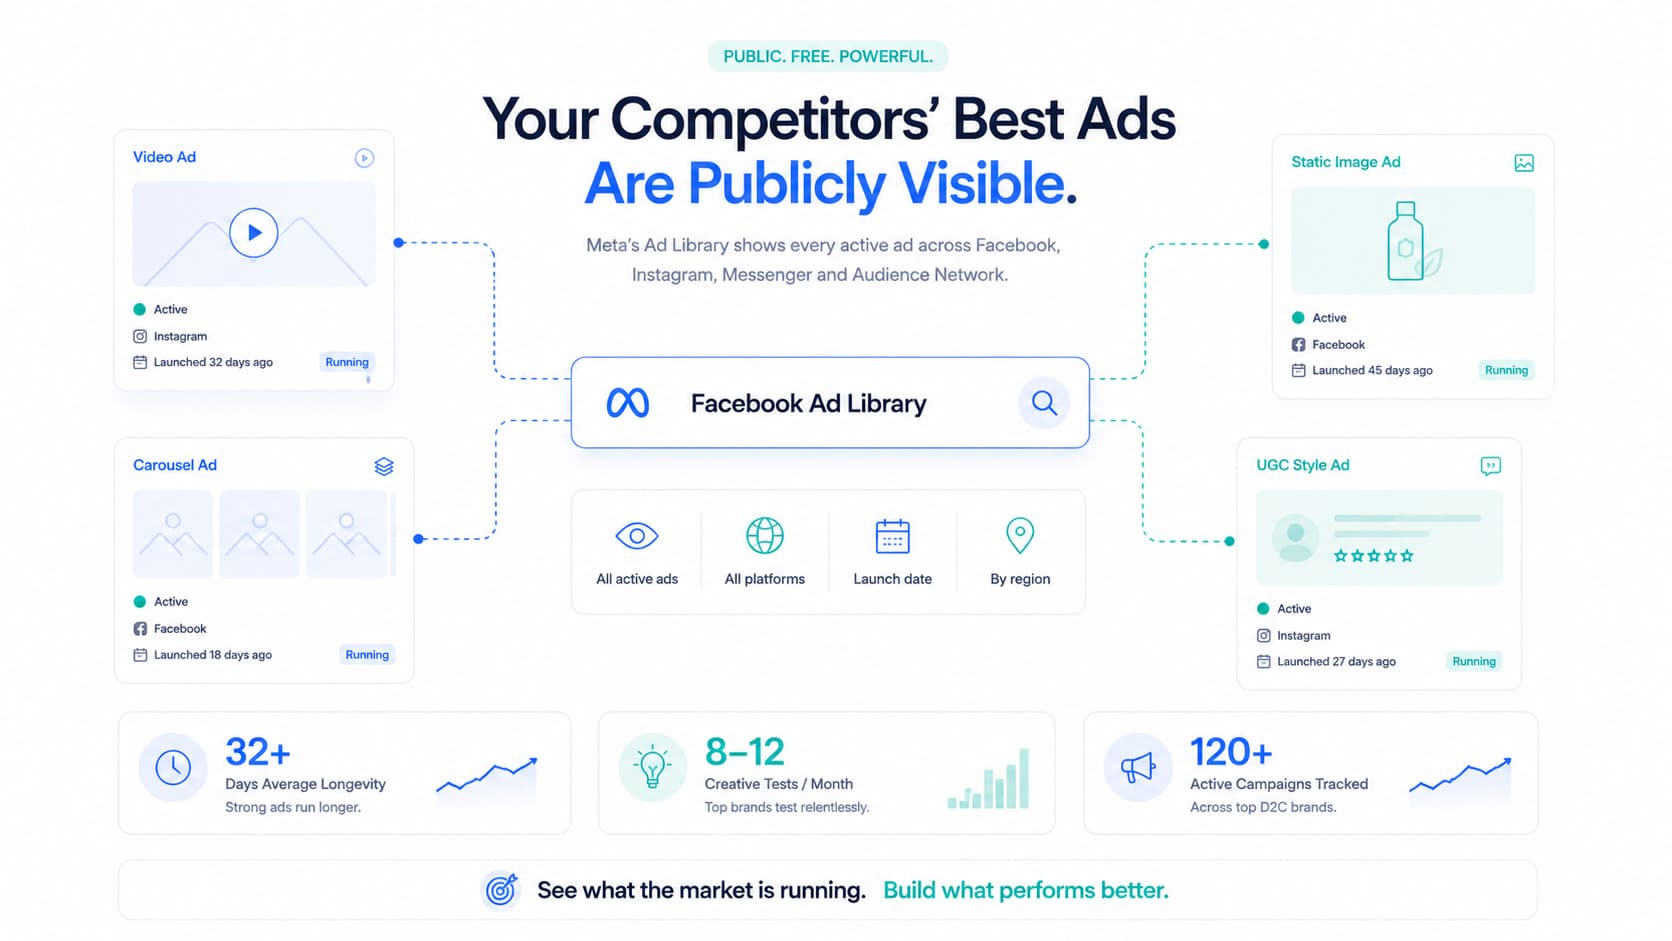
Most D2C brands know about Meta's Ad Library. Far fewer use Google's equivalent — which is free, powerful, and covers Search, Display, and YouTube ads. Here's how to use it properly.

Instagram is where D2C brands are built. Over 2 billion active users. A feed built for product discovery. This guide walks you through exactly how to set up, run, and optimise Instagram ads for profitable growth.

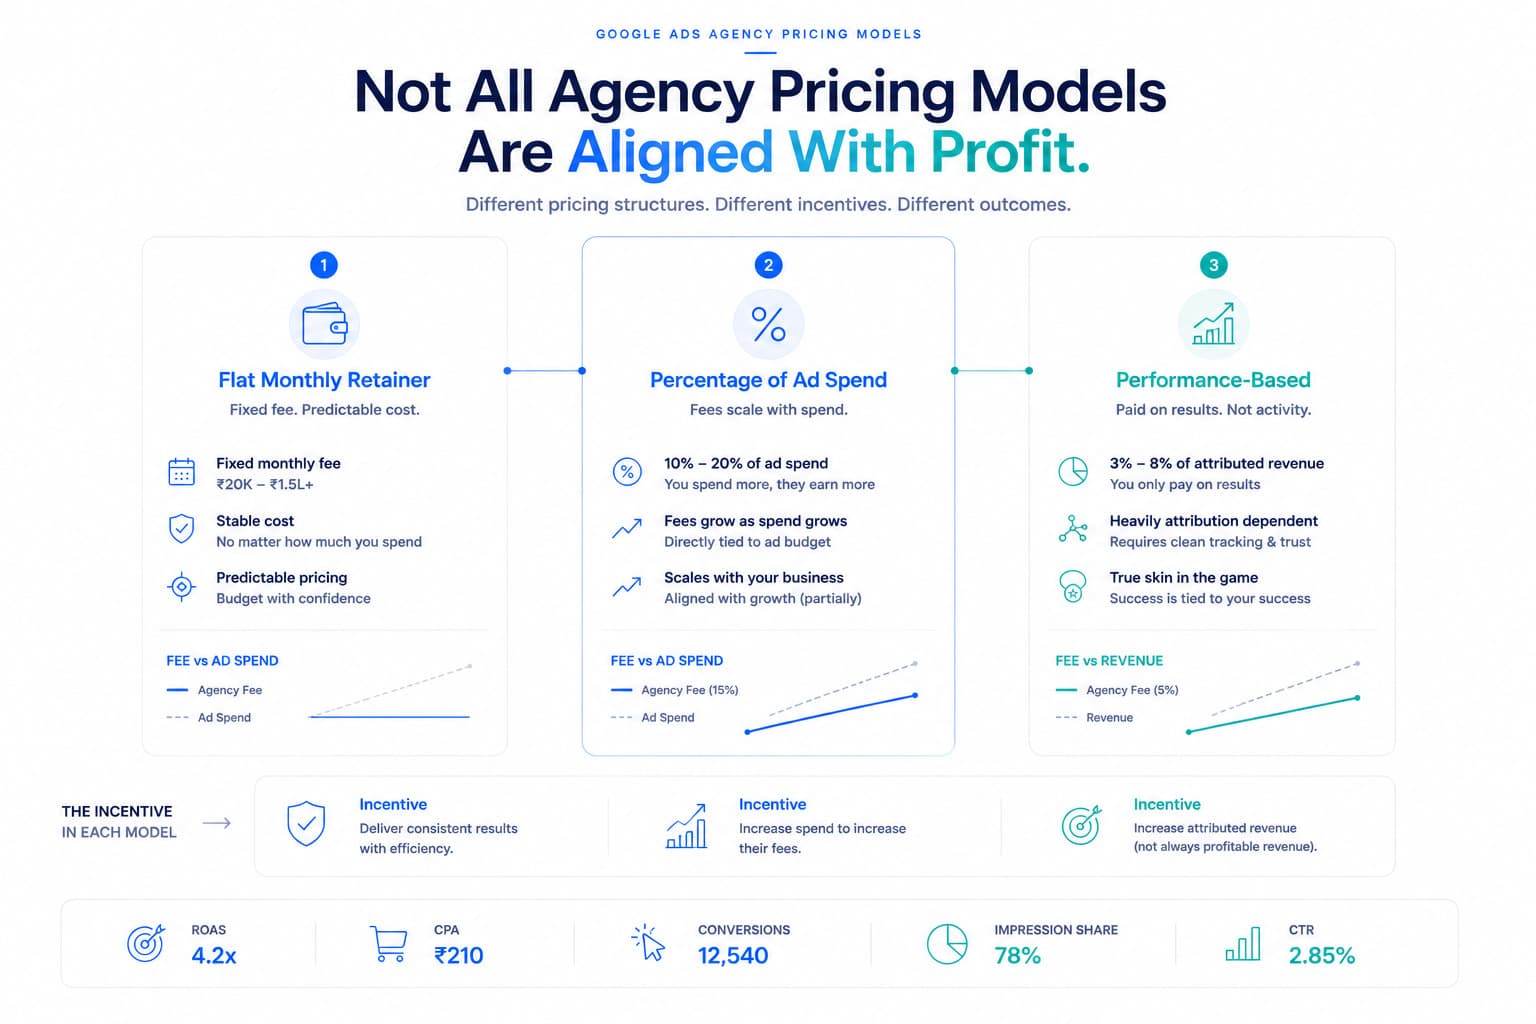
You've decided to run Google Ads. You get three agency proposals. The numbers are all different. This guide breaks down exactly how Google Ads PPC agency pricing works and which model makes sense at which stage.

Your competitors are running ads right now. You can see every single one of them — for free. This guide covers how the Ad Library works, how to use it properly, and what to look for beyond just 'inspiration.'

You've got a great product. A clean website. A strong offer. But nobody knows you exist. This guide breaks down what advertising really means for D2C brands and why contribution margin — not ROAS — is the metric that matters.

Monthly review call. ROAS is up. CPA is down. You hang up feeling fine. Then you check your bank account. Where is the money? Here's the brutal truth nobody in that call will say out loud.

Your ROAS isn't a single source of truth. It's the output of multiple systems, attribution assumptions, missing data, and modeled estimates — all compressed into one number. Here's why that matters.
Claude and ChatGPT are incredible for analyzing data you give them. Flable shows you the data you didn't know you were missing.
Looking for a Northbeam alternative that goes beyond attribution? Northbeam is the most sophisticated ecommerce attribution tool available. But even perfect multi-touch attribution cannot tell you if a sale is profitable.
Both platforms connect to your ads and your Shopify store. One stops at the revenue line. The other goes beneath it — into COGS, shipping, returns, and discounts — to show you what you actually keep.