Attribution
Every D2C brand talks about LTV. Very few calculate it correctly.
3 : 1
Target healthy ratio
Cohort Method
Real observed behavior
Contribution LTV
Net of COGS, shipping & returns
The common version, take your average order value, multiply by average purchase frequency, call it LTV, produces a number that sounds meaningful and is rarely actionable. It mixes high-value and low-value customers into an average that represents nobody. It doesn't account for the channel those customers came from. And it gives you no way to know whether LTV is improving or deteriorating as you scale.
The correct version, cohort-based, channel-specific, contribution margin adjusted, tells you something completely different. It tells you which customers are actually worth acquiring, how much you can afford to spend to get them, and whether your business model is getting stronger or weaker as it grows.
Here's both methods, when to use each, and the mistakes that make LTV calculations misleading.
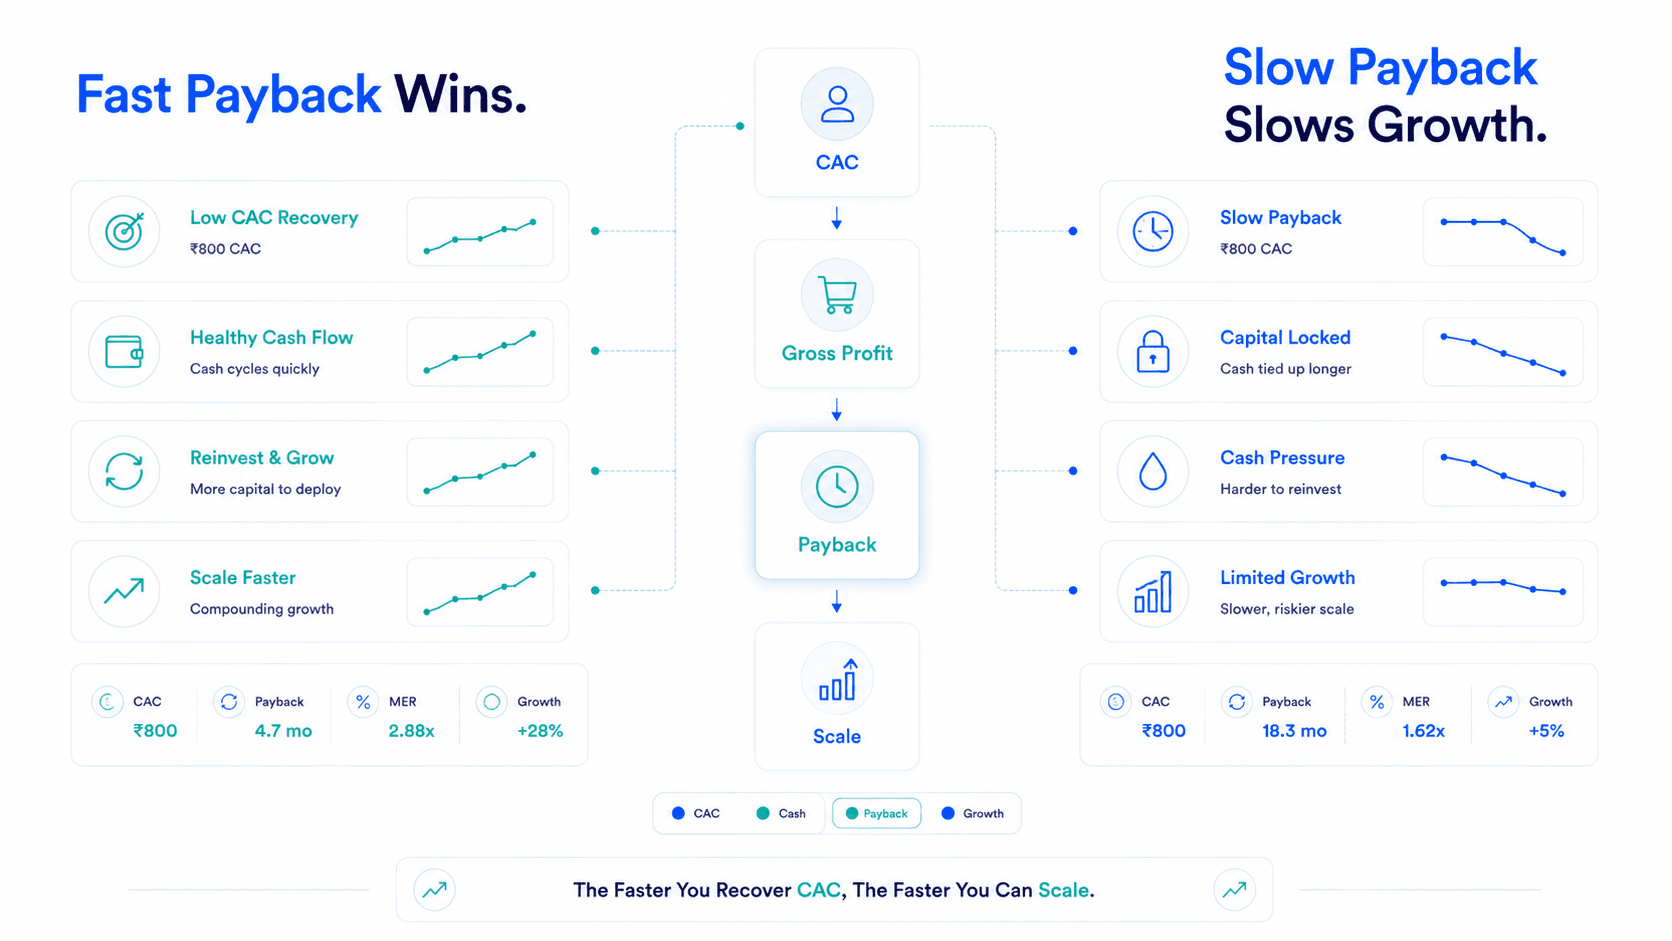
The pillar blog on CAC Payback Period showed that Payback Period = True New Customer CAC ÷ Monthly Gross Profit per Customer.
Monthly Gross Profit per Customer comes directly from your LTV calculation — specifically from the purchase frequency and effective margin components.
If your LTV calculation is wrong, your payback period is wrong. And if your payback period is wrong, your scaling decisions are wrong — you'll either over-invest in channels that appear to justify high CAC when the real LTV doesn't, or under-invest in channels where the real LTV justifies significantly higher acquisition spend than you're currently deploying.
Accurate LTV is the foundation every CAC justification decision rests on.
Blended LTV averages mask the truth. Cohort-based Contribution LTV reveals the exact payback velocity of customers acquired from each specific ad channel.
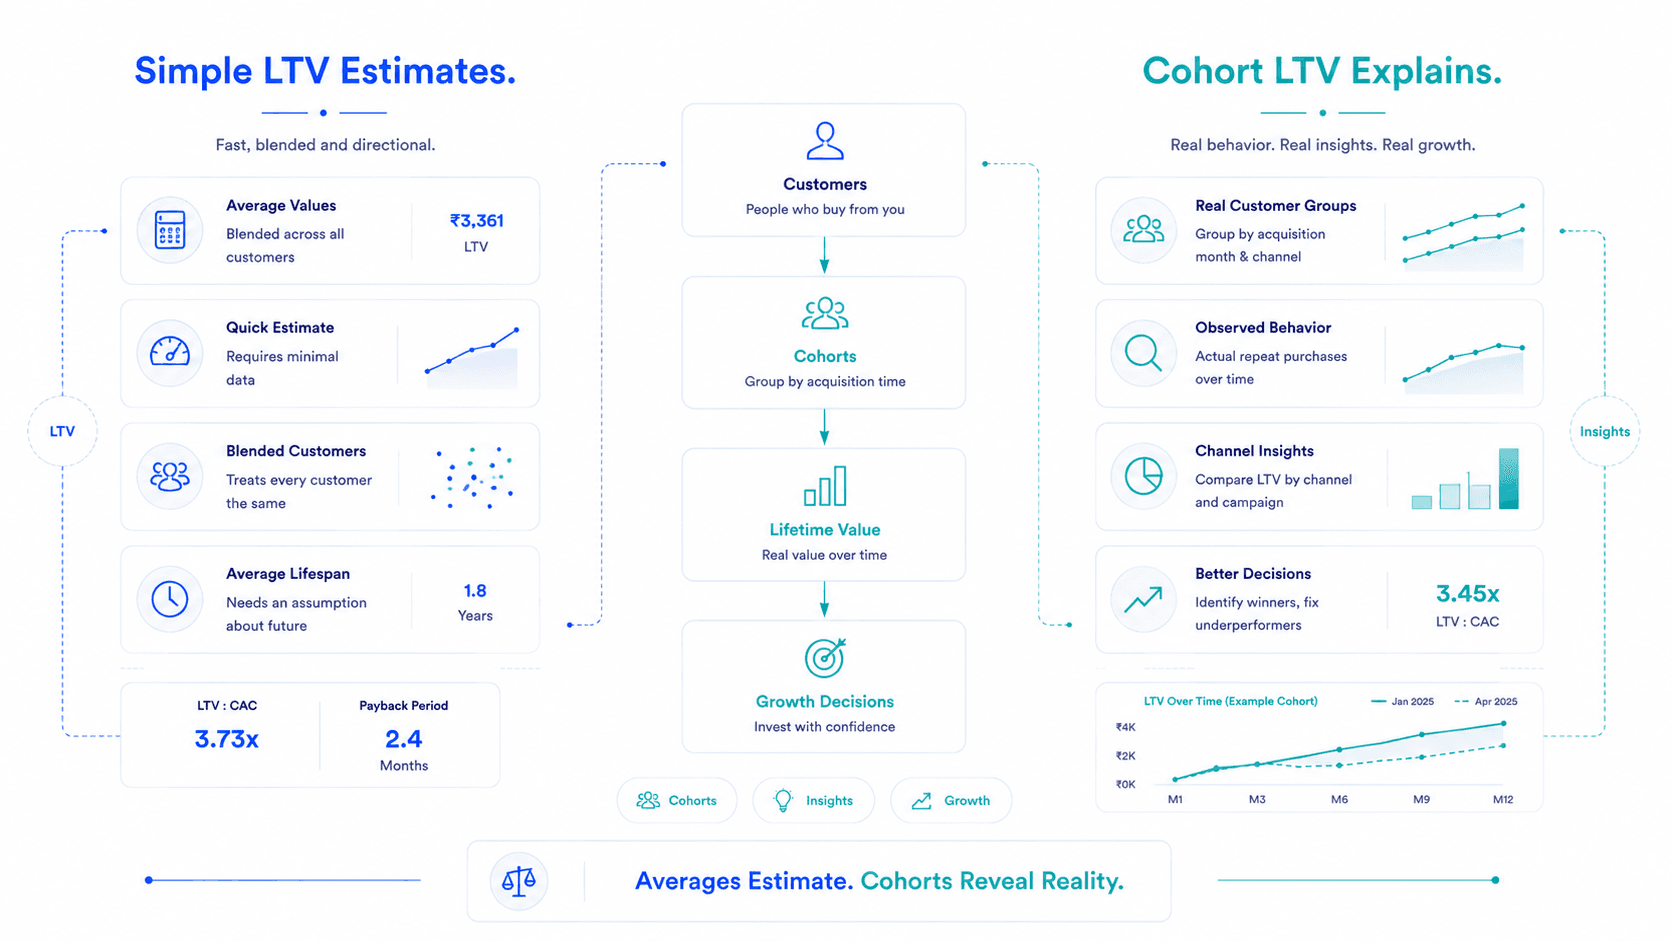
This is the formula most D2C brands use. It's fast, requires minimal data, and produces a directional estimate.
Where to get each component:
Example Calculation:
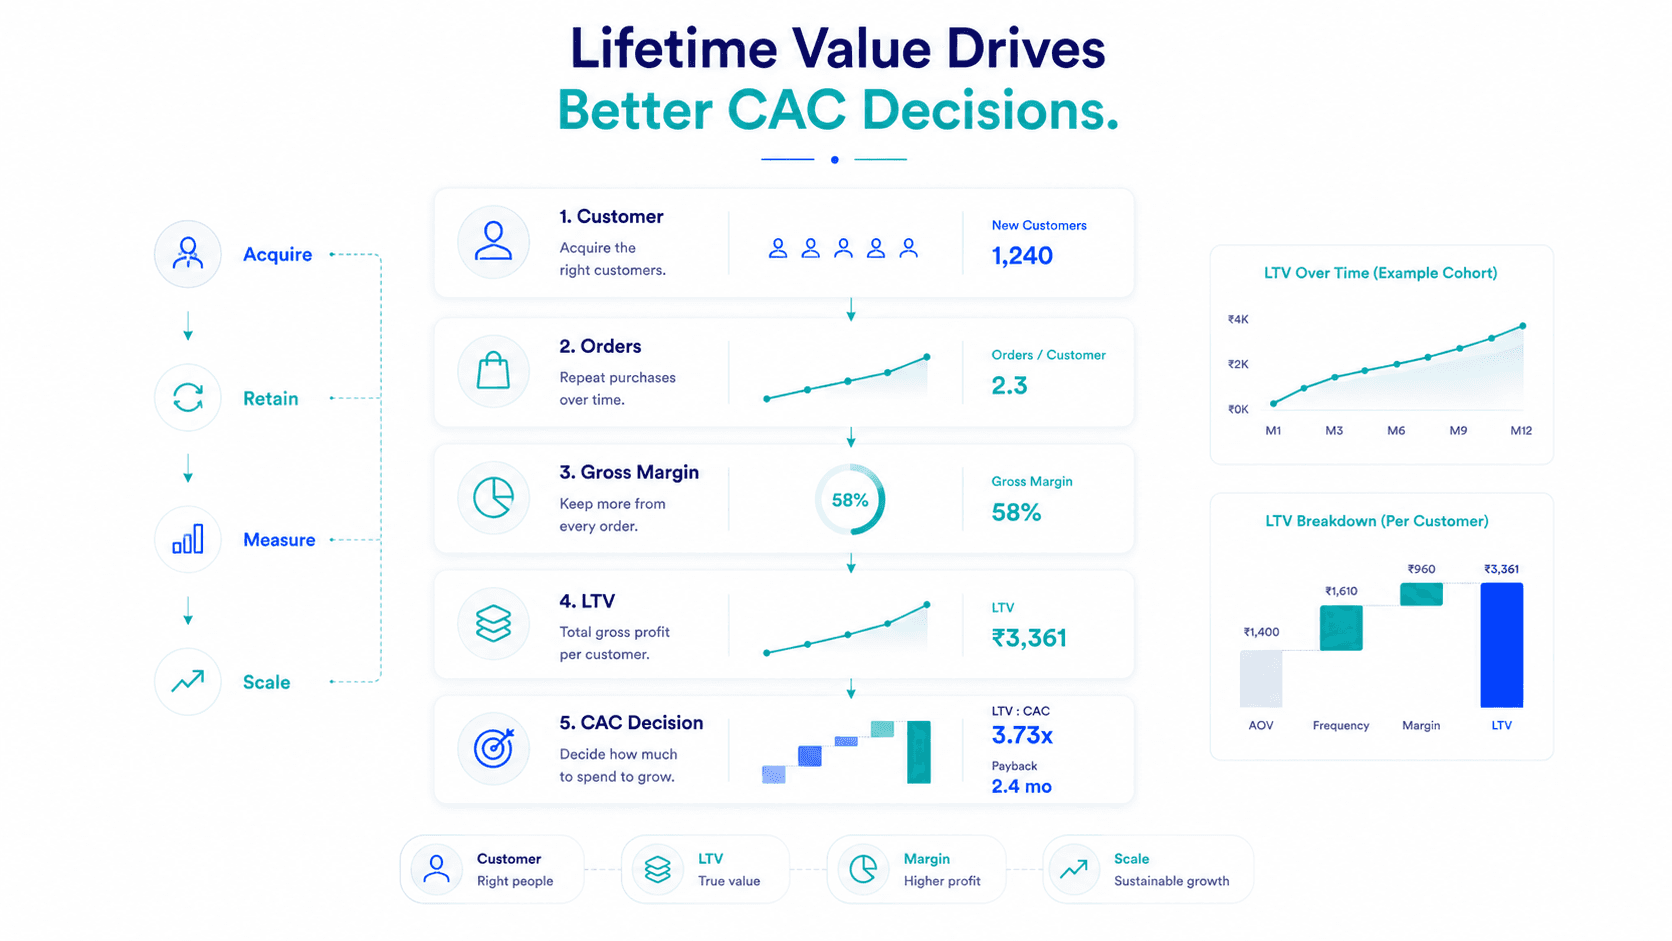
At this LTV, a true new customer CAC of ₹900 represents a 3.73:1 LTV:CAC ratio — healthy, and strong enough to justify the acquisition cost.
The simple method's limitations:
It's a blended average. It treats every customer the same regardless of where they came from, what they bought first, or what discount brought them in. A Meta-acquired customer and a Google-acquired customer both go into the same ₹3,361 estimate — even if the Meta customer repurchases at 3.2x/year and the Google customer at 1.8x/year.
It also requires estimating customer lifespan — a number that's difficult to calculate for brands under 3 years old and potentially misleading if your business has changed significantly over time.
Use simple method for:
Quick LTV estimates, investor communications, early-stage decision-making before you have sufficient cohort data.
Don't use simple method for:
Channel-specific CAC justification, detailed payback period calculations, or decisions where getting the number wrong by 40% changes strategy.
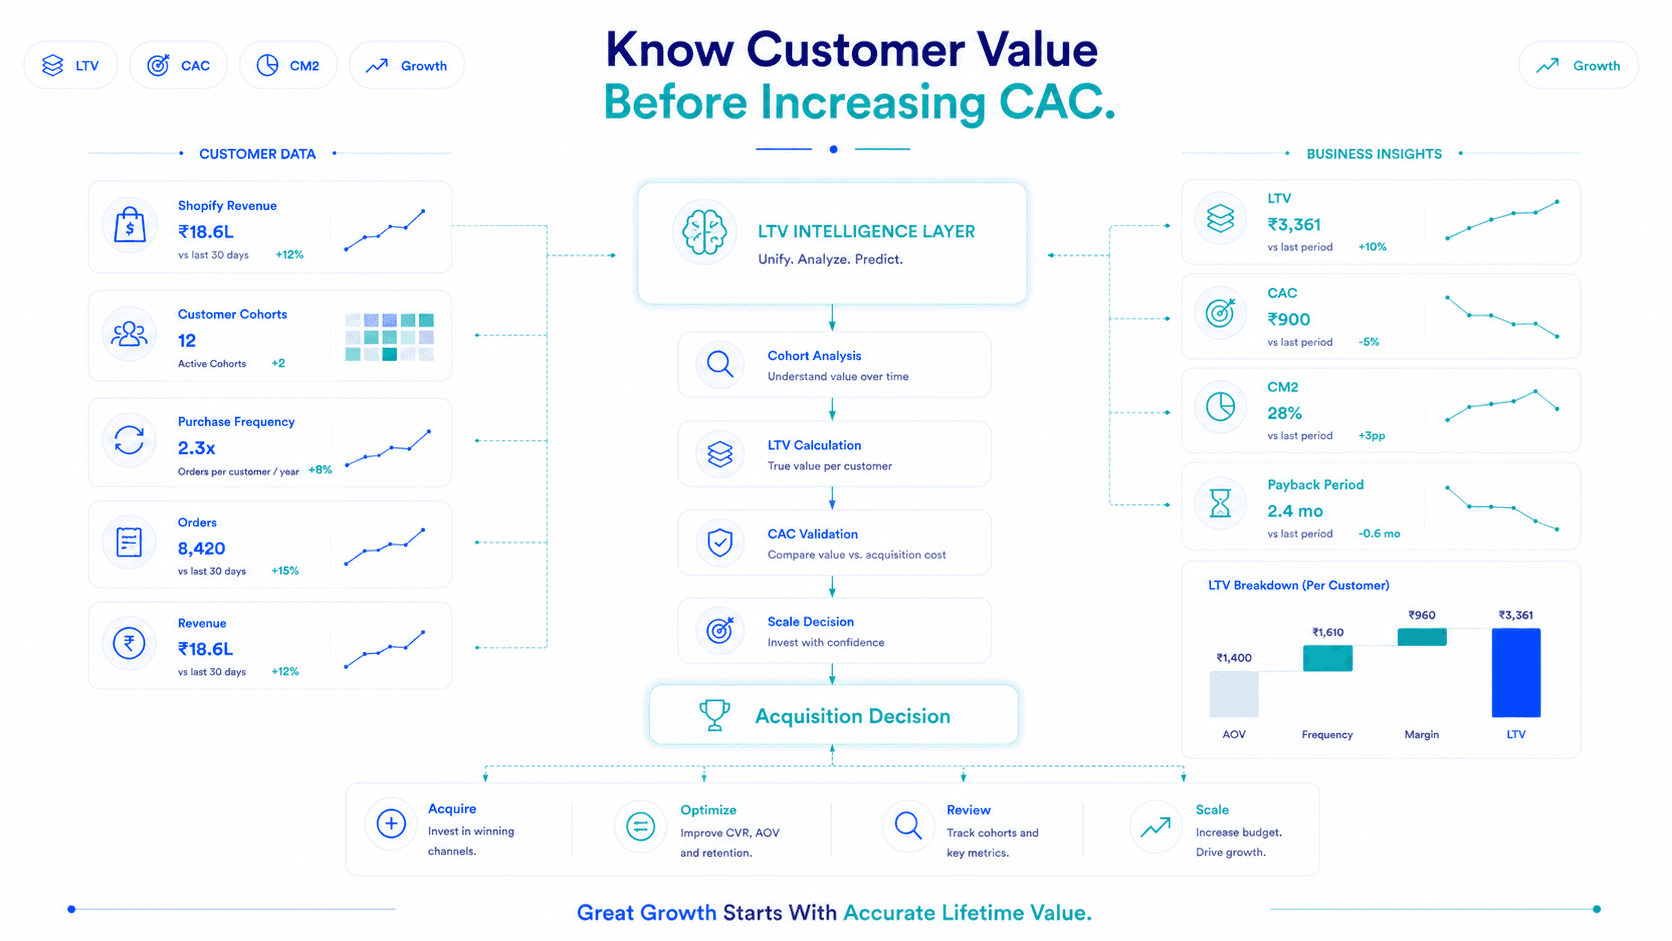
Cohort LTV tracks groups of customers acquired in the same time period and measures their cumulative revenue and gross profit over time without projecting or assuming anything about future behaviour.
Step 1: Define Your Cohorts
Group customers by acquisition month. Every customer who made their first purchase in January 2026 is the January 2026 cohort. February 2026 is a separate cohort. And so on. Pull from Shopify: customer first order date, all subsequent order dates, and order values.
Step 2: Calculate Cumulative Revenue Per Cohort at Each Time Interval
For each cohort, calculate:
Example Cohort Table (January 2026 Cohort, 200 Customers):
| Time Since First Purchase | Cumulative Revenue per Customer | Cumulative Gross Margin per Customer |
|---|---|---|
| Month 1 | ₹1,350 | ₹783 |
| Month 3 | ₹1,840 | ₹1,067 |
| Month 6 | ₹2,440 | ₹1,415 |
| Month 9 | ₹2,910 | ₹1,688 |
| Month 12 | ₹3,220 | ₹1,868 |
12-month LTV for this cohort: ₹3,220 (revenue) / ₹1,868 (gross margin).
Step 3: Build the Full Cohort Grid
Repeat for each monthly cohort you have data for. The result is a grid showing LTV at each time interval for each cohort — making it immediately visible whether LTV is improving or deteriorating over time.
Full Cohort Grid Example:
| Cohort | 3-Month LTV | 6-Month LTV | 12-Month LTV | Trend |
|---|---|---|---|---|
| Jan 2025 | ₹1,920 | ₹2,680 | ₹3,450 | Baseline |
| Apr 2025 | ₹1,740 | ₹2,410 | ₹3,190 | Slightly below baseline |
| Jul 2025 | ₹1,560 | ₹2,140 | — | Tracking below — investigate |
| Oct 2025 | ₹1,420 | ₹1,890 | — | Significantly below — urgent |
| Jan 2026 | ₹1,350 | — | — | Early signal, too early to conclude |
This brand's LTV has been declining across cohorts. Recent cohorts are generating less revenue per customer than older ones — suggesting either a shift in customer quality (more discount-driven acquisition), a weakening product or retention experience, or audience saturation bringing in less-ideal customers.
The simple LTV method averages all of this together and shows a stable number. The cohort method reveals a trend that demands action.
Revenue LTV tells you what customers spent. Contribution Margin LTV tells you what they were worth to the business.
CM LTV = Cohort Cumulative Revenue × Effective Margin %
Where Effective Margin = Gross Margin % − Shipping % − Returns % − Payment Processing %
Using the January 2026 Cohort (38% Effective Margin):
| Time | Revenue LTV | CM LTV (38% margin) |
|---|---|---|
| Month 3 | ₹1,840 | ₹699 |
| Month 6 | ₹2,440 | ₹927 |
| Month 12 | ₹3,220 | ₹1,224 |
Monthly CM LTV pace: ₹1,224 ÷ 12 = ₹102 per month
Now the payback period:
CAC Payback Period = True New Customer CAC ÷ Monthly CM LTV
If true new customer CAC is ₹860: Payback Period = ₹860 ÷ ₹102 = 8.4 months
This is longer than the simple method might have suggested. Effective margin (after all variable costs) generates slower payback than gross margin alone. The accurate number is the one that matters for cash flow planning.
This is where cohort LTV becomes a strategic superpower for D2C brands.
Segment your cohorts by the channel that acquired them. Customers first acquired through Meta prospecting form one cohort group. Customers first acquired through Google Shopping form another. Customers first acquired through influencer campaigns form a third.
Meta-Acquired Customer:
Discount-Acquired Customer:
Same product. Same apparent acquisition. Vastly different LTV.
If you're spending the same CAC to acquire both and using a blended LTV:CAC ratio to justify the spend — you're cross-subsidising your worst customers with your best ones and not knowing it.
Channel-specific LTV drives channel-specific CAC targets. The channel that acquires ₹1,400 LTV customers can justify ₹900 CAC. The channel that acquires ₹720 LTV customers should have a CAC ceiling of ₹480 (at 3:1 LTV:CAC target).
To calculate: filter Shopify customers by acquisition UTM source → group into channel cohorts → run the cohort LTV calculation per channel → compare 12-month CM LTV across channels → set differentiated CAC targets accordingly.
Brands under 2–3 years old don't have enough data to calculate a true average customer lifespan. Two approaches:
Approach 1: Use observed data with a growth assumption
If your oldest cohort is 18 months old and shows ₹3,200 revenue LTV at 18 months, extrapolate based on the deceleration rate of incremental purchases. If the pace of new purchases slows by 20% per quarter, project forward to get an estimated 24-month and 36-month LTV.
Approach 2: Use industry category benchmarks
If a customer bought from you 2 years ago, lapsed, and re-acquired through a Meta remarketing campaign — their reactivation order is not new customer LTV. It belongs to the original acquisition cohort, not the current period. Mixing reactivated customers into new cohort calculations inflates LTV for newer cohorts.
Cohort LTV calculated on gross revenue (including orders that were returned) overstates actual customer value. Use net revenue (post-returns) for accurate LTV.
A cohort of 200 customers where 20 are ultra-high-frequency buyers (8+ orders/year) skews the average significantly. Consider calculating median LTV alongside mean LTV if they're far apart — a small group of power users is inflating the average.
Blended LTV hides the channel-specific quality differences that should be driving your CAC targets. Always segment by channel before using LTV to justify spend.
LTV is not the ₹3,361 you get from multiplying three averages together. It's a cohort-based, channel-specific, contribution margin-adjusted number that tells you precisely how much each type of customer is worth — and therefore how much you can spend to acquire them.
The simple method gives you a starting point. The cohort method gives you strategy.
Build your cohort grid. Calculate it by channel. Adjust for effective margin. Feed the result into your payback period calculation. And use the LTV:CAC ratio and payback period together — because LTV alone, without knowing when it arrives, is only half the picture.
LTV is what justifies the CAC. The cohort method is what makes that justification honest.
Key Takeaways
Frequently Asked Questions
The cohort method tracking cumulative revenue and gross margin contribution per customer from the month of acquisition through 12, 18, and 24 months. Unlike the simple LTV formula (AOV × frequency × margin × lifespan), cohort LTV uses observed behaviour rather than assumed averages and reveals trends that blended calculations hide.
Contribution margin (net revenue minus all variable costs) is the correct basis for LTV when using it to justify CAC. Revenue LTV overstates the business value of each customer because it doesn't account for the shipping, returns, and payment fees consumed by each purchase. Use CM LTV when calculating payback period.
Filter Shopify customers by their first-order acquisition UTM source. Group them into channel cohorts (Meta prospecting, Google Shopping, influencer, etc.). Run the standard cohort LTV calculation for each group separately. Compare 12-month CM LTV across channels — the result often shows 50–100% LTV differences between channels, justifying very different CAC targets.
3:1 is the standard benchmark across most categories. Below 1.5:1 is unsustainable — the business is spending more to acquire customers than they generate in value. Above 5:1 is typically a signal to spend more aggressively on acquisition — you're leaving growth on the table.
Flable calculates CM2 per campaign and true new customer CAC per channel, the inputs needed to calculate payback period accurately. While cohort LTV calculation happens in Shopify, Flable's channel-level profitability data enables you to set channel-specific CAC targets that reflect each channel's real customer quality.
Channel-level CM2 and CAC live, automatic.
Book a Live Demo →Setup in 48 hours · No credit card required · Backed by Microsoft & NVIDIA