Attribution modeling for D2C brands: 6 models, one right answer
Every attribution model tells a different story about the same sale. Most D2C teams pick one, trust it blindly, and wonder why their "winning" channel keeps losing money. Here's what each model actually does — and why none of them matter if you're not measuring contribution margin underneath.
What attribution modeling actually is
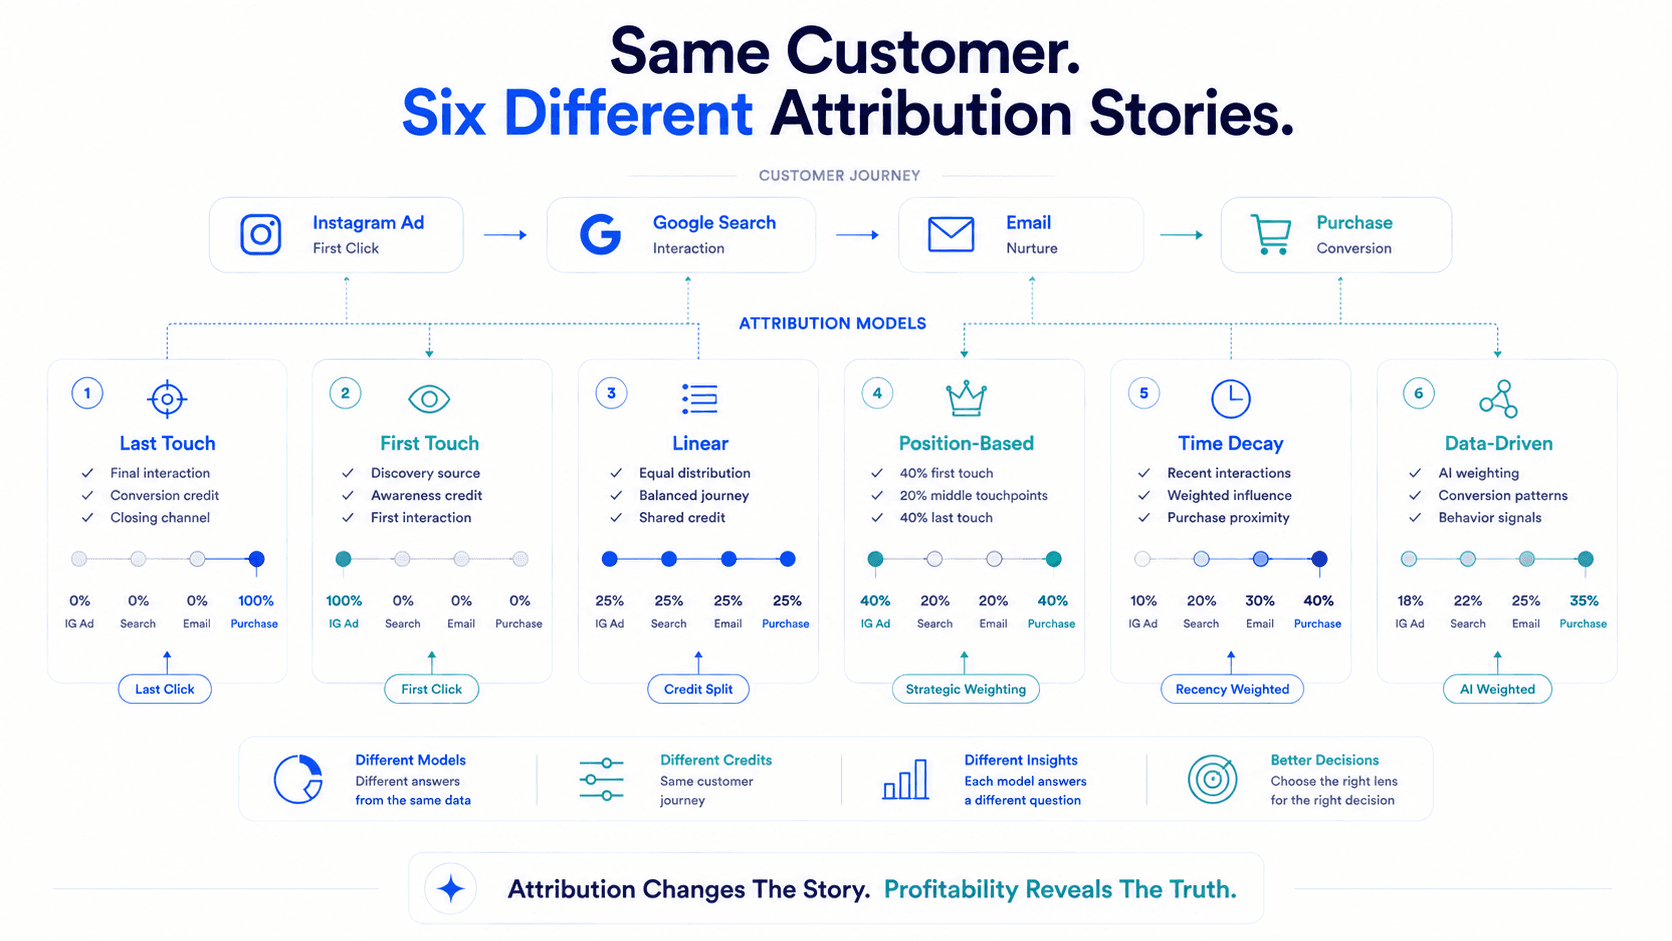
Attribution modeling is the rulebook you use to decide which touchpoint gets credit for a sale. A customer sees your Instagram ad, clicks your Google search ad three days later, opens an email, then buys. Five different marketers, using five different models, will tell you five different channels "caused" that sale — and reallocate budget five different ways.
That's the whole problem. Attribution isn't a measurement of truth. It's a set of assumptions you're choosing to make about a customer journey you can't fully see. The model you pick doesn't just report your marketing performance — it actively shapes where next month's budget goes. Get the model wrong for your business and you'll systematically defund the channels that are actually working.
FLABLE POVAttribution tells you which touchpoint gets credit. It has nothing to say about whether the sale was profitable. A brand can have perfect last-touch attribution and still be burning cash on every order — because attribution stops at revenue, and D2C economics live or die at contribution margin. More on that below.
The 6 models Flable supports — and when to trust each one
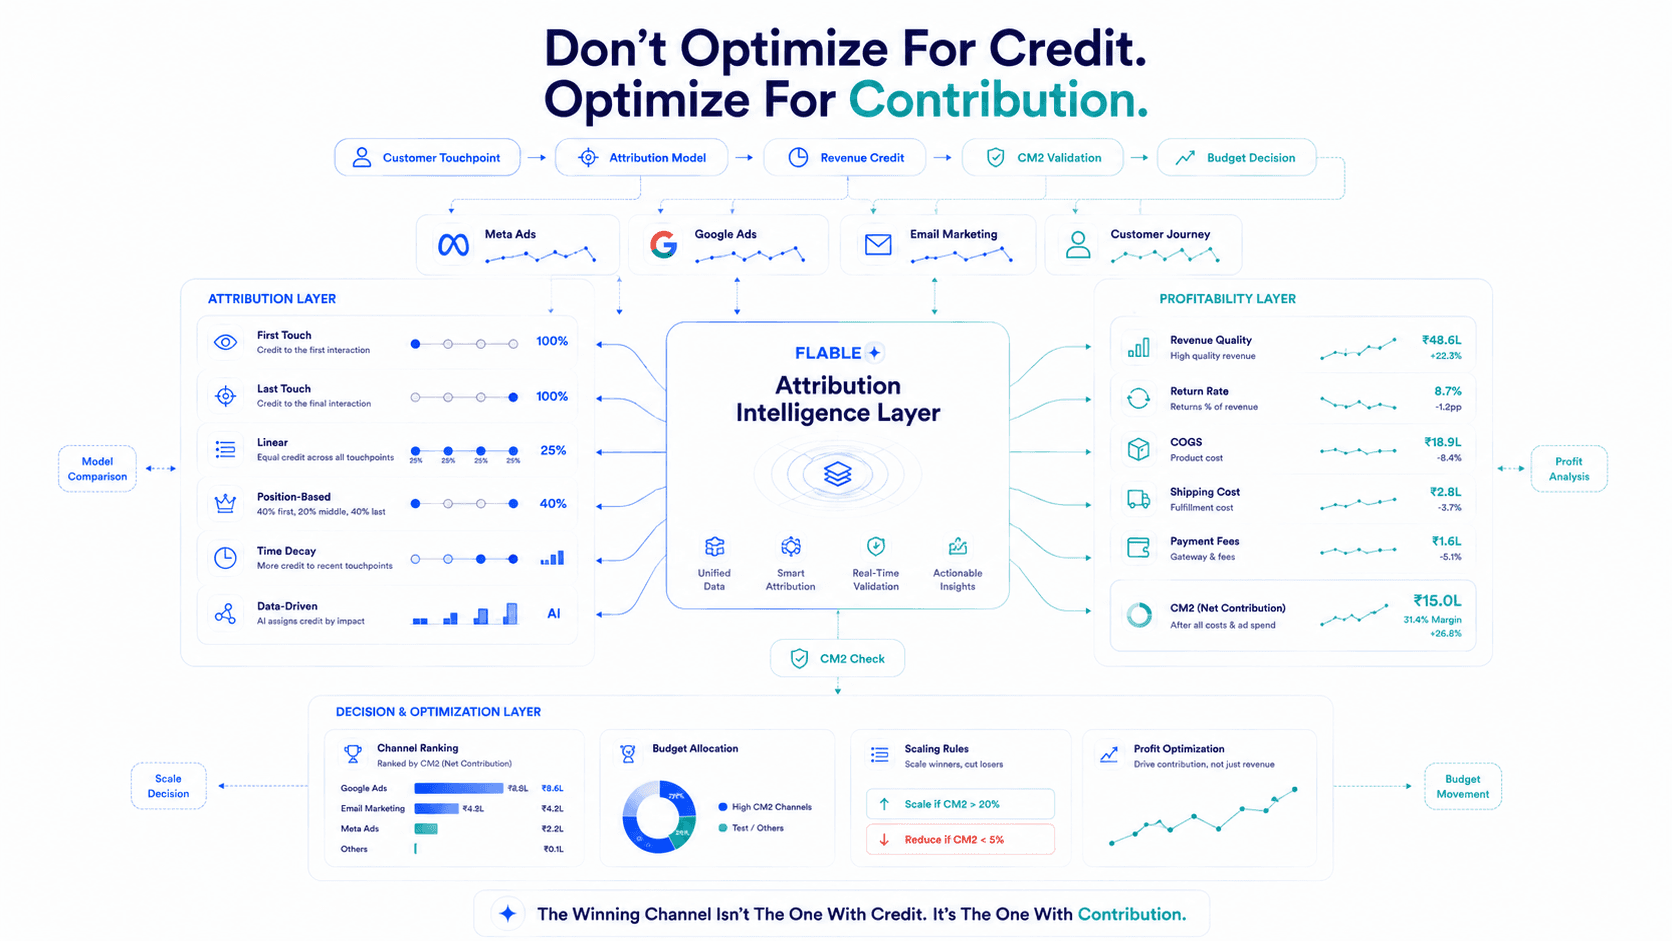
Flable's Attribution module runs Last-touch, First-touch, Linear, Position-based, Time-decay, and Data-driven models side by side on the same dataset, so you're never locked into one story. Here's what each one is actually good for.
Last-Touch
Single-touch100% of the credit goes to the final touchpoint before purchase. If the last thing a customer clicked was a Google Shopping ad, Google gets the sale — full stop, regardless of what happened before.
- Short, low-consideration purchase cycles
- Fast read on closing channels
- Simple, board-level reporting
- Top-of-funnel discovery spend
- Brand-building channels (UGC, influencer)
- Multi-session journeys
First-Touch
Single-touch100% of the credit goes to the very first touchpoint that brought the customer into your world — the ad, post, or search that started the journey.
- Measuring top-of-funnel/discovery efficiency
- New-brand launches judging awareness spend
- Diagnosing which creative "opens the door"
- Everything that closes the sale
- Retargeting and email/SMS nurture value
- Long consideration cycles (30+ days)
Linear
Multi-touchEvery touchpoint in the journey gets equal credit. Four touchpoints before the sale means each one gets 25%, no matter where it sat in the sequence.
- Brands with genuinely long, multi-channel journeys
- Fairly valuing "assist" channels (SEO, organic social)
- A simple, defensible multi-touch baseline
- The fact that not all touches are equally influential
- Nuance between a browse and a high-intent click
Position-Based
Multi-touch (U-shaped)A fixed 40% of the credit goes to the first touchpoint, 40% to the last, and the remaining 20% is split evenly across everything in between. It's built to reward the channel that opened the door and the one that closed the sale, without ignoring the middle entirely.
- Brands who find single-touch models too extreme in either direction
- Balancing discovery spend against closing spend in one view
- An intuitive "best of both worlds" story for founders/investors
- Real influence of middle touchpoints on longer journeys
- Journeys with many middle touches, where that 20% gets diluted thin
Time Decay
Multi-touchCredit increases the closer a touchpoint is to the sale. A click two days before purchase earns more weight than an impression three weeks earlier.
- Sales cycles with a clear "consideration ramp"
- Weighting retargeting fairly without zeroing out earlier touches
- Promo/sale-driven purchase spikes
- Genuinely influential first touches on long journeys
- Requires clean, complete session data to trust
Data-Driven Attribution (DDA)
AlgorithmicInstead of a fixed rule, an algorithm looks at your actual conversion paths — including the paths that didn't convert — and statistically credits each touchpoint based on how much it genuinely increased the odds of a sale. This is the closest any rule-based model gets to causal truth.
- Brands with enough conversion volume to train the model reliably
- Uncovering which channels are true incremental drivers vs. free-riders
- Removing human bias from budget decisions
- Small brands (needs volume — thin data = unstable weights)
- Offline and dark-social influence it can't observe
- Still correlation-based, not a true incrementality test
Same customer, six different stories
Here's one real journey — Instagram ad → Google search → email → purchase — scored by each model. Notice how wildly the "winning" channel changes depending on which lens you use.
| Model | Instagram Ad | Google Search | |
|---|---|---|---|
| Last-touch | 0% | 0% | 100% |
| First-touch | 100% | 0% | 0% |
| Linear | 33% | 33% | 34% |
| Position-based | 40% | 20% | 40% |
| Time decay | 15% | 30% | 55% |
| Data-driven | 42% | 21% | 37% |
Illustrative allocation for a representative D2C journey. Actual weights vary by category, sales cycle, and data volume — this is exactly why running one model in isolation is a budget-allocation risk, not a reporting choice.
Why attribution alone still gets D2C budgets wrong
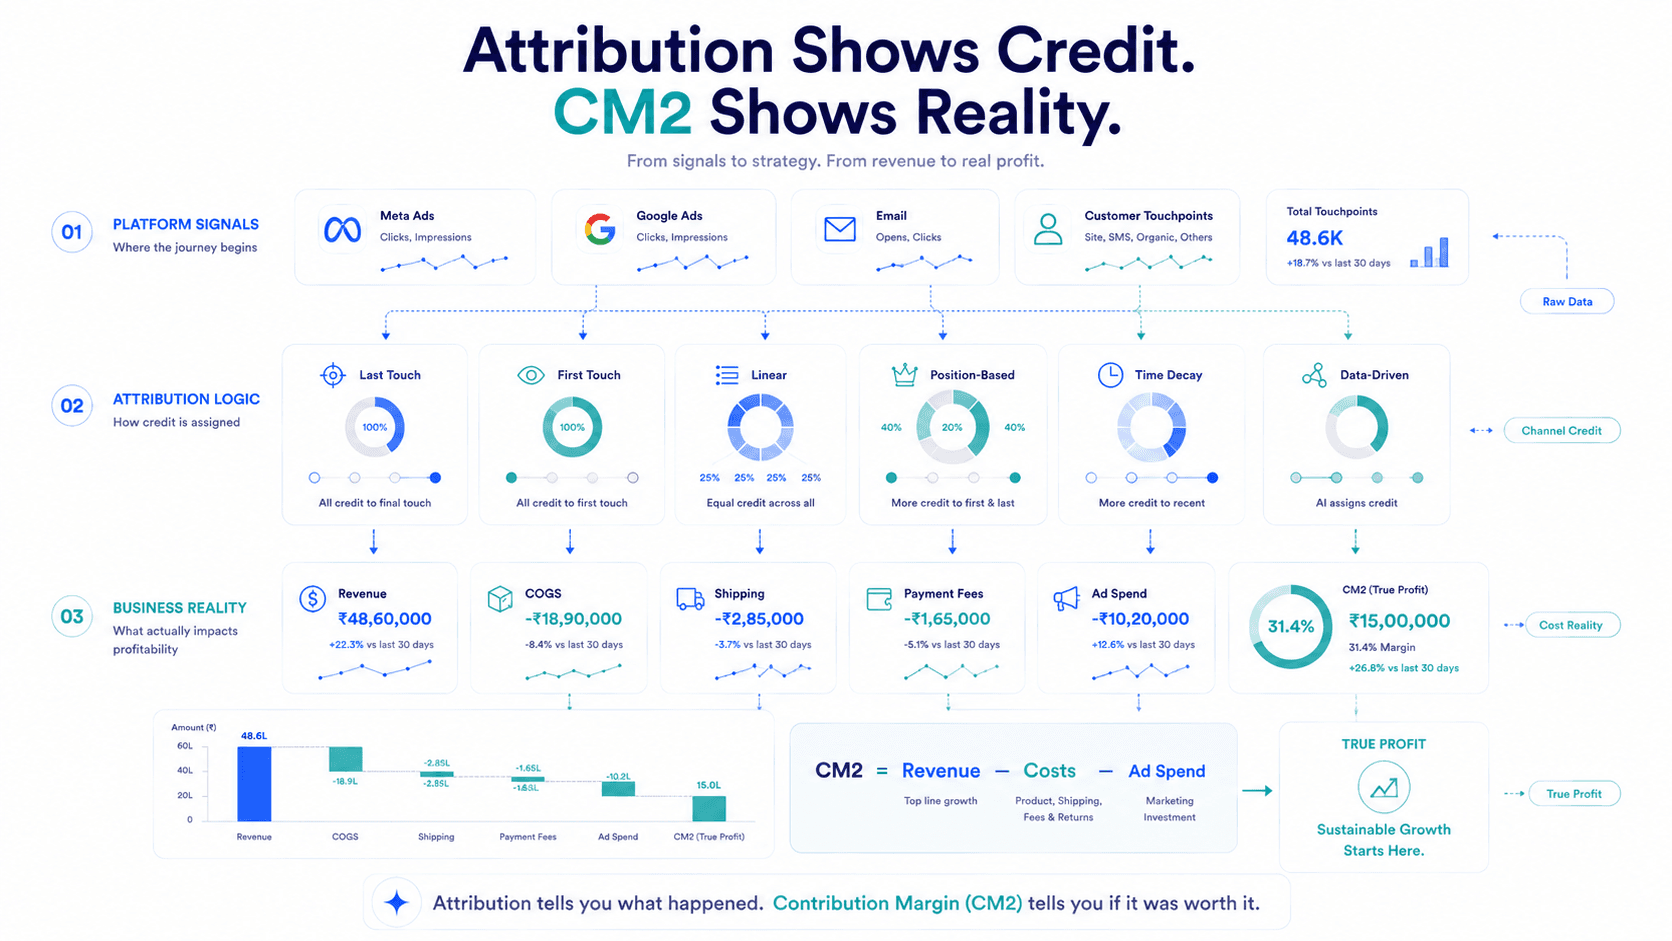
Every model above answers the same narrow question: which touchpoint gets credit for revenue? None of them answer the question that actually determines whether a brand survives: was that revenue profitable after product cost, shipping, payment fees, and the ad spend itself?
A channel can win under every attribution model in this article and still be quietly bleeding the business — if the orders it drives carry high return rates, thin margins, or COD failure costs that never show up in a ROAS number. This is the gap Flable was built to close.
CM2 — Flable's anti-ROAS metric
Contribution Margin 2 (CM2) takes attributed revenue from any of the five models above and strips out the costs ROAS ignores — COGS, shipping, payment gateway fees, and the ad spend itself — to show what's actually left to reinvest or take as profit.
A channel with a 3.5x ROAS and a 20% return rate can carry a negative CM2. A channel with a 1.8x ROAS and premium margins can be your most profitable spend line. Attribution tells you where the credit goes; CM2 tells you whether that credit was worth having.
How to actually use this, step by step
Run last-touch and first-touch side by side, always
Never look at one without the other. The gap between them is your funnel diagnosis — big gap means your top-of-funnel and closing channels are mismatched.
Graduate to position-based, time-decay, or data-driven once you have volume
Single-touch models are a starting point, not an operating model. Once you're past ~100 monthly conversions, position-based, time-decay, or DDA will materially change your budget calls.
Overlay CM2 on every model before reallocating spend
Whatever attribution says a channel "earned," check what it actually contributed after real costs before you scale it.
Re-run the comparison monthly, not once
Attribution weights shift with seasonality, promo cycles, and channel mix. A model you trusted in Q1 can mislead you by Q3.
FAQ
Which attribution model should a small D2C brand start with?
Last-touch, paired with first-touch as a check. Position-based is a reasonable next step since its 40-20-40 split doesn't need much data to apply. Data-driven and time-decay need real conversion volume to be statistically reliable — most brands under ~100 monthly conversions don't have enough data to trust an algorithmic model yet.
Is position-based attribution the same as U-shaped attribution?
Yes — "position-based" and "U-shaped" describe the same fixed 40/20/40 model, named after the shape the credit curve makes when you plot it across a journey. Some platforms also offer a "W-shaped" variant that adds a third fixed credit point at a key middle stage (like a demo request), but Flable's current model runs the standard U-shape.
Is data-driven attribution the "most accurate" model?
It's the most statistically sophisticated of the five, but it's still built entirely from touchpoints your tracking can observe. It won't catch dark social, word-of-mouth, or offline influence — for that you need incrementality testing alongside it, not instead of it.
Why does Flable emphasize CM2 over ROAS across every model?
Because ROAS and attribution both stop at revenue. CM2 is the only number in this stack that reflects what a brand actually keeps after product, shipping, payment, and ad costs — which is the number that determines whether scaling a "winning" channel grows the business or drains it.
See your real channel profitability, not just attributed revenue
Flable runs all five attribution models against your live data and overlays CM2 automatically — so you know which channels are winning and which ones are just well-attributed.