Scaling Framework
Every Monday, the report arrives.
ROAS by campaign. CPA by ad set. Spend vs last week. What went up. What went down. Green arrows and red arrows.
It’s thorough. It’s professional. It’s the output of real work.
And it’s missing the one number that actually tells you if your marketing is making you money.
The metric
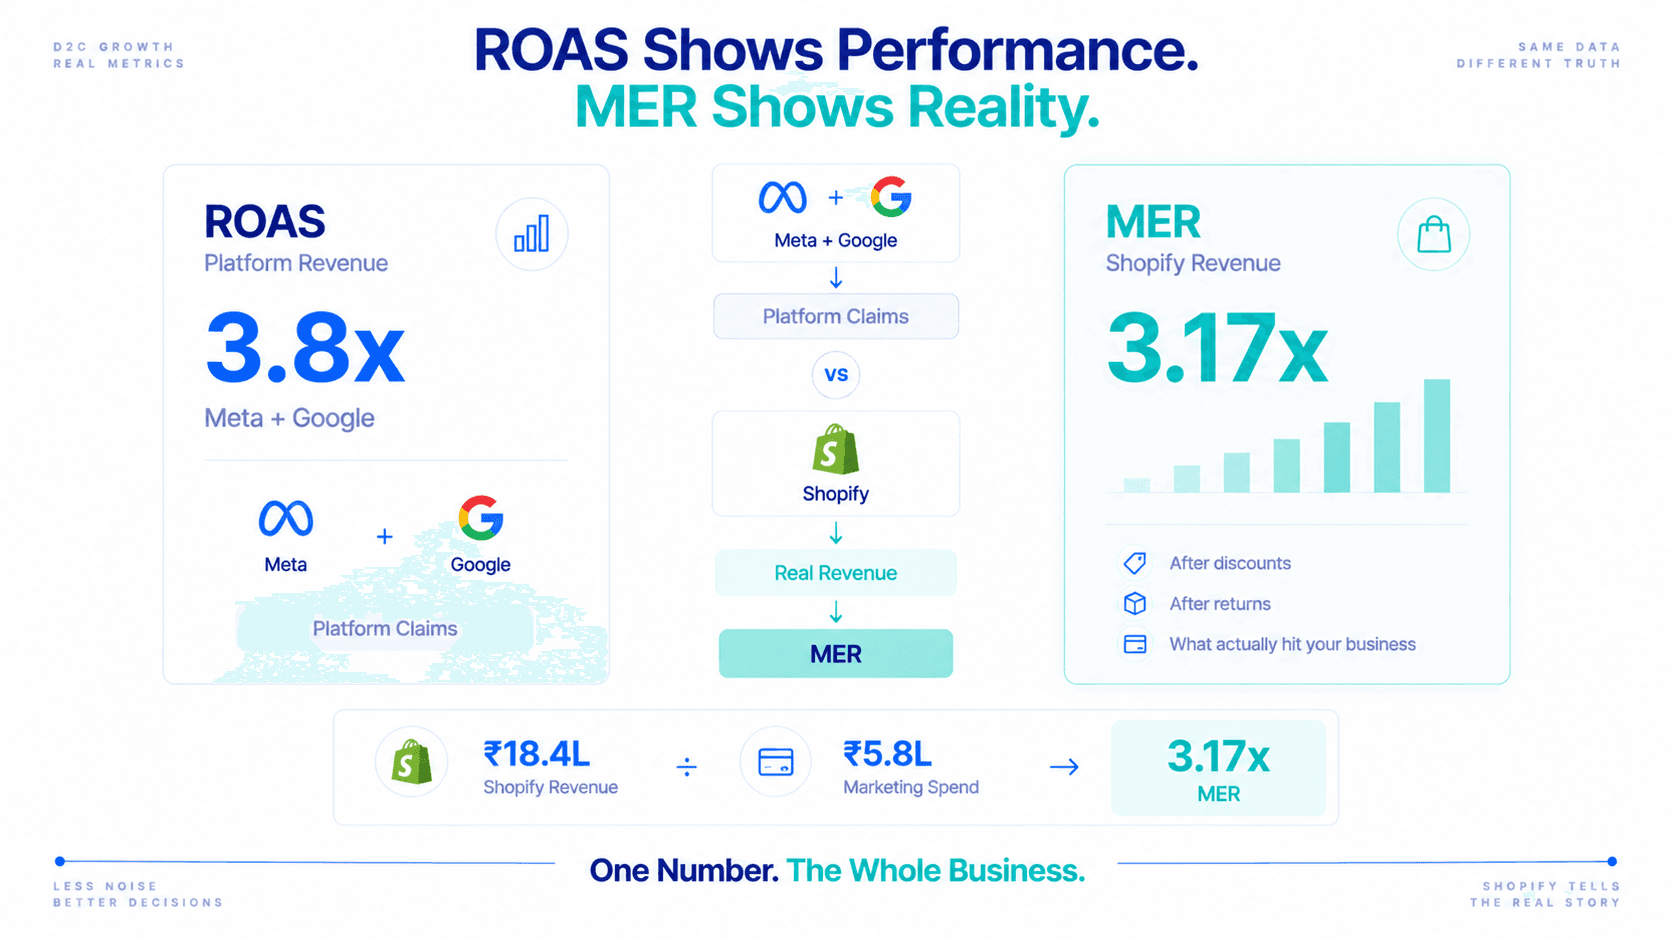
MER = Total Shopify Net Revenue ÷ Total Marketing Spend
Last week
For every rupee you spent on marketing, ₹3.17 came back as real Shopify revenue.
Not platform-attributed revenue. Not Meta’s claimed number. Not Google’s claimed number. Shopify net revenue, after discounts, after refunds, after returns. The number that actually hit your business.
Three reasons. None of them sinister.
MER requires Shopify data, not just platform data.
Meta Ads Manager doesn’t calculate MER. Google Ads doesn’t calculate MER. Your agency works primarily inside these platforms, and MER lives outside them.
MER tells a less flattering story than ROAS.
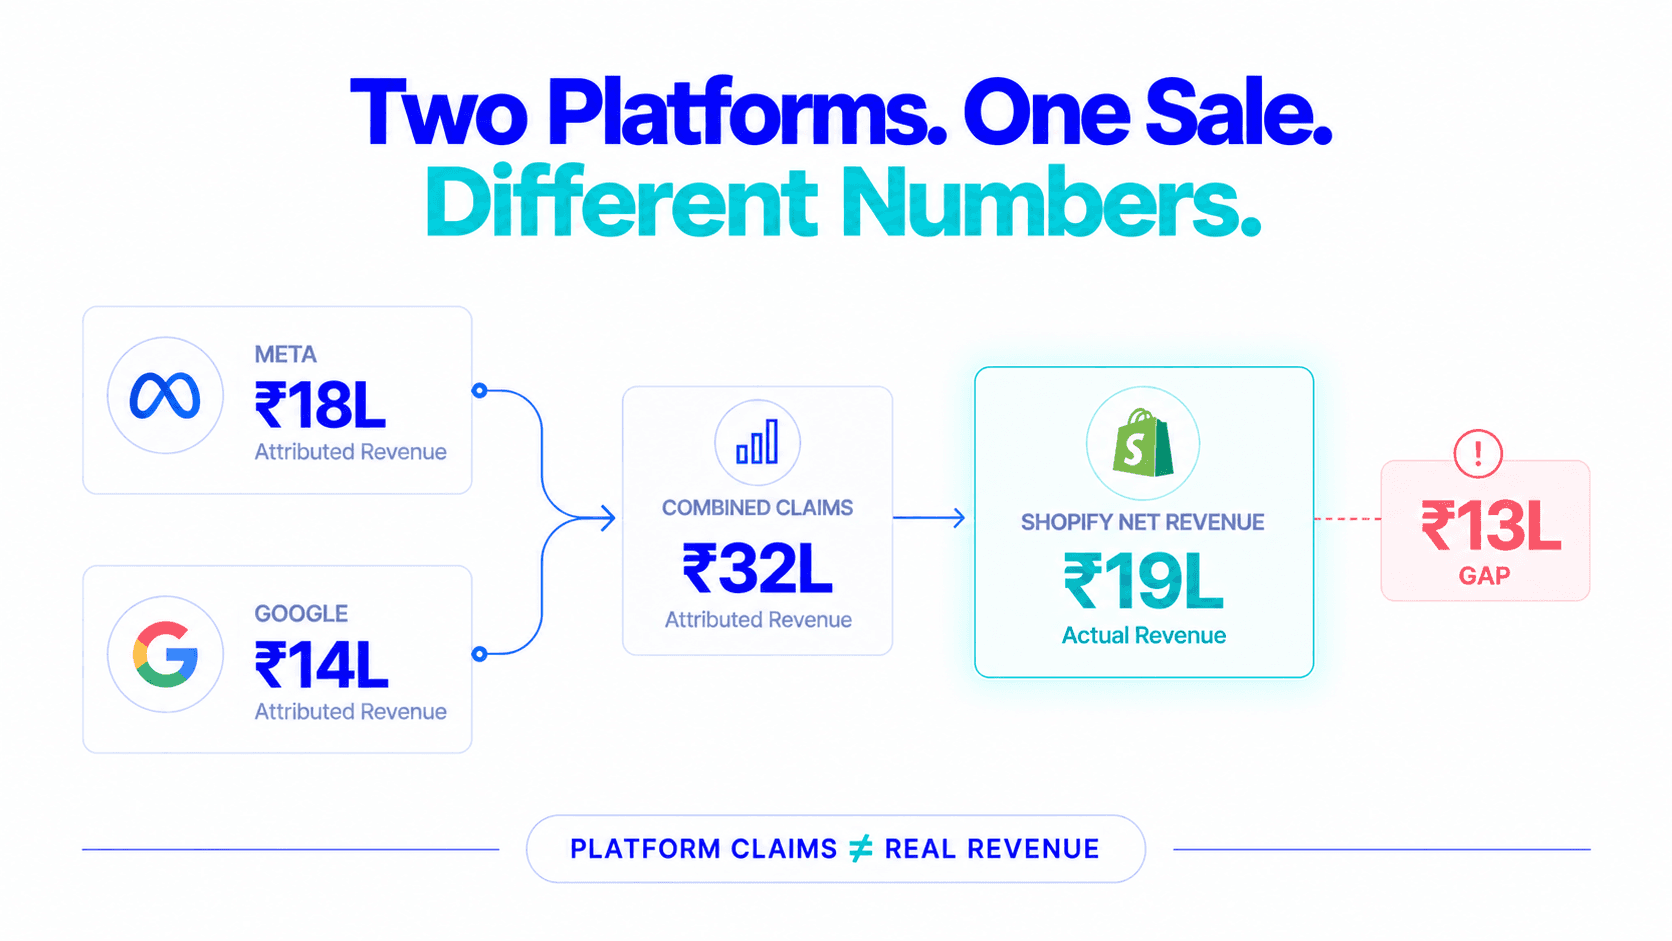
For brands running Meta + Google simultaneously, combined platform-attributed revenue often overstates actual Shopify revenue by 40–80%. Individual platform ROAS looks much stronger than MER. Agencies reasonably report the number that looks better.
MER requires including total marketing spend, not just ad spend.
Agency retainers, influencer fees, creative production costs. These all belong in the denominator. Including them makes MER lower. Excluding them makes individual channel ROAS look more efficient.
None of this is dishonest. But it means the report you receive every Monday is optimised to show platform performance, not business performance.
1
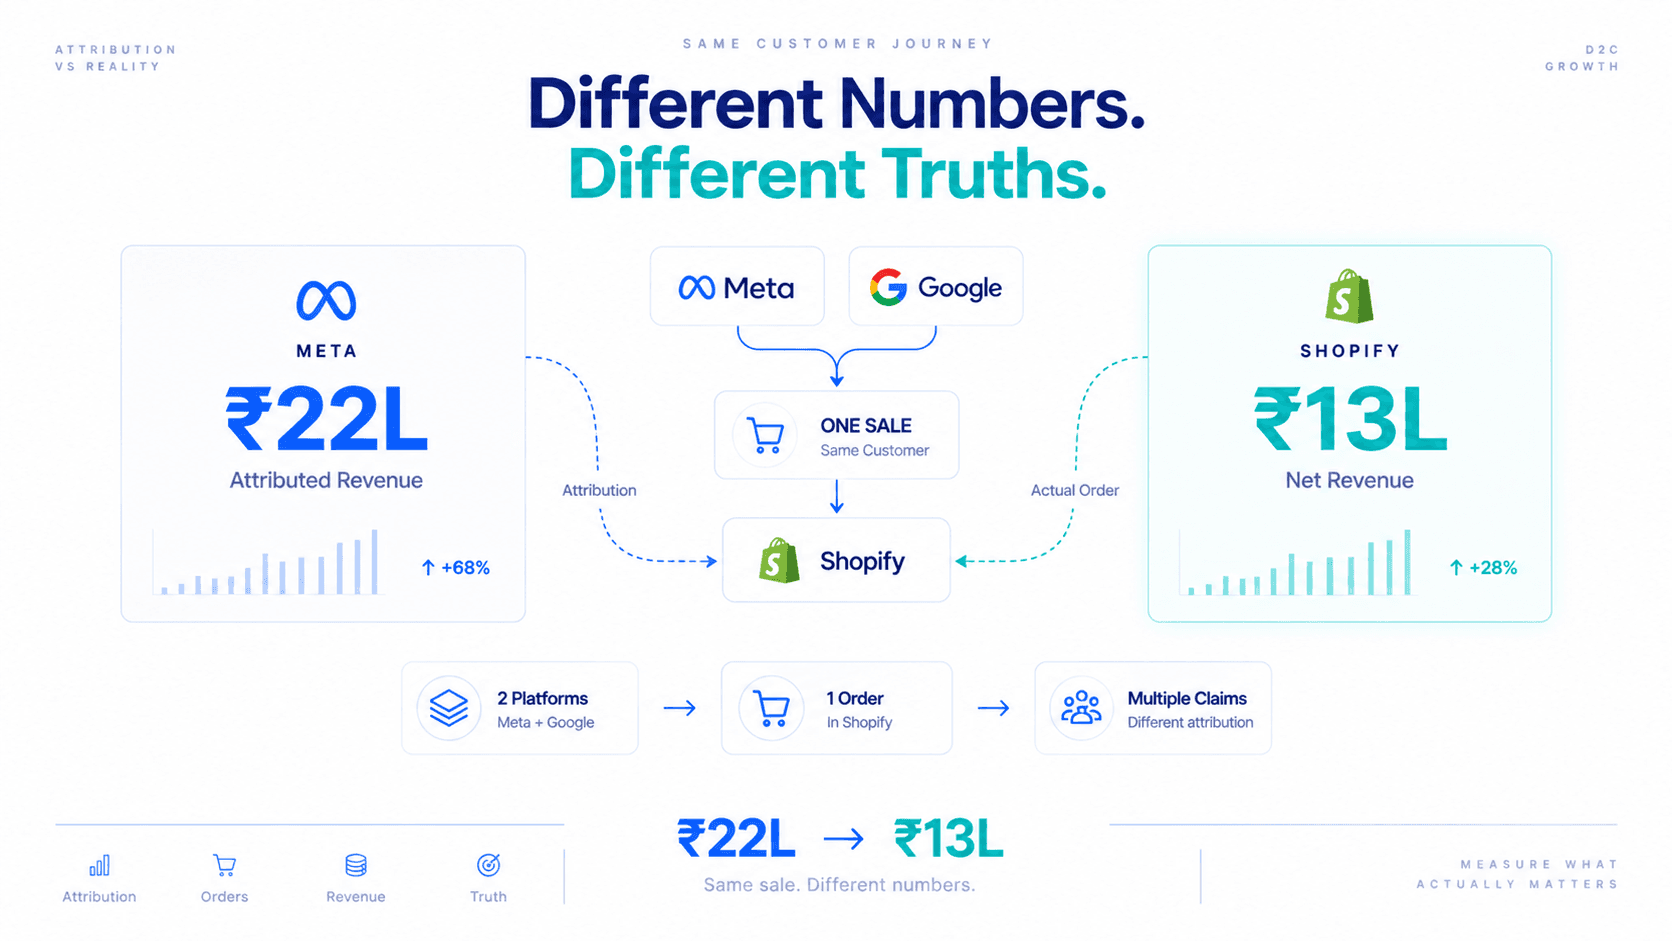
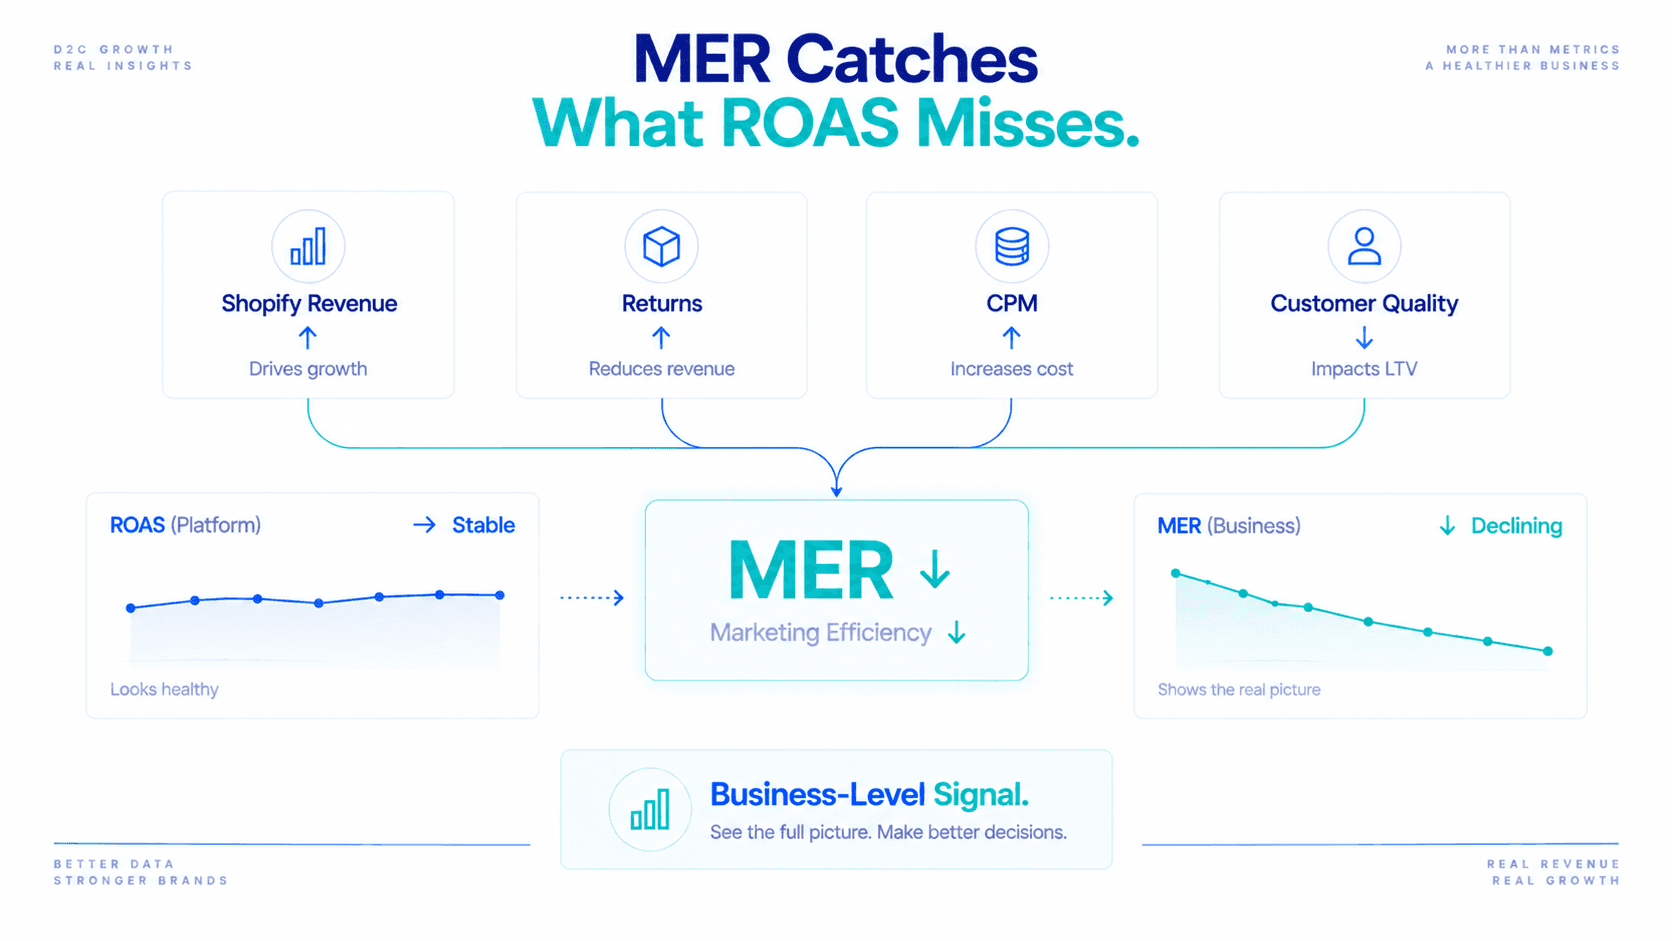
Meta takes credit. Google takes credit. The same sale gets counted by multiple platforms. Individual platform ROAS is inflated by this self-attribution.
MER doesn’t care. It uses a single source of truth, Shopify net revenue, and measures the total marketing investment against it. No platform can inflate their contribution to MER by changing their attribution model.
2
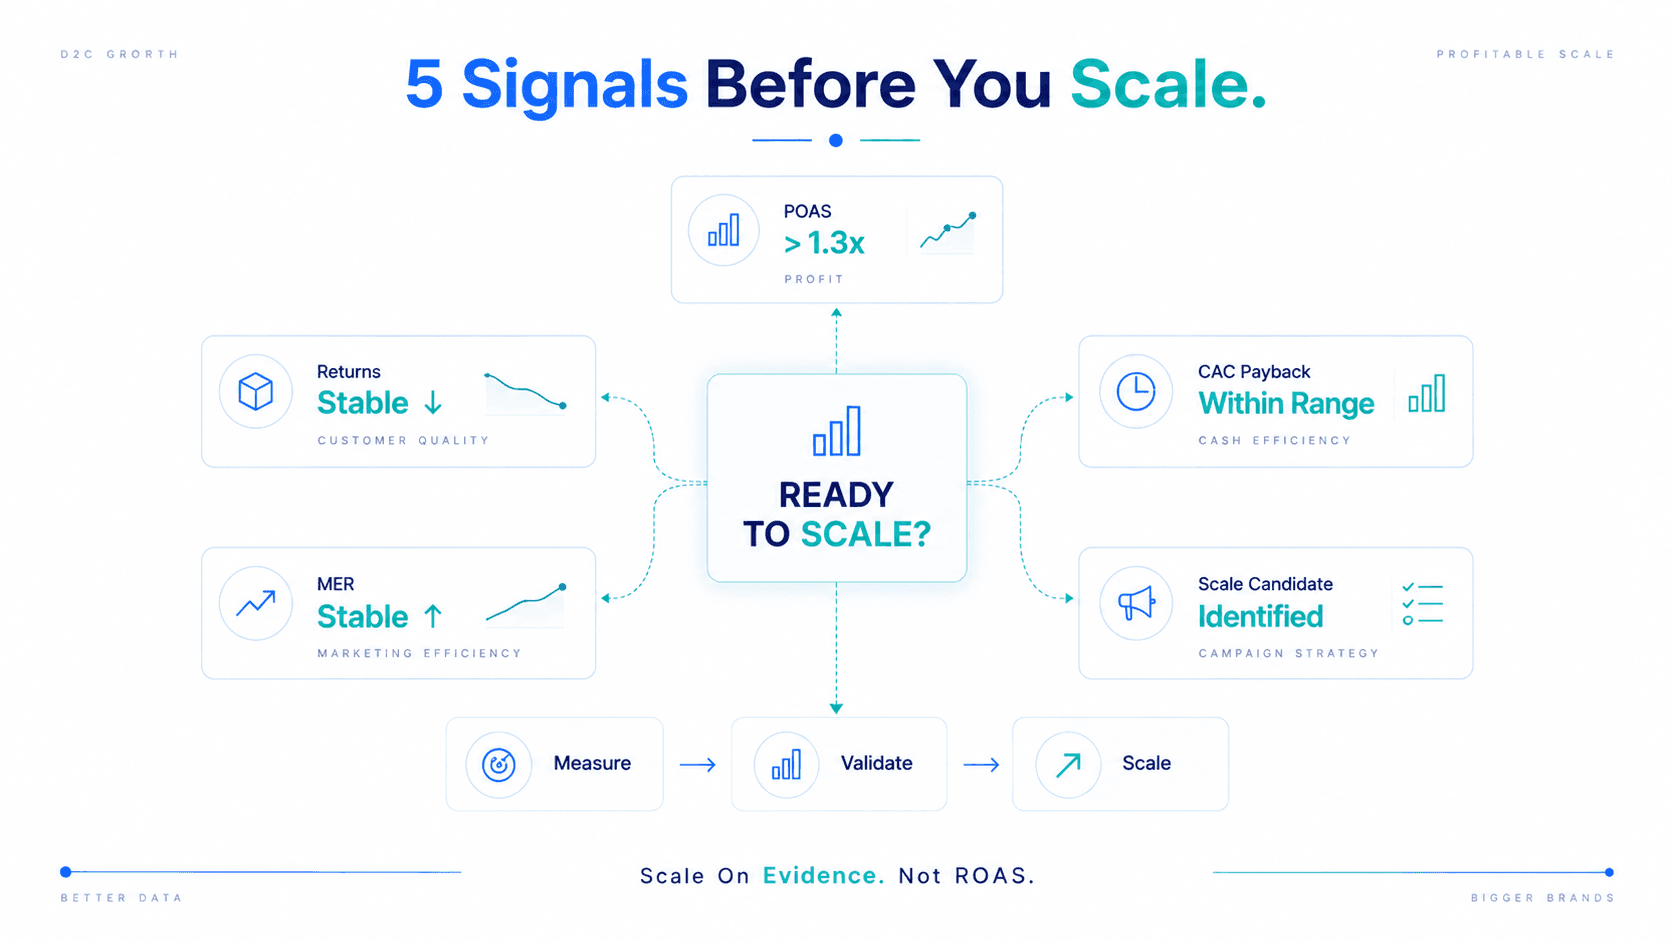
A declining MER, even when individual campaign ROAS is stable, is one of the earliest signals that something in your marketing system is deteriorating. Rising return rates compressing net revenue. CPMs increasing across channels. Customer quality declining.
MER catches these macro shifts 2–4 weeks before they show up clearly in individual campaign metrics. Catching a MER decline early is the difference between a course correction and a crisis.
3
When VCs evaluate a D2C brand’s marketing efficiency, they don’t look at ROAS, they know it’s platform-attributed and therefore unreliable. They look at MER (or equivalent blended efficiency metrics). A brand that can explain its MER, track how it’s changed over time, and connect it to business health tells a more credible story than one that leads with ROAS.
| Stage | Target MER |
|---|---|
| Early (under ₹1Cr MRR) | 3.5–5.0x |
| Growth (₹1–5Cr MRR) | 2.8–4.0x |
| Scaling (₹5Cr+ MRR) | 2.2–3.5x |
MER naturally declines as brands grow, because scaling requires investing in brand-building channels (influencers, awareness campaigns) with longer payback periods that don’t show up quickly in short-window attribution.
Often acceptable
You’re investing in demand creation that pays back over months, not days.
Warning sign
Your marketing is becoming less efficient without a long-term payoff. Investigate immediately.
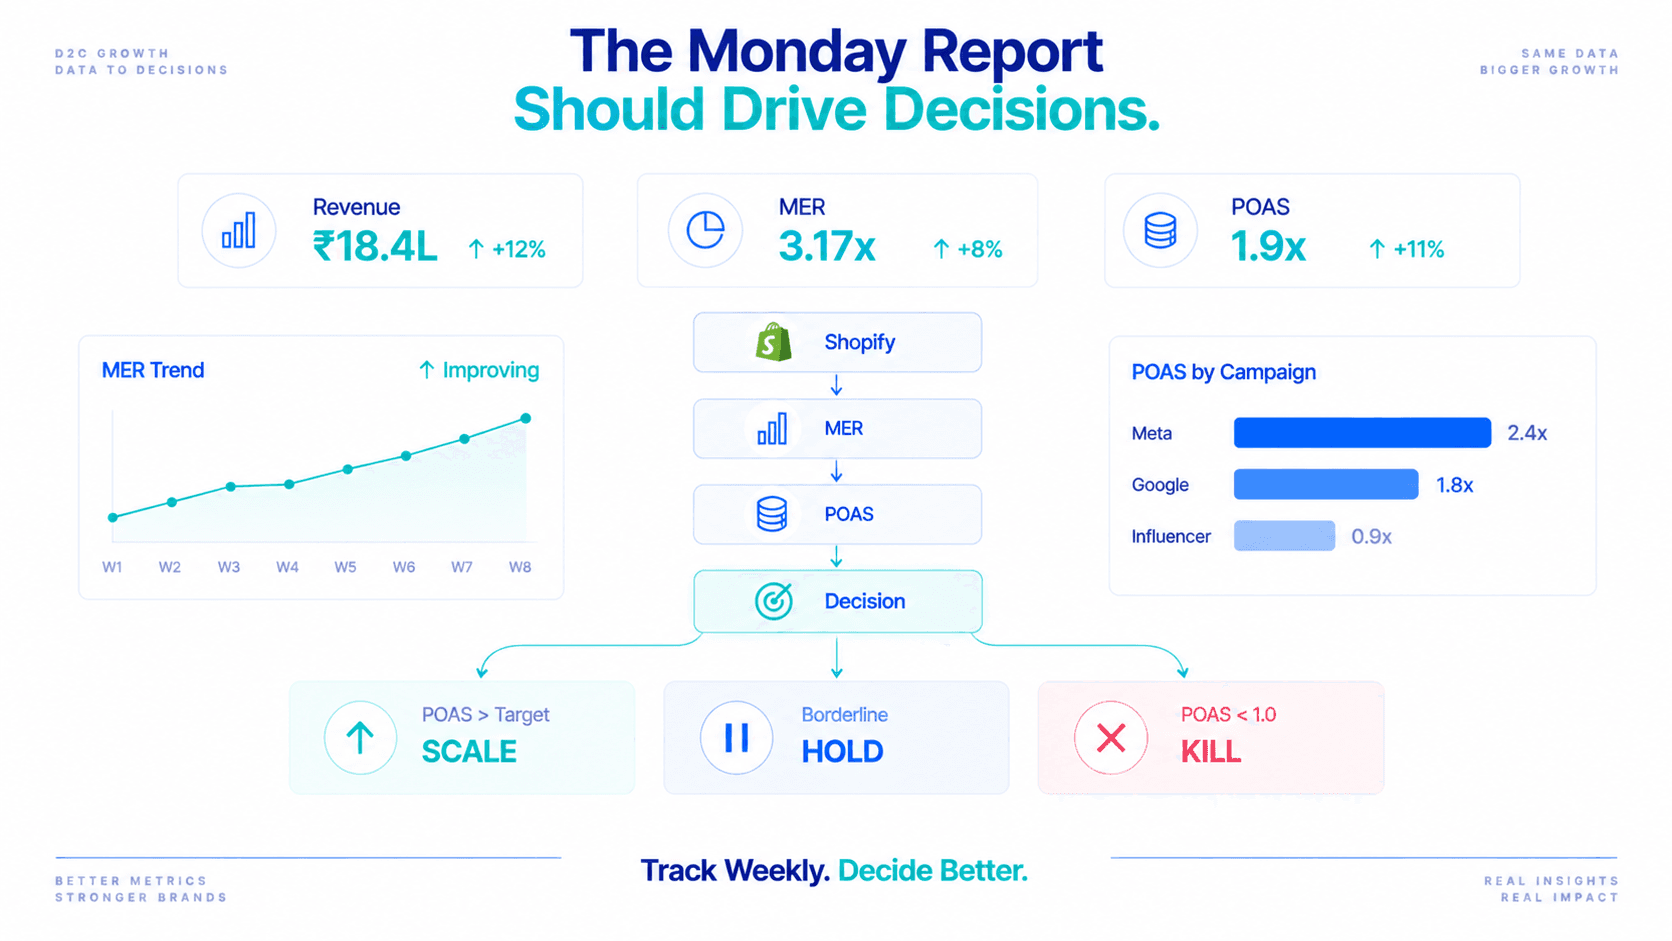
Not instead of ROAS and CPA. Alongside them.
Business-level view
Campaign-level view
Action items
This report takes the same time to produce as the one you get now. It just starts from different data, Shopify and POAS, rather than platform attribution.
Pull Shopify net revenue for last week.
Shopify Analytics → Sales → select the period → Net Sales
Add up all marketing spend for the same week.
Ad spend (Meta + Google) + agency retainer (prorated weekly) + influencer fees paid + creative production costs.
Divide.
MER = Shopify Net Revenue ÷ Total Marketing Spend
Add to a simple spreadsheet. Track weekly.
After 8 weeks of consistent tracking, you’ll see whether your marketing is becoming more or less efficient, regardless of what individual platform dashboards show.
ROAS
The metric your platforms give you because it’s the metric they can calculate.
MER
The metric your business needs because it reflects what actually happened.
You can optimise for both, but you should make decisions on the one that tells the truth.
The most important metric in your marketing never requires logging into an ad platform.
MER (Marketing Efficiency Ratio) = Total Shopify Net Revenue ÷ Total Marketing Spend. With ₹18,40,000 of Shopify net revenue and ₹5,80,000 of total marketing spend (Meta + Google + agency retainer + influencer fees), MER is 3.17x.
Three reasons, none sinister: MER needs Shopify data rather than platform data, it tells a less flattering story than ROAS when Meta and Google overlap, and it puts agency retainers, influencer fees and creative costs in the denominator, which makes it lower.
Early stage (under ₹1Cr MRR): 3.5–5.0x. Growth (₹1–5Cr MRR): 2.8–4.0x. Scaling (₹5Cr+ MRR): 2.2–3.5x. MER naturally declines as brands invest in brand-building channels with longer payback.
No. A declining MER with growing LTV is often acceptable because you're investing in demand creation that pays back over months. A declining MER with flat or declining LTV is the warning sign: investigate immediately.
A business-level view (Shopify net revenue and MER versus the previous 7 days, plus an 8-week MER trend), a campaign-level view (POAS and return rate per campaign, with CPA and ROAS as directional only) and action items to scale, hold or kill based on POAS.
Flable AI calculates MER automatically, using Shopify net revenue as the ground truth, updated in real time.