Attribution
Neither.
They’re both telling the truth, just different truths.
And understanding the gap between them is one of the most important things a D2C founder can do.
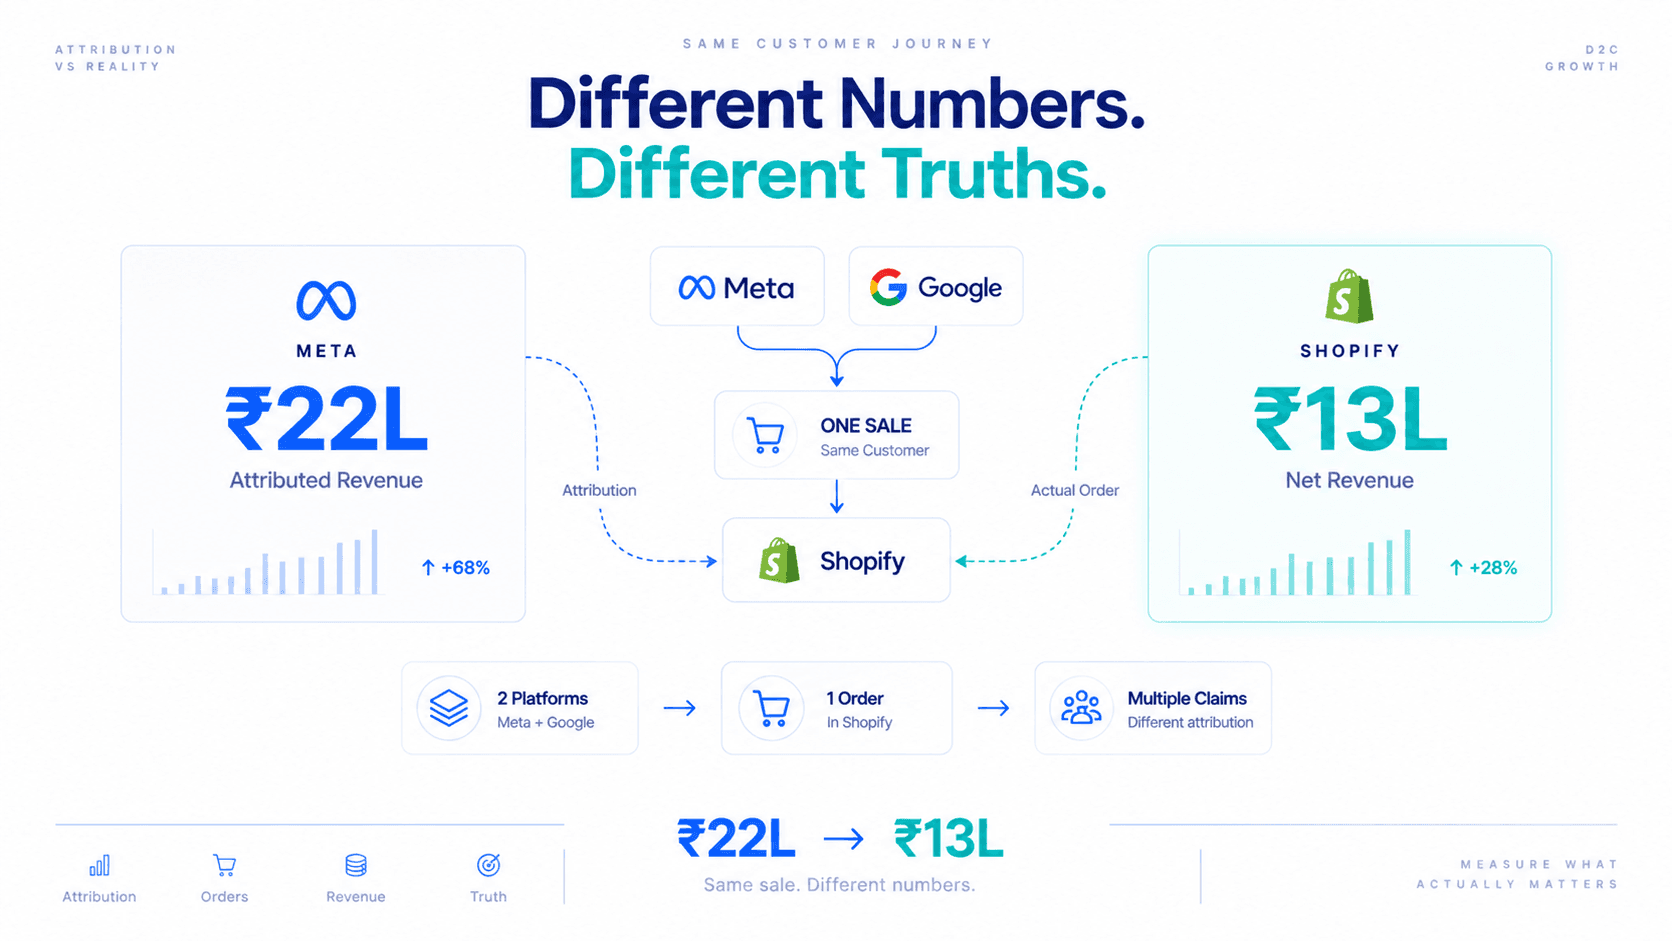
Because if you’re making budget decisions based on Meta’s ₹22L, you’re optimising a business that’s actually doing ₹13L.
Meta Ads Manager
Revenue that Meta credits to your campaigns based on its own rules.
Shopify
Real orders that were placed and paid for, minus refunds and returns.
These are not the same number. They can’t be, because the methods are completely different.
Where the extra revenue comes from
Monday
A customer sees your Meta ad. Doesn’t click.
Thursday
They search for your brand on Google. Click a Shopping ad. Buy.
The reporting
Meta counts this as a view-through conversion. Google counts this as a click conversion. Shopify records one order.
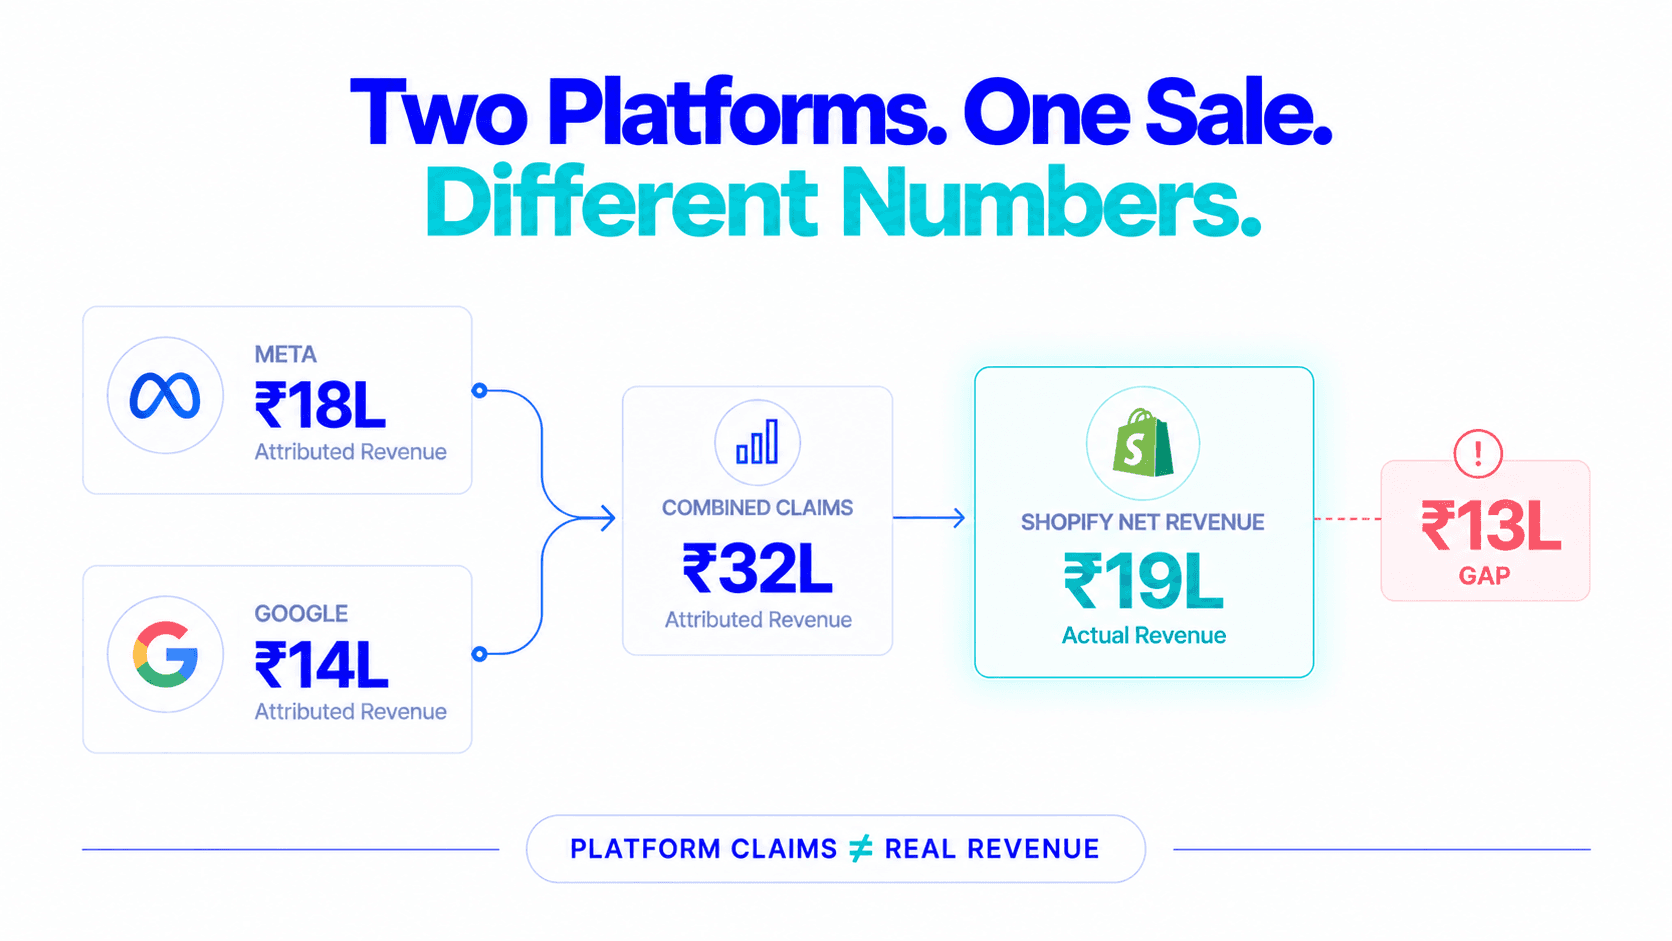
Two platforms. One sale. Both platforms claim it. Your combined ROAS looks excellent. Your actual revenue is half of what’s being attributed.
For brands running Meta + Google simultaneously, this overlap accounts for 30–60% of the gap between combined attributed revenue and real Shopify revenue.
Meta’s default attribution includes 1-day view.
This means: if someone sees your ad, without clicking, and then buys within 24 hours through any channel, Meta takes credit.
Think about how broad that is.
A customer who saw your Meta ad in the morning, later searched for your product on Google, and purchased through a Google Shopping result, counted by Meta as a view-through conversion.
The customer didn’t click the Meta ad. Didn’t visit the site through Meta. Bought through Google. Meta still claims it.
View-through attribution is responsible for a significant portion of the Shopify-Meta gap for most brands, especially those with strong organic search presence.
A customer buys. Meta records the conversion and the revenue. Two weeks later, the customer returns the product.
Shopify
The refund comes off net revenue.
Meta
The conversion and its revenue stay in Ads Manager.
For a fashion brand with 20% returns, ₹20 of every ₹100 in Meta-attributed revenue eventually disappears from Shopify. Meta never adjusts. The gap widens silently every week.
| Platform | Default attribution window |
|---|---|
| Meta | 7-day click, 1-day view |
| 30-day click |
When a customer buys 8 days after clicking a Meta ad, Meta misses it (outside 7-day window). But that purchase still shows up in Shopify.
Conversely, customers who clicked a Google ad 25 days ago still show up in Google’s 30-day window. A single purchase might fall in both platforms’ windows under different timing scenarios.
Different windows, different rules, same customer, multiple attributions, one order.
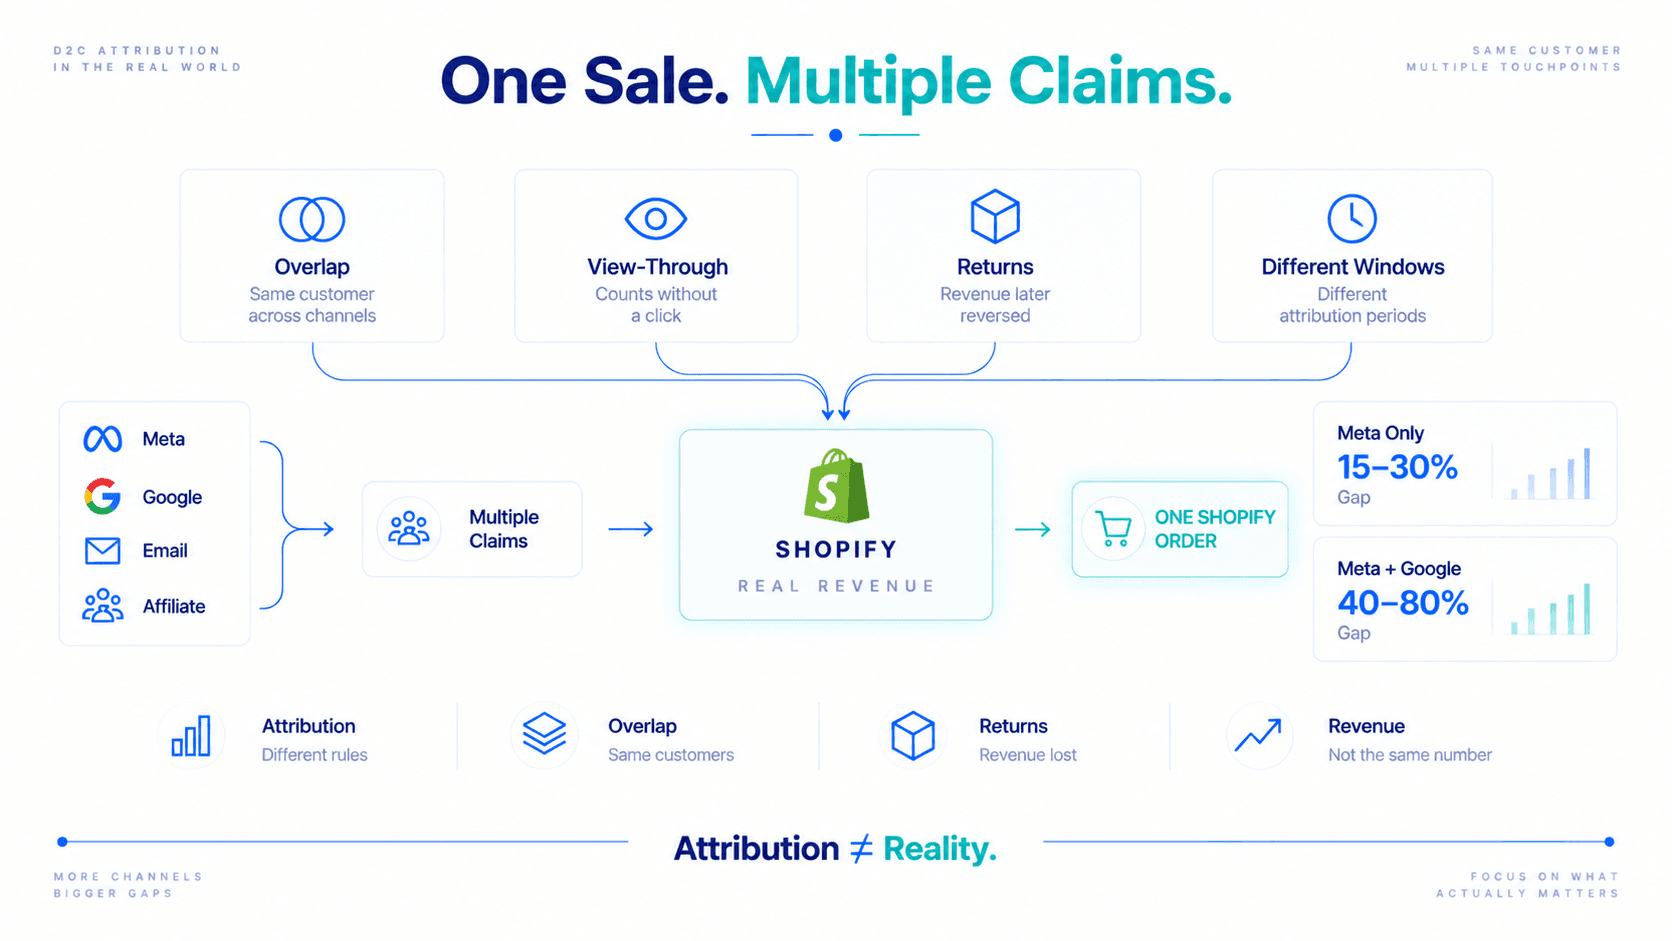
In our experience auditing Indian D2C brands:
15–30%
Mostly view-through attribution and returns
40–80%
Combined attributed vs Shopify net revenue
100%+
Platforms claim 2x what Shopify recorded
This is not unusual. It’s the structural reality of multi-channel attribution.
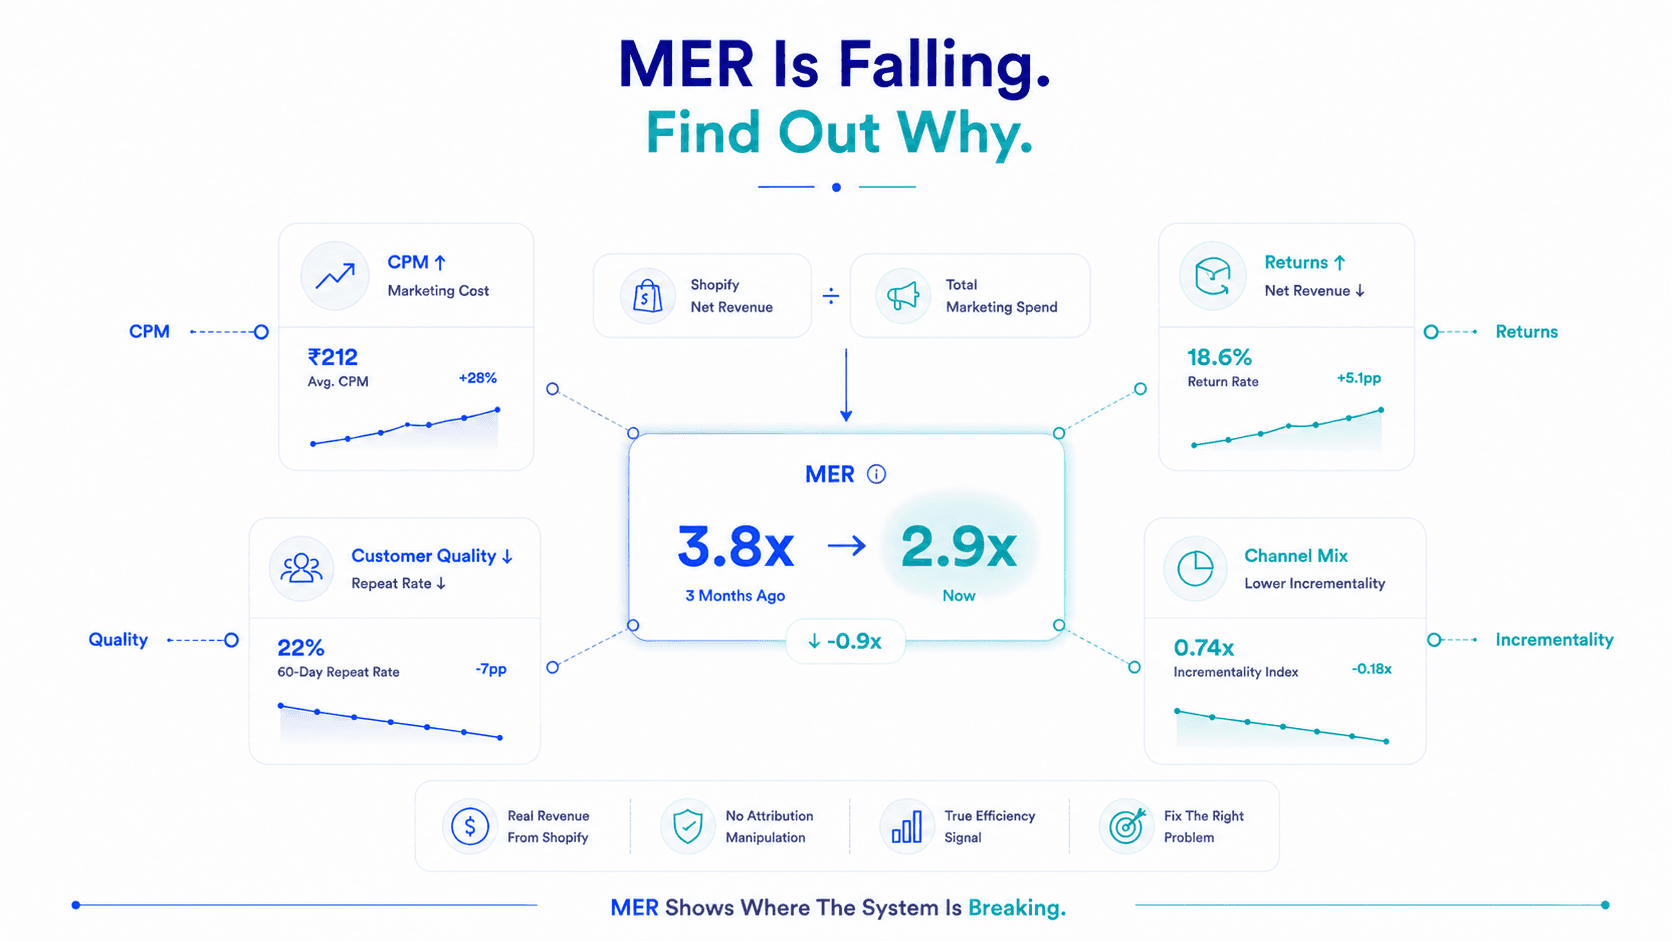
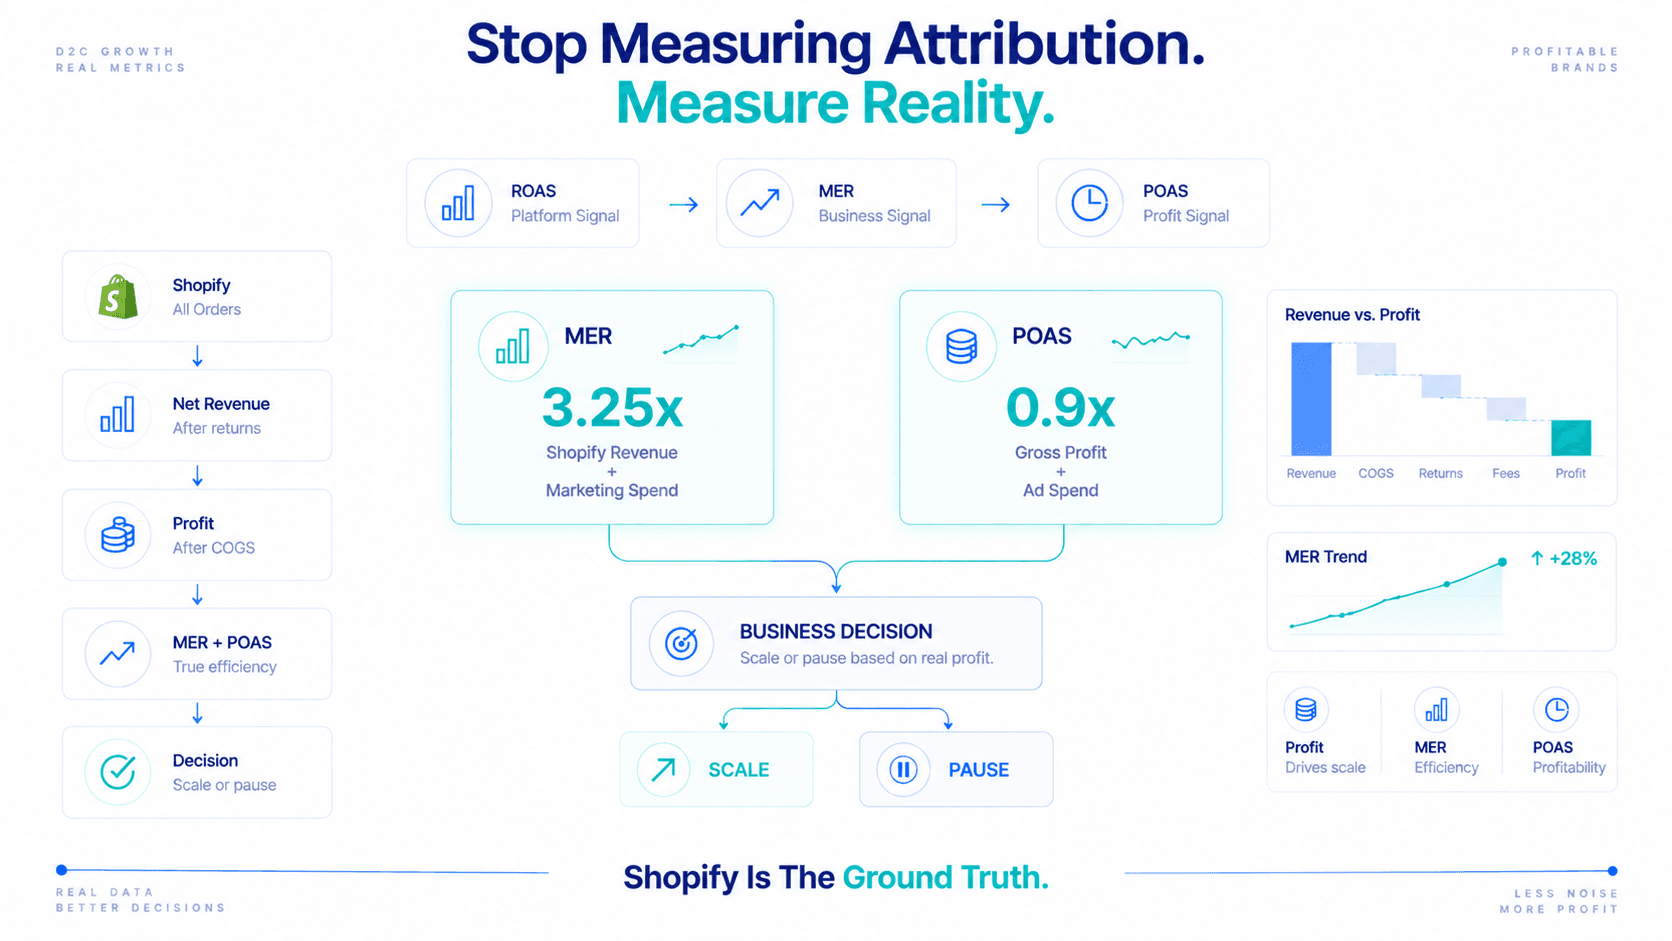
MER (Marketing Efficiency Ratio)
MER = Shopify Net Revenue ÷ Total Marketing Spend
A brand with ₹13L in Shopify net revenue and ₹4L in total marketing spend has a MER of 3.25x.
Doesn’t matter that Meta claims ₹22L and Google claims ₹14L. MER says 3.25x. That’s the truth.
Track MER weekly. If it’s declining, marketing efficiency is eroding, regardless of what individual platform ROAS shows.
POAS (Profit on Ad Spend)
POAS = Gross Profit ÷ Ad Spend
A campaign that shows 4.2x ROAS might have a POAS of 0.9x when calculated against real net revenue. That’s the number that tells you whether to scale.
Calculate your Attribution Inflation Ratio.
Add up all platform-attributed revenue for last month (Meta + Google + everything else). Divide by Shopify net revenue.
If the ratio is above 1.5x, your attribution inflation is significant enough to make individual platform ROAS meaningless for cross-channel comparison.
Switch to MER for cross-channel efficiency monitoring.
Stop comparing Meta ROAS to Google ROAS. Start tracking MER weekly as your single aggregate efficiency metric.
Use POAS for campaign-level decisions.
Calculate from Shopify-sourced revenue, not from Meta’s attributed figure. This requires connecting your Shopify data to your campaign data, either manually or through a tool built to do this.
Accept that the gap will always exist.
You won’t close it completely. Multi-touch customer journeys mean some attribution overlap is inevitable. The goal isn’t a perfect number, it’s an honest one.
MER and POAS are honest. Individual platform ROAS, on its own, is not.
Stop asking
A platform’s view of its own contribution.
Start asking
The business’s view of all marketing together.
Because MER answers the question that actually matters:
For every rupee we spent on marketing, how much revenue came back to our Shopify store?
That’s the business question. And it has nothing to do with what Meta attributes.
Use the number that reflects reality. Build the business on that.
Four reasons: cross-channel double counting (Meta and Google both claim the same order), aggressive 1-day view-through attribution, returns that never update Meta's reporting, and different attribution windows across platforms.
In audits of Indian D2C brands: 15–30% for Meta-only brands, 40–80% for Meta + Google, and sometimes over 100% for Meta + Google + Email + Affiliate, where platforms collectively claim 2x what Shopify recorded.
Total platform-attributed revenue for a month (Meta + Google + everything else) divided by Shopify net revenue. Above 1.5x, attribution inflation is large enough to make individual platform ROAS meaningless for cross-channel comparison.
Use MER (Shopify Net Revenue ÷ Total Marketing Spend) for cross-channel efficiency, tracked weekly, and POAS (Gross Profit ÷ Ad Spend, calculated from Shopify-sourced revenue after returns) for campaign-level decisions.
No. Multi-touch customer journeys make some attribution overlap inevitable. The goal isn't a perfect number, it's an honest one, and MER and POAS are honest where individual platform ROAS is not.
Flable AI calculates MER and POAS automatically, using Shopify net revenue as the ground truth, not platform-attributed figures.