Attribution
Your Meta campaign says it drove ₹18L in revenue last month. Your Google campaign says it drove ₹14L. Your Shopify says total net revenue was ₹19L.
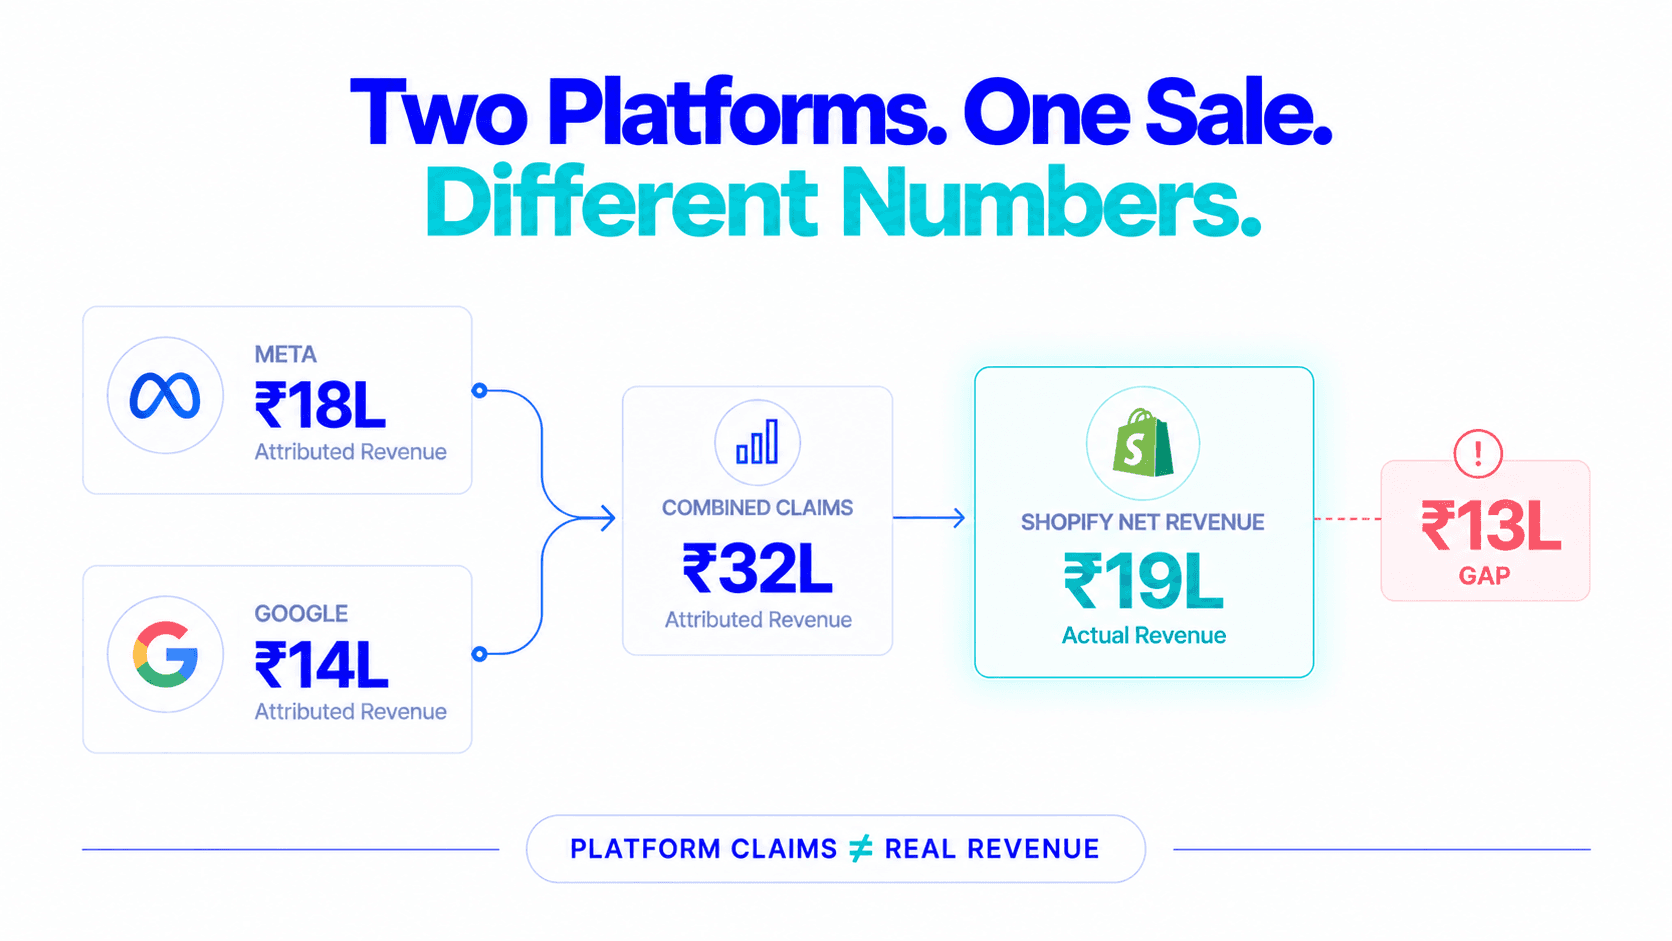
That ₹13L gap is attribution inflation, and it exists entirely because each platform is using its own attribution model to decide how much credit it deserves for each sale.
Understanding how attribution models work doesn’t just explain the gap. It tells you which channels are genuinely driving growth versus which are claiming credit for growth that was happening anyway.
Attribution modeling is the process of assigning credit for a conversion (sale, lead, or other target action) to the marketing touchpoints that preceded it.
A customer’s journey to purchase typically involves multiple touchpoints. They might:
See a Meta Reel from your brand
Click a Google Shopping ad 3 days later
Receive an email with a discount code
Visit your site directly and purchase
Which of those touchpoints gets credit for the sale? That’s what attribution models decide, and different models give completely different answers to the same customer journey.
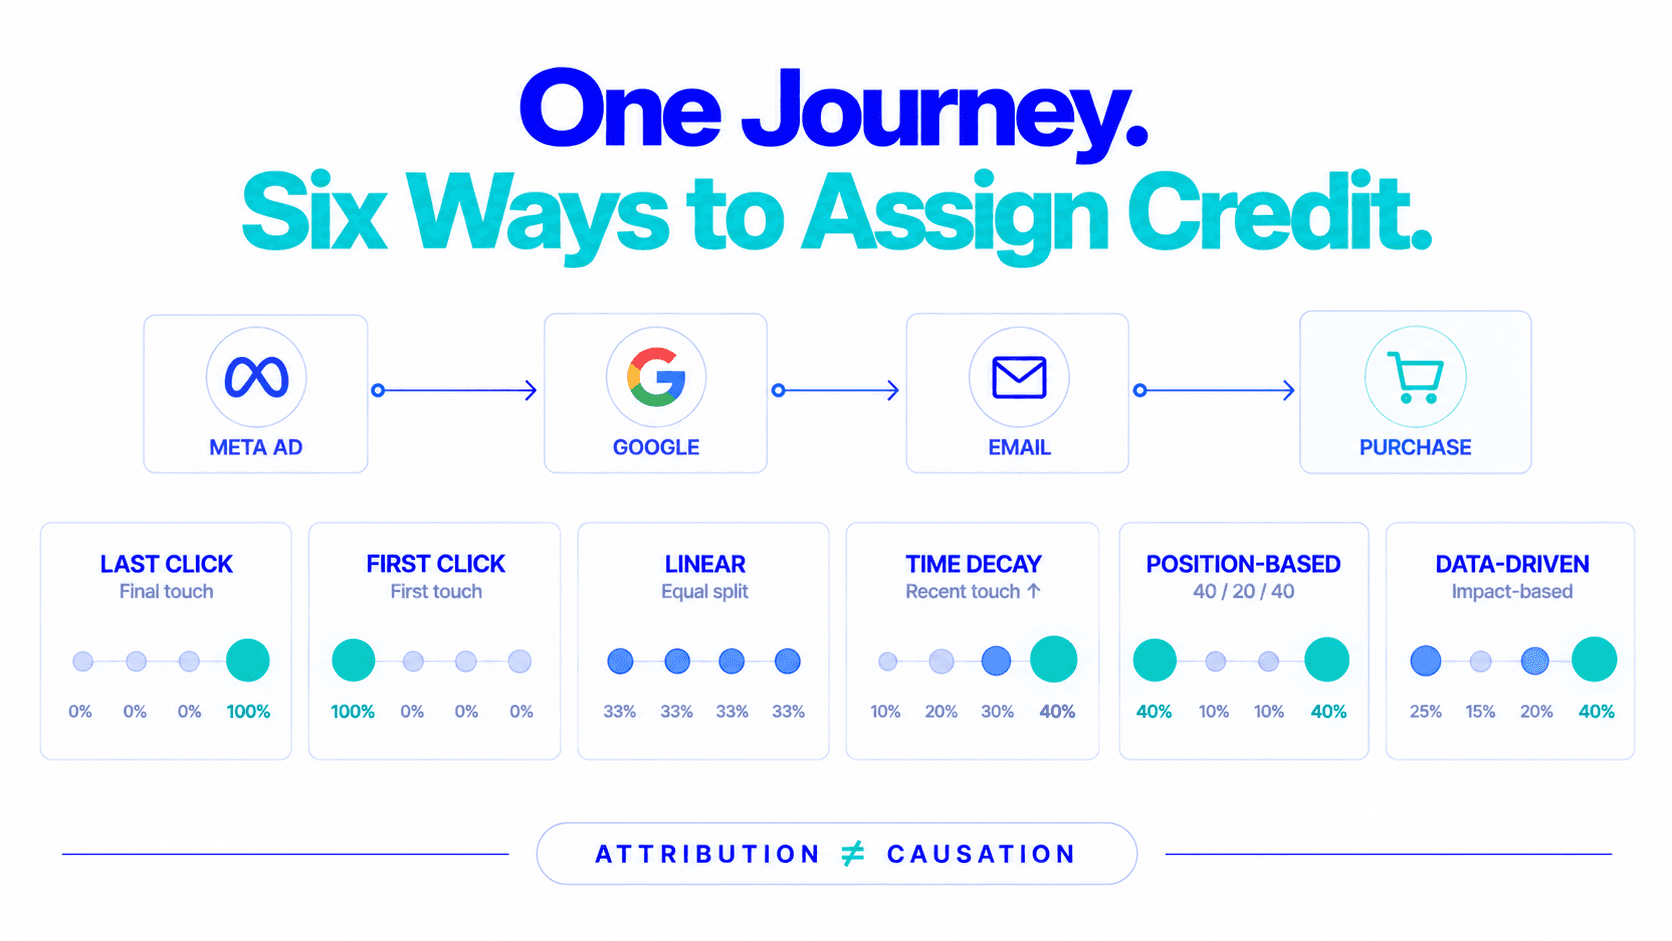
Six ways to split the credit
Model 1
How it works: 100% of conversion credit goes to the last touchpoint before purchase.
In the example above: Direct visit gets all the credit. Meta and Google get zero.
Model 2
How it works: 100% of credit to the first touchpoint in the journey.
In the example above: Meta Reel gets all the credit.
Model 3
How it works: Equal credit distributed across all touchpoints. If there were 3 touchpoints, each gets 33.3%.
In the example above: Meta, Google, and email each get one-third.
Model 4
How it works: Touchpoints closer to conversion receive exponentially more credit than earlier touchpoints. The final touchpoint before purchase gets the most credit; the first touchpoint gets the least.
In the example above: Direct visit gets most credit, email gets the second most, Meta and Google split the remainder.
Model 5
How it works: 40% credit to first touch, 40% to last touch, remaining 20% distributed evenly across middle touchpoints.
In the example above: Meta gets 40%, direct visit gets 40%, Google and email split the remaining 20%.
Model 6
How it works: Uses machine learning to assign credit based on actual impact, comparing the conversion rates of customer paths that included a specific touchpoint versus those that didn’t.
In the example above: Credit is assigned proportionally based on what the model calculates each touchpoint actually contributed to the probability of conversion.
The most practical implication of attribution modeling for D2C brands: why your combined platform-attributed revenue doesn’t match Shopify.
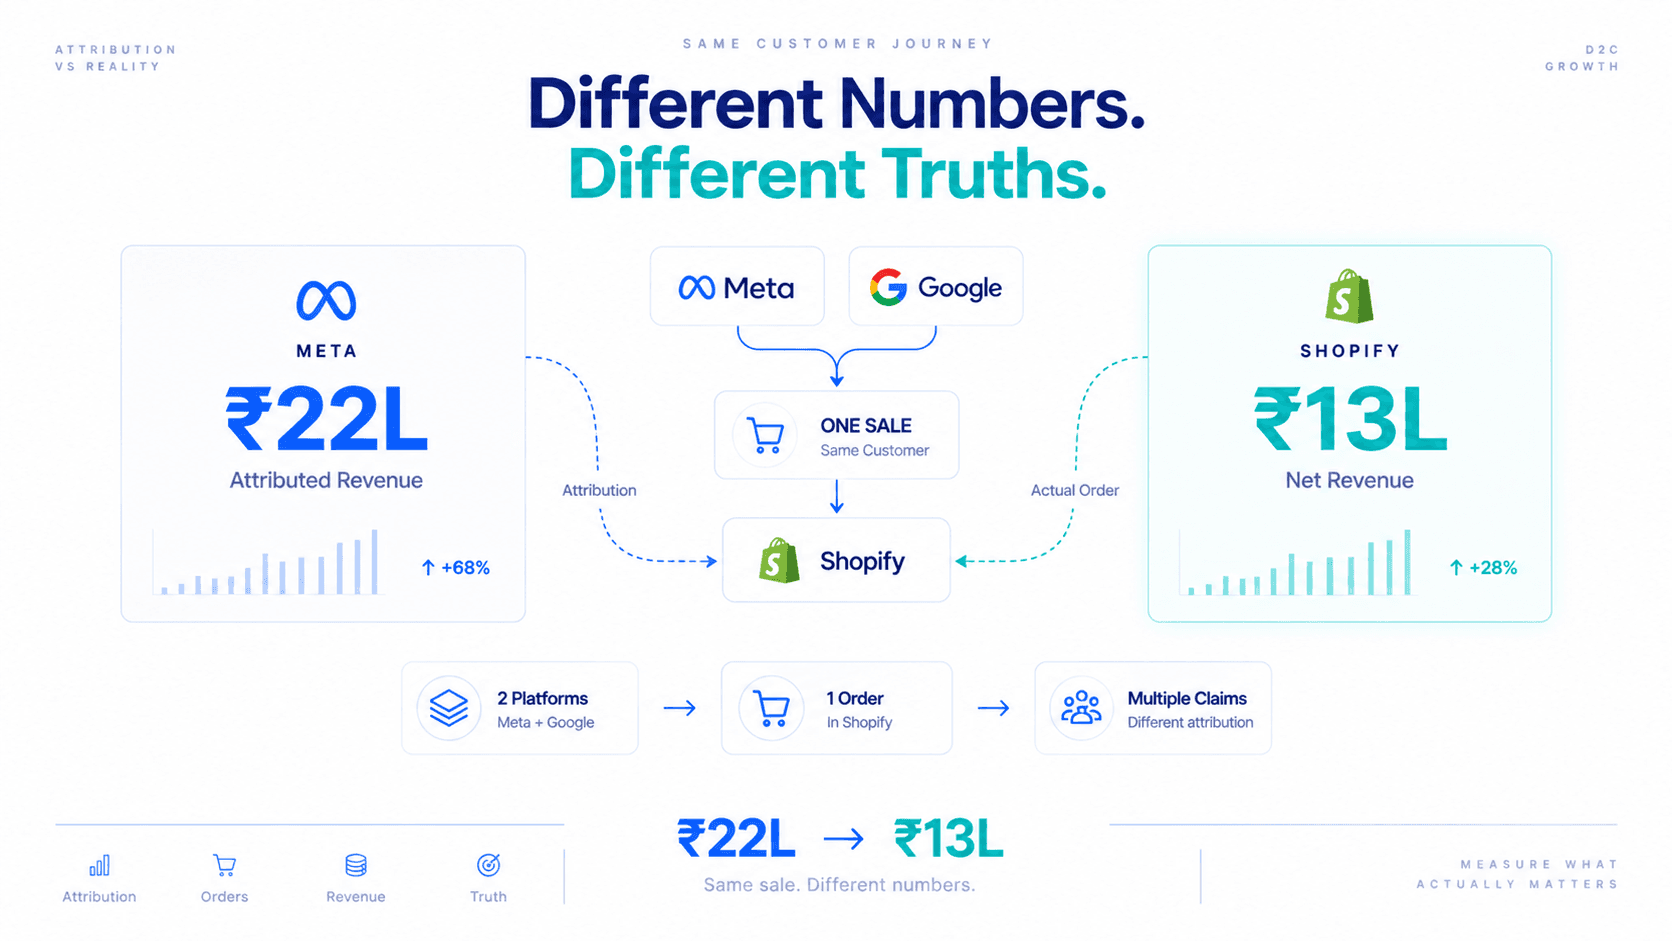
The problem: Each platform applies its own attribution model to the same customer journey. A customer who touched both Meta and Google before purchasing gets counted by both.
Meta default
If the customer clicked a Meta ad anytime in the 7 days before purchase, or even just saw it in the 24 hours before, Meta attributes the conversion.
Google default
If the customer clicked any Google ad in the 30 days before purchase, Google attributes the conversion.
For the same purchase, both platforms can simultaneously attribute full conversion value, creating the 30–80% combined attribution inflation that separates platform-claimed revenue from real Shopify net revenue.
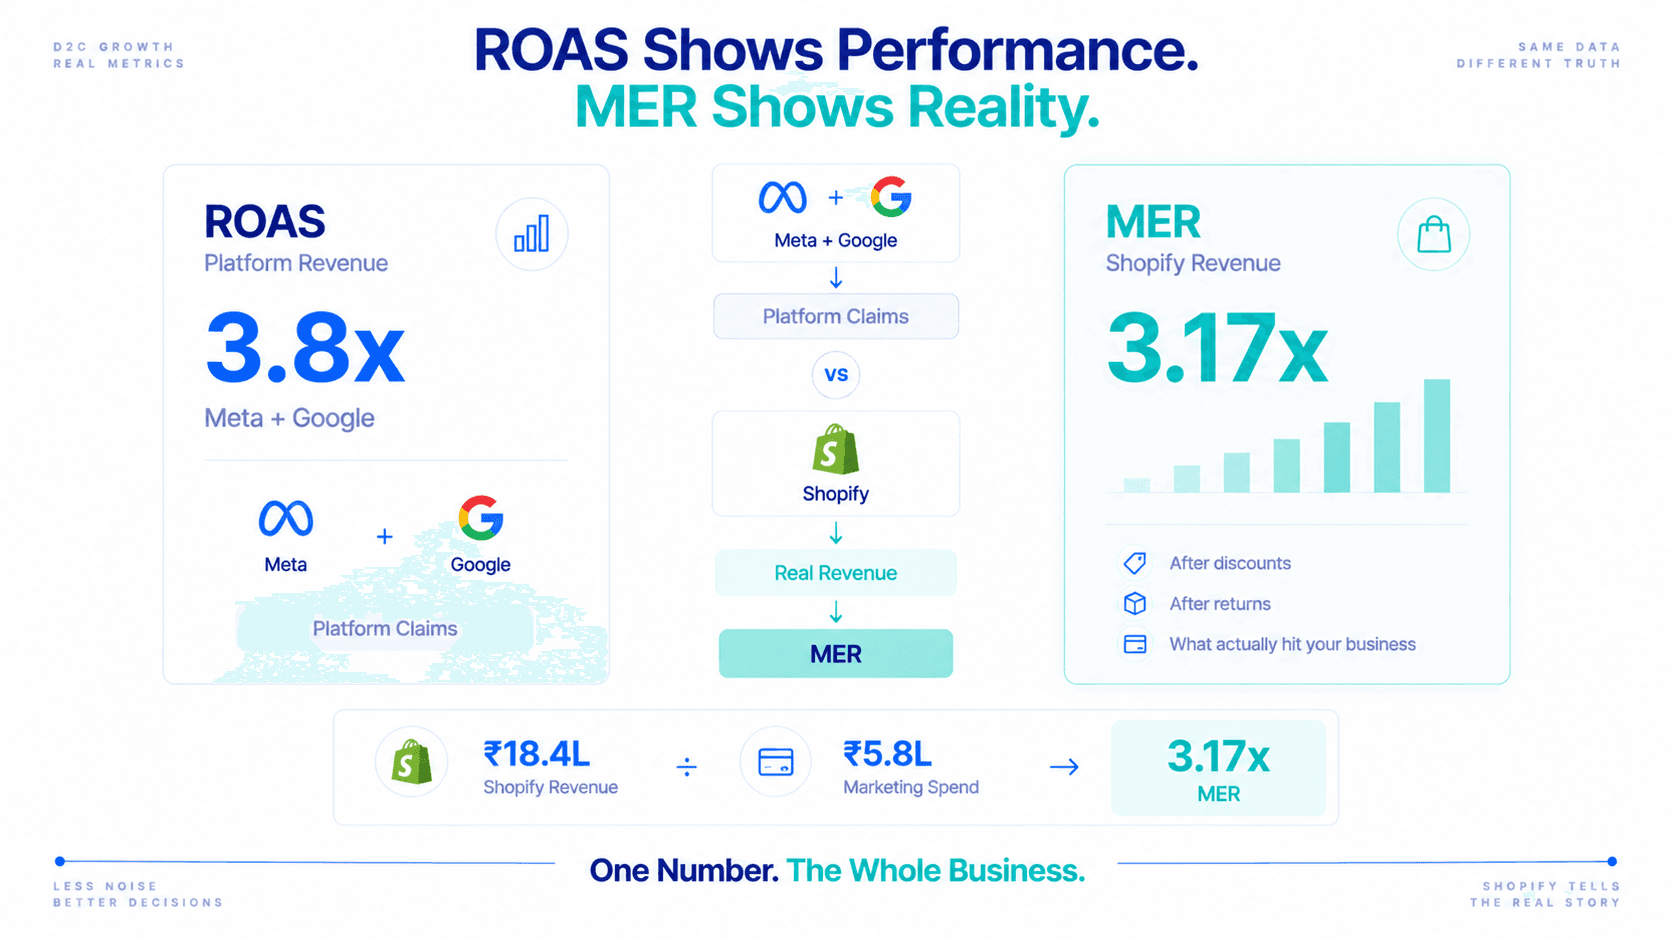
Use a platform-independent metric as your aggregate efficiency benchmark. MER (Total Shopify Net Revenue ÷ Total Marketing Spend) ignores all attribution models and gives you the real relationship between marketing spend and real revenue.
Attribution modeling answers
Correlation along the journey.
Incrementality testing answers
Causation, measured by holding a channel out.
These are different questions.
A customer who sees a Meta ad, then purchases 6 days later through branded Google Search, Meta gets attribution credit. But would they have bought anyway through Google Search even without seeing the Meta ad? If yes, Meta’s attributed credit overstates its actual incremental value.
Incrementality testing (pausing a channel for 2 weeks and measuring the revenue impact) gives you the answer attribution models cannot: does this channel generate genuinely new demand, or does it mostly capture demand created by other channels or organic intent?
For most Indian D2C brands:
| Channel | True incrementality | Why |
|---|---|---|
| Google Brand Search | 30–60% | Captures a lot of organic intent |
| Meta prospecting | 60–80% | Higher, drives genuinely new awareness |
| Email retargeting | 40–65% | Mixed, some organic repurchases, some genuine influence |
Run incrementality tests quarterly on your highest-spend channels. The results will likely change your budget allocation significantly.
The honest answer: none of them perfectly.
Each model is a simplification of a complex multi-touch reality. None of them can perfectly isolate how much each touchpoint actually caused the conversion.
The practical framework:
Campaign-level optimisation
Use platform-native attribution (Meta 7-day click, Google last-click) consistently. Don’t change attribution settings frequently, the goal is a stable, consistent signal for the algorithm, not perfect accuracy.
Cross-channel budget allocation
Ignore individual channel ROAS numbers for allocation decisions. MER is the only metric that doesn’t depend on any attribution model.
Strategic channel assessment
Quarterly holdout tests on your highest-spend channels tell you more about real channel value than any attribution model.
Campaign profitability
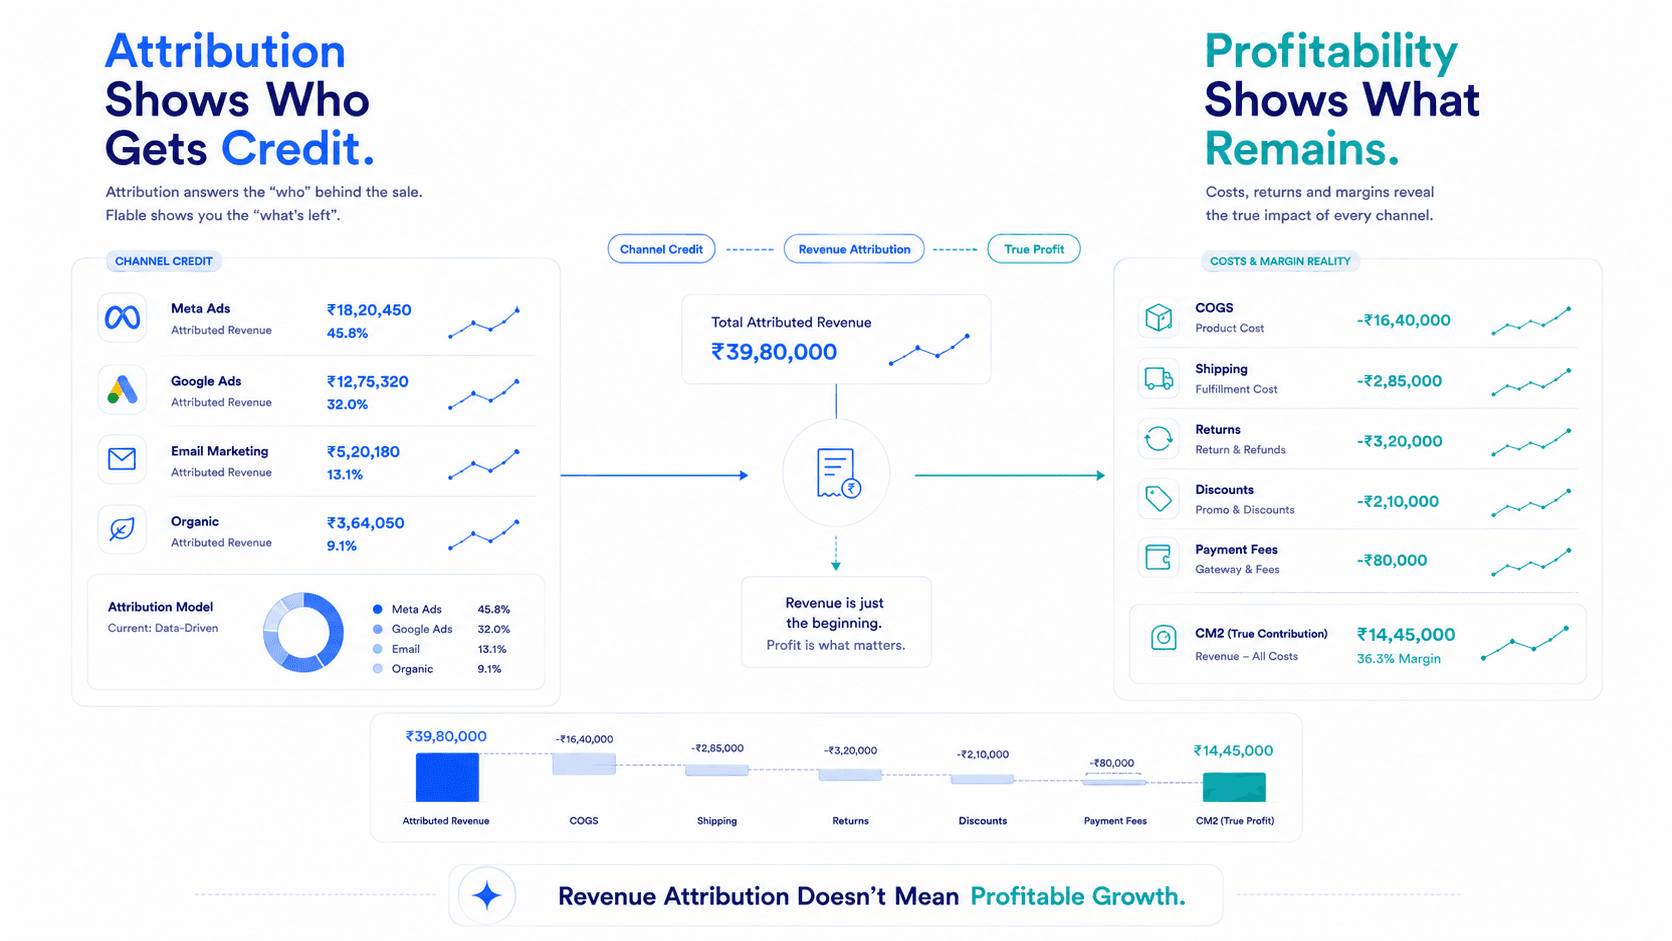
Not platform-attributed ROAS. Connect your actual net revenue, COGS, and returns to get the real profitability picture.
Attribution model (last-click, linear, etc.) gets most of the attention. Attribution window, how far back the model looks for touchpoints, has equally large impact on reported ROAS.
| Source | Default window |
|---|---|
| Meta | 7-day click, 1-day view |
| 30-day click | |
| Shopify UTM | Last click, no defined window |
For D2C products with any consideration period, anything above ₹500, anything where the customer compares alternatives, the purchase decision may take 1–3 weeks. A campaign that introduced the customer 10 days before purchase gets zero credit under a 7-day click window, even if it was the primary conversion driver.
In Meta Ads Manager, compare 7-day click vs 28-day click attribution for each campaign. If significant volume falls in the 8–28 day window, your campaigns are reaching customers earlier in the consideration cycle than the default window shows. This doesn’t mean Meta is more effective than reported, but it means the 7-day ROAS understates the actual contribution.
Use this data to understand your product’s consideration cycle, not to inflate your reported ROAS for optimisation decisions.
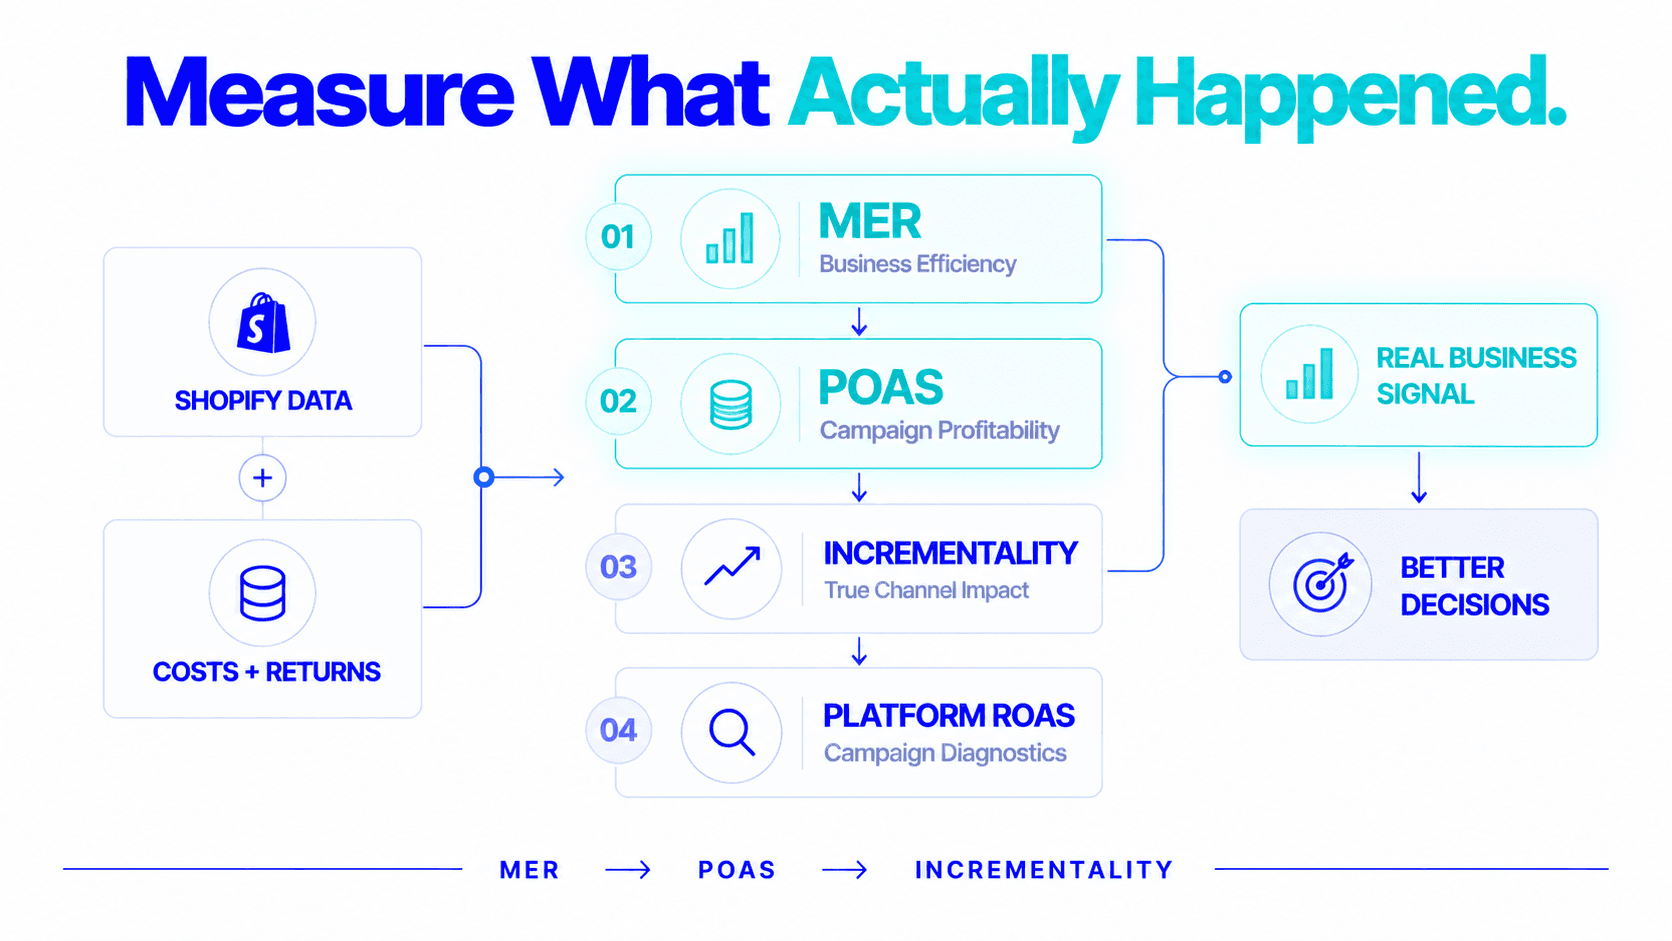
For D2C brands, the pragmatic answer to attribution complexity is building a metric stack that triangulates rather than relying on any single attribution model:
Level 1: MER (macro, weekly)
Total Shopify net revenue ÷ total marketing spend. Attribution-proof aggregate. Tells you if overall marketing efficiency is improving or declining.
Level 2: POAS per campaign (campaign, weekly)
Real profitability per campaign using Shopify revenue, COGS, and returns. Not platform-attributed ROAS. Not any attribution model.
Level 3: Incrementality test results (strategic, quarterly)
True causal impact of each channel. Tells you which channels are genuinely driving growth.
Level 4: Platform ROAS (diagnostic, weekly)
Used for in-platform decisions, creative testing, bid strategy, audience comparison, not for business-level decisions.
This stack is less elegant than “one attribution model to rule them all.” It’s more accurate. And accuracy is what budget allocation decisions actually need.
Attribution models explain how platforms divide credit for conversions. None of them perfectly capture real causal influence. All of them produce some version of attribution inflation when multiple channels run simultaneously.
Understanding the models matters not because you need to choose one and trust it completely, but because understanding what each one does helps you know:
Attribution tells you the story each platform wants to tell. Incrementality, MER, and POAS tell you what actually happened.
Attribution modeling assigns credit for a conversion to the marketing touchpoints that preceded it. Different models (last-click, first-click, linear, time-decay, position-based, data-driven) distribute credit differently, producing different views of channel effectiveness from the same customer journey data.
Because both platforms use their own attribution models and claim credit for the same purchases. A customer who touched both Meta and Google before purchasing appears in both platforms' conversion data. This attribution overlap is structural, the only solution is measuring aggregate efficiency through MER (Shopify net revenue ÷ total marketing spend) rather than comparing individual platform ROAS.
Data-driven attribution uses machine learning to assign credit based on actual impact, comparing conversion rates of customer paths that included a touchpoint versus those that didn't. It's the most accurate model but requires 3,000+ monthly conversions for reliable results. Available in Google Ads automatically at sufficient scale.
Flable uses Shopify net revenue as the ground truth for all profitability calculations, bypassing platform attribution entirely. POAS and CM2 per campaign are calculated from actual Shopify orders, COGS, and returns data, not from what platforms claim to have driven.
Flable AI calculates POAS and CM2 per campaign from real Shopify orders, COGS and returns, bypassing platform attribution entirely.