Attribution & Analytics
Your Google Brand Search campaign shows 5.2x ROAS. It's your strongest campaign by far. Your agency loves it. You've been increasing budget on it every month.
> 70%
Genuinely new demand
14–21 Days
Full purchase cycle
30% – 60%
Typical real incrementality
Here's the uncomfortable question: what would happen if you turned it off?
If the answer is "revenue would drop by exactly what Google is attributing" — the campaign is genuinely incremental. Every conversion it claims is a conversion that wouldn't have happened without it.
If the answer is "revenue would barely move because those customers would have found you on Google organically anyway" — you've been paying for conversions that were going to happen regardless. Your 5.2x ROAS is real. The incrementality behind it is not.
An incrementality test is the only way to find out which one is true. And for most D2C brands, the answer is somewhere in between — and worth knowing precisely.
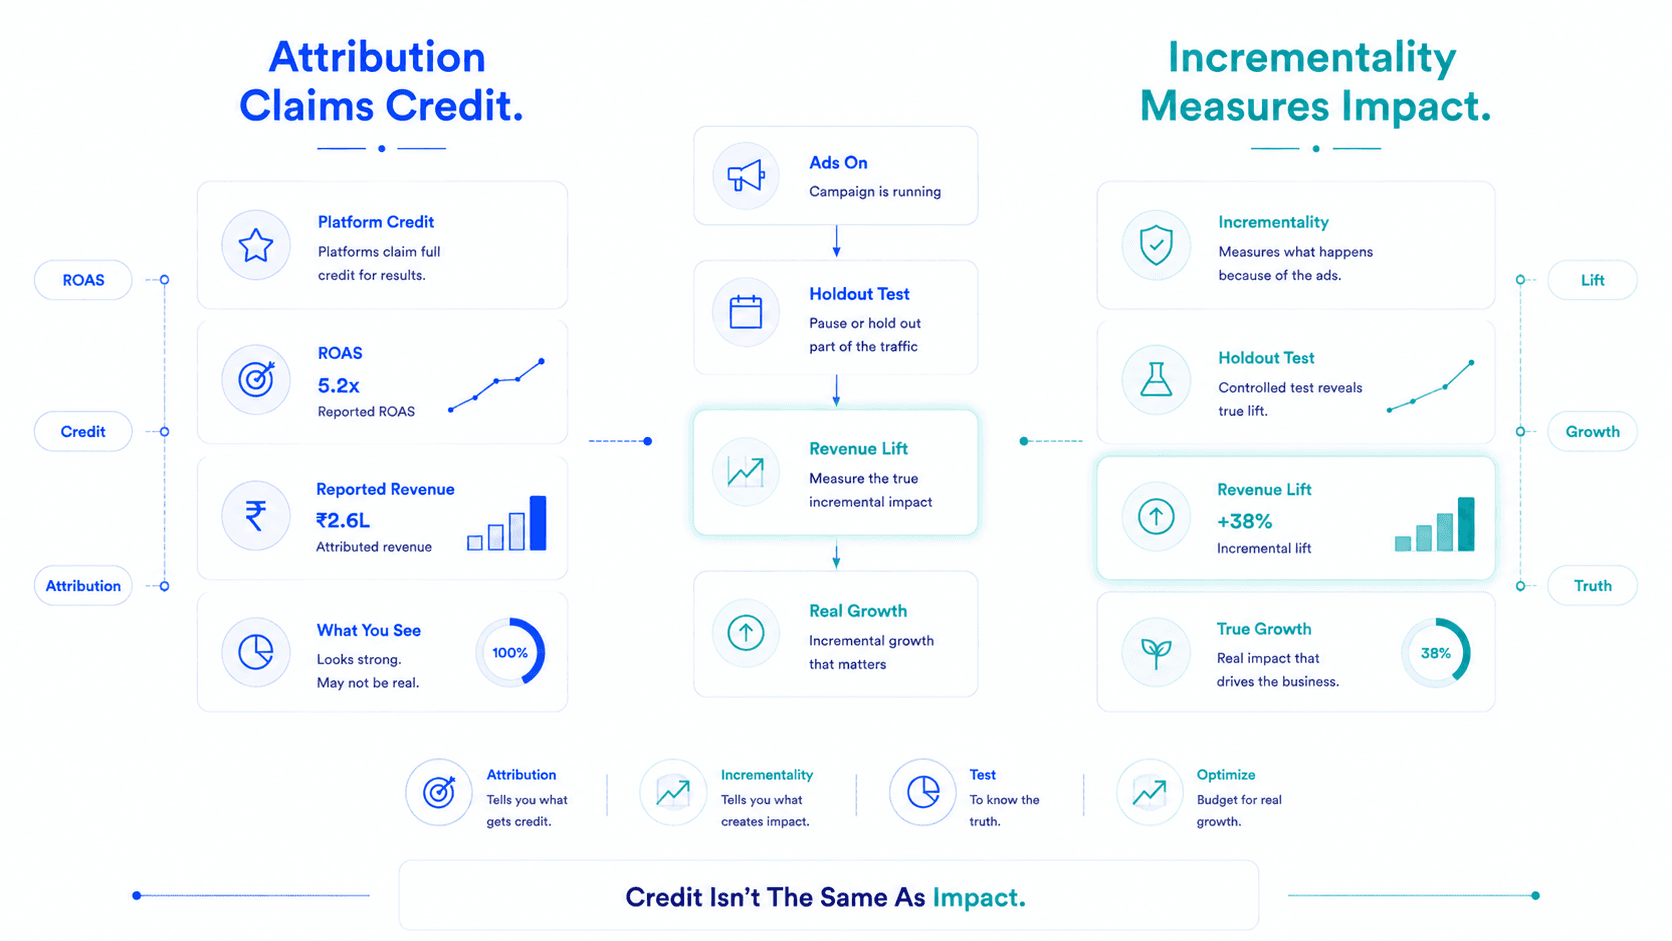
Attribution tells you who took credit. Incrementality tells you who deserves it.
An incrementality test (also called a holdout test or lift test) measures the true causal impact of an advertising channel or campaign by comparing what happened with the advertising against what would have happened without it.
Instead of asking "how much revenue did this campaign generate?" (which platforms answer with attribution) it asks "how much revenue would we have lost without this campaign?" (which only a controlled test can answer).
The difference between those two questions is the incrementality gap, and it's where attribution inflation lives.
The objection is always the same: "I can't pause a campaign that's working. What if revenue drops?"
This fear is real. But consider the alternative: spending ₹2L/month on a Google Brand Search campaign that has 60% incrementality means ₹80,000/month is being paid to capture conversions that would have happened through organic search anyway. Over a year, that's ₹9.6L in recoverable budget.
The test costs you a two-week pause on one campaign. The insight is worth months of budget optimisation.
The brands that never test never know. And not knowing means making allocation decisions based entirely on which platform is best at claiming credit, not which platform is actually driving growth.
Pause an entire channel for a defined period and measure the impact on total Shopify revenue.
Best for: Testing whether a channel is driving genuinely incremental revenue or largely capturing organic demand (common test for Google Brand Search, email, and SMS).
How it works: Pause the channel completely. Monitor total Shopify revenue for 14 days. Compare against the equivalent 14-day period before the test (ideally the same weekdays to control for day-of-week effects).
What you're measuring: Revenue drop as a percentage of what the channel was attributing.
Continue running your full campaign in most regions but pause it in a specific geographic test region. Compare revenue trends in the holdout region against regions where campaigns ran normally.
Best for: Testing channels where a full pause would be too risky or disruptive to operations. Allows you to test incrementality without stopping all activity.
How it works: Select 2–3 cities or states that represent approximately 10–15% of your total revenue. Pause the channel in those regions. Run for 14–21 days. Compare revenue change in holdout regions against change in control regions.
Within a specific campaign, randomly suppress the ads for a subset of your target audience (the holdout group) while continuing to show ads to the rest (the test group). Compare conversion rates between the two groups.
Best for: Testing whether a retargeting or remarketing campaign is actually driving incremental conversions or just showing ads to people who were going to buy anyway.
How it works: Meta's native Holdout Experiments tool (in Ads Manager → Experiments → Holdout) allows you to set a holdout percentage (typically 10–20% of the target audience sees no ads). After 7–14 days, compare the conversion rate of the holdout group against the ad-exposed group. The lift = true incrementality.
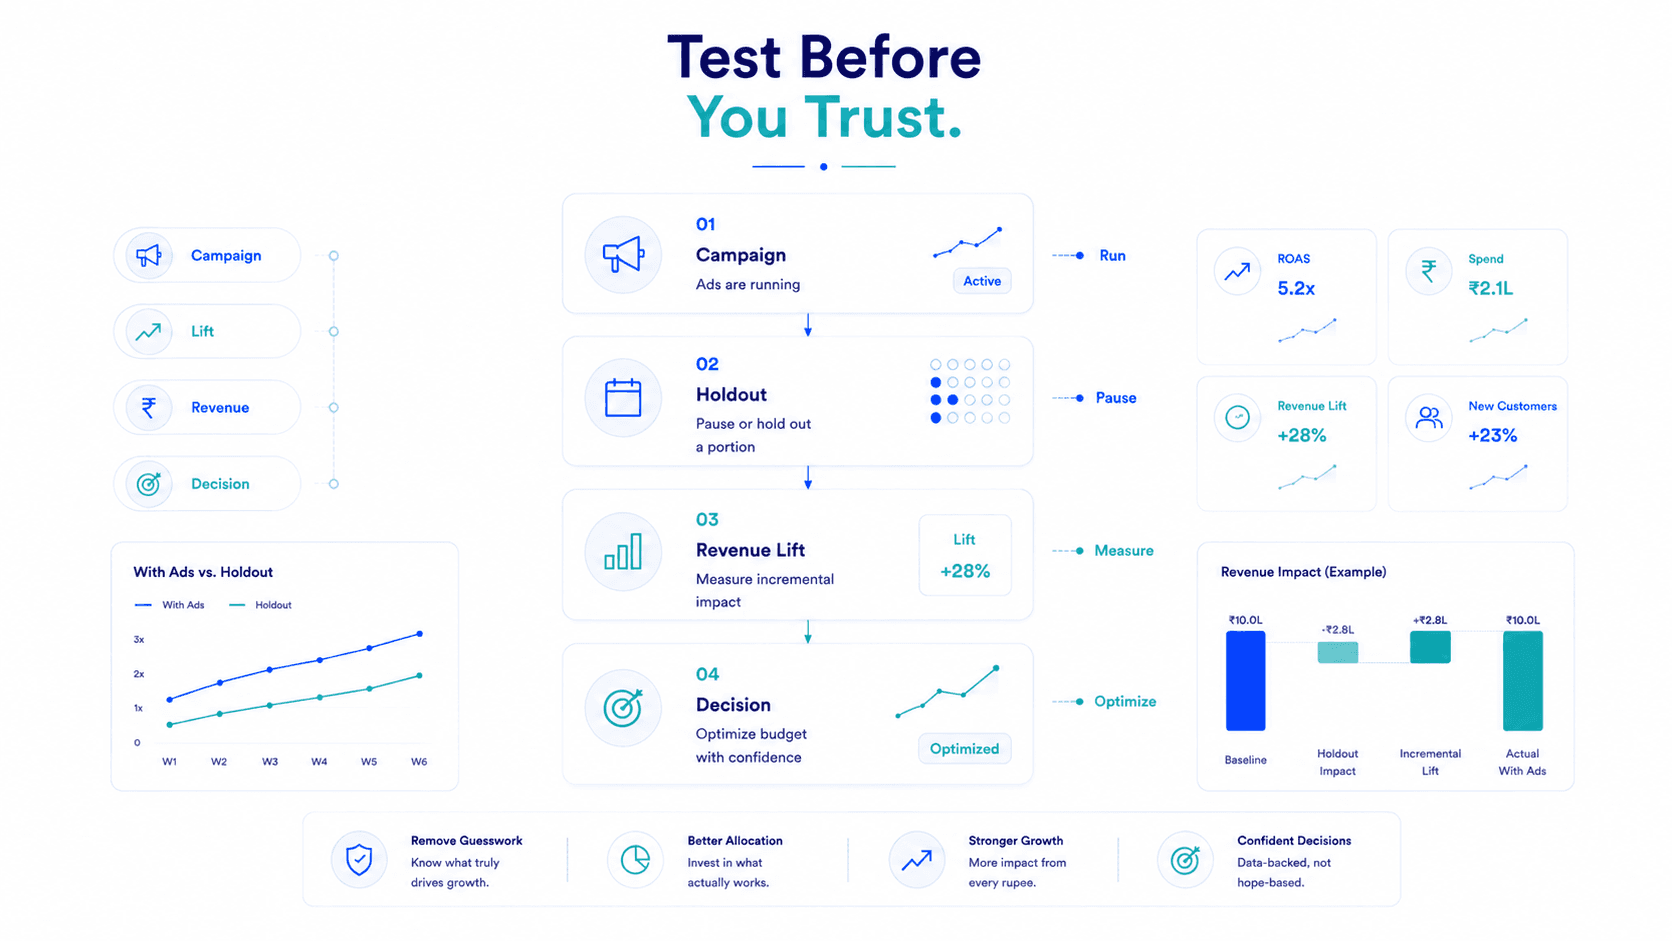
This is the most practical incrementality test for most D2C brands — straightforward to set up and provides clear, actionable data.
Start with the channel that shows the highest ROAS and therefore has the most to lose if incrementality is poor. The highest-ROAS channels are the ones most likely to be taking credit for organic demand.
Most common first tests for D2C brands:
💡 Start with Google Brand Search. It's the most commonly over-attributed channel and has the clearest test structure (pause brand keyword bidding, monitor organic brand search traffic and conversions).
Before pausing, record for the 14 days immediately before your test:
| Metric | 14-Day Baseline |
|---|---|
| Total Shopify net revenue | ₹X |
| Shopify net revenue by day | Daily breakdown (to spot day-of-week patterns) |
| Total new customers acquired | N |
| Spend on the channel being tested | ₹Y |
| Channel-attributed revenue (from platform) | ₹Z |
⚠️ Note: Run the test during a stable, non-promotional period. Avoid the 2 weeks before or after a major sale, festival, or product launch — external factors make it impossible to isolate the channel's impact.
Monitor daily:
| Metric | What to Watch |
|---|---|
| Shopify net revenue (daily) | Primary outcome metric |
| Organic search traffic | Should increase as paid brand search stops — organic captures some |
| Direct traffic | Often increases as branded searches shift to direct navigation |
| Other channels' attributed revenue | Should not change significantly — large changes suggest contamination |
Do not make any other significant changes during the test period. No budget changes to other campaigns, no new creative launches, no promotions. Isolating the variable is everything.
After the test period:
Revenue drop = Baseline daily revenue − Test period daily revenue
Channel-attributed revenue per day (from platform) = Pre-test attribution ÷ 14 days
Incrementality % = Revenue Drop ÷ Channel-Attributed Daily Revenue × 100
Numerical Example:
Google Brand Search is 43.75% incremental. This means:
At ₹8,000/day spend, you're paying for 56% non-incremental conversions. The budget reclamation opportunity is significant.
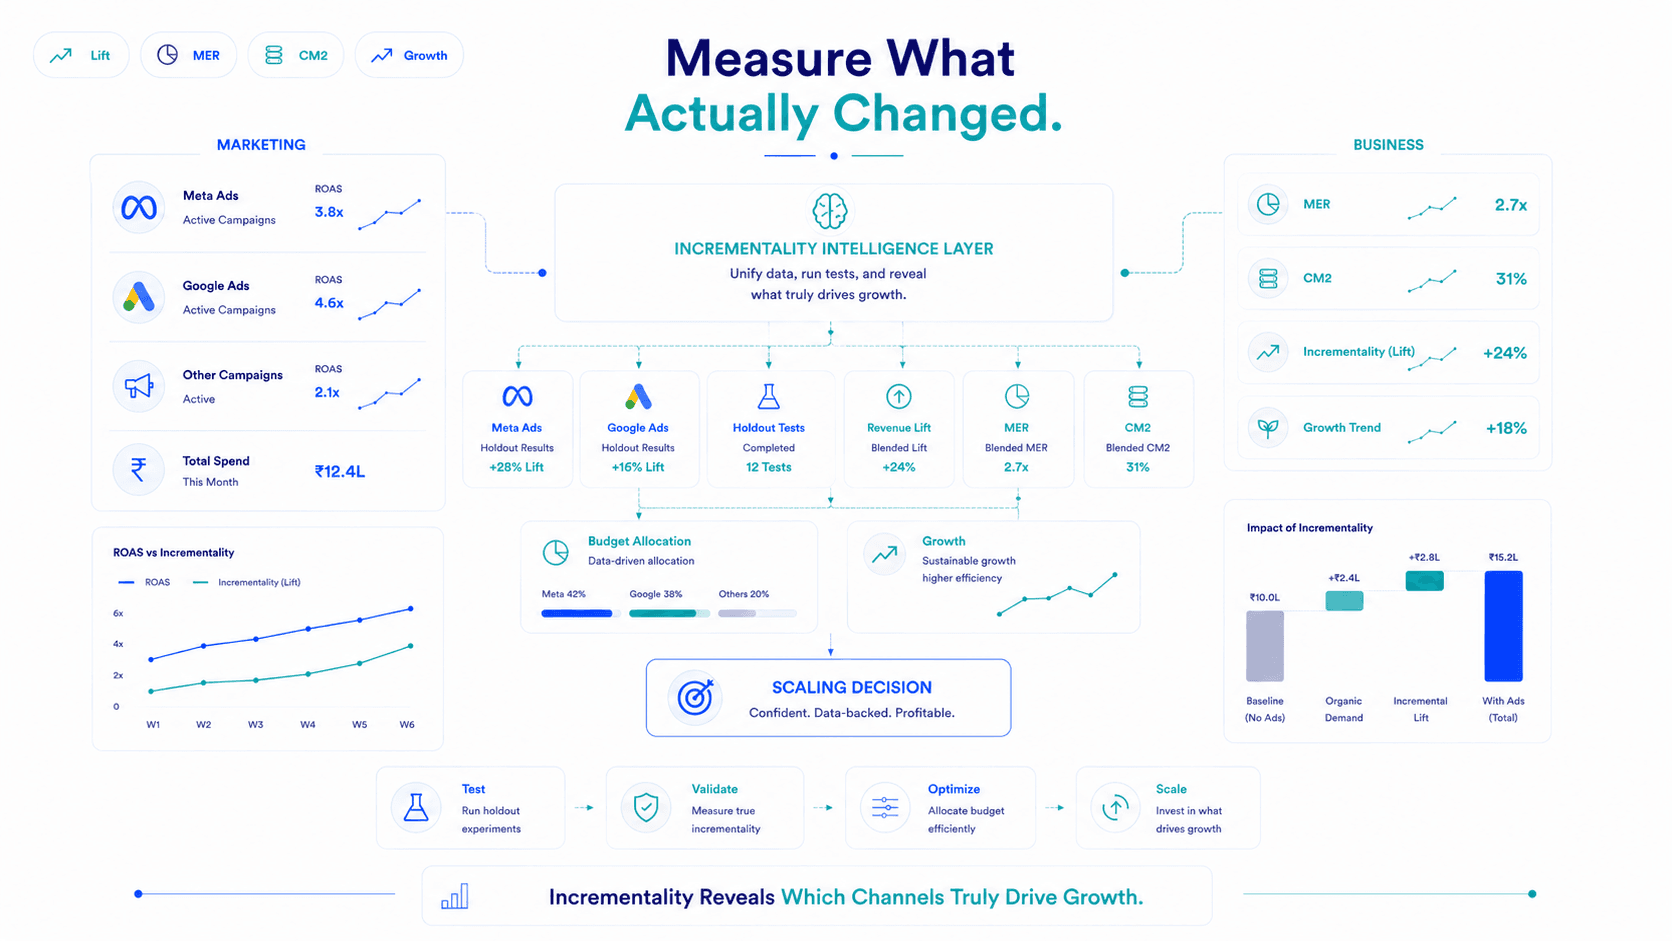
For testing Meta retargeting or prospecting campaigns without a full channel pause:
Meta automatically tracks the conversion rate difference between the holdout group (no ads) and the exposed group (saw your ads). At the end of the test, Meta reports the lift — the incremental conversion rate increase from showing the ads.
A lift of 30% means your retargeting campaign is driving 30% more conversions than the audience would have generated without seeing the ads. The remaining 70% of attributed conversions were going to happen anyway.
Incrementality isn't a one-time test. Channels change. Audiences evolve. A channel that was 75% incremental 18 months ago may be 45% incremental today as organic brand awareness has grown.
Recommended cadence:
Quarterly
Test your highest-spend, highest-ROAS channel. The one most worth validating.
Biannually
Run holdout experiments on your Meta retargeting campaigns. Retargeting incrementality shifts significantly with changes in organic traffic volume and brand awareness.
Annually
Full incrementality audit across all channels. Reallocate budget based on what's genuinely driving growth vs capturing organic demand.
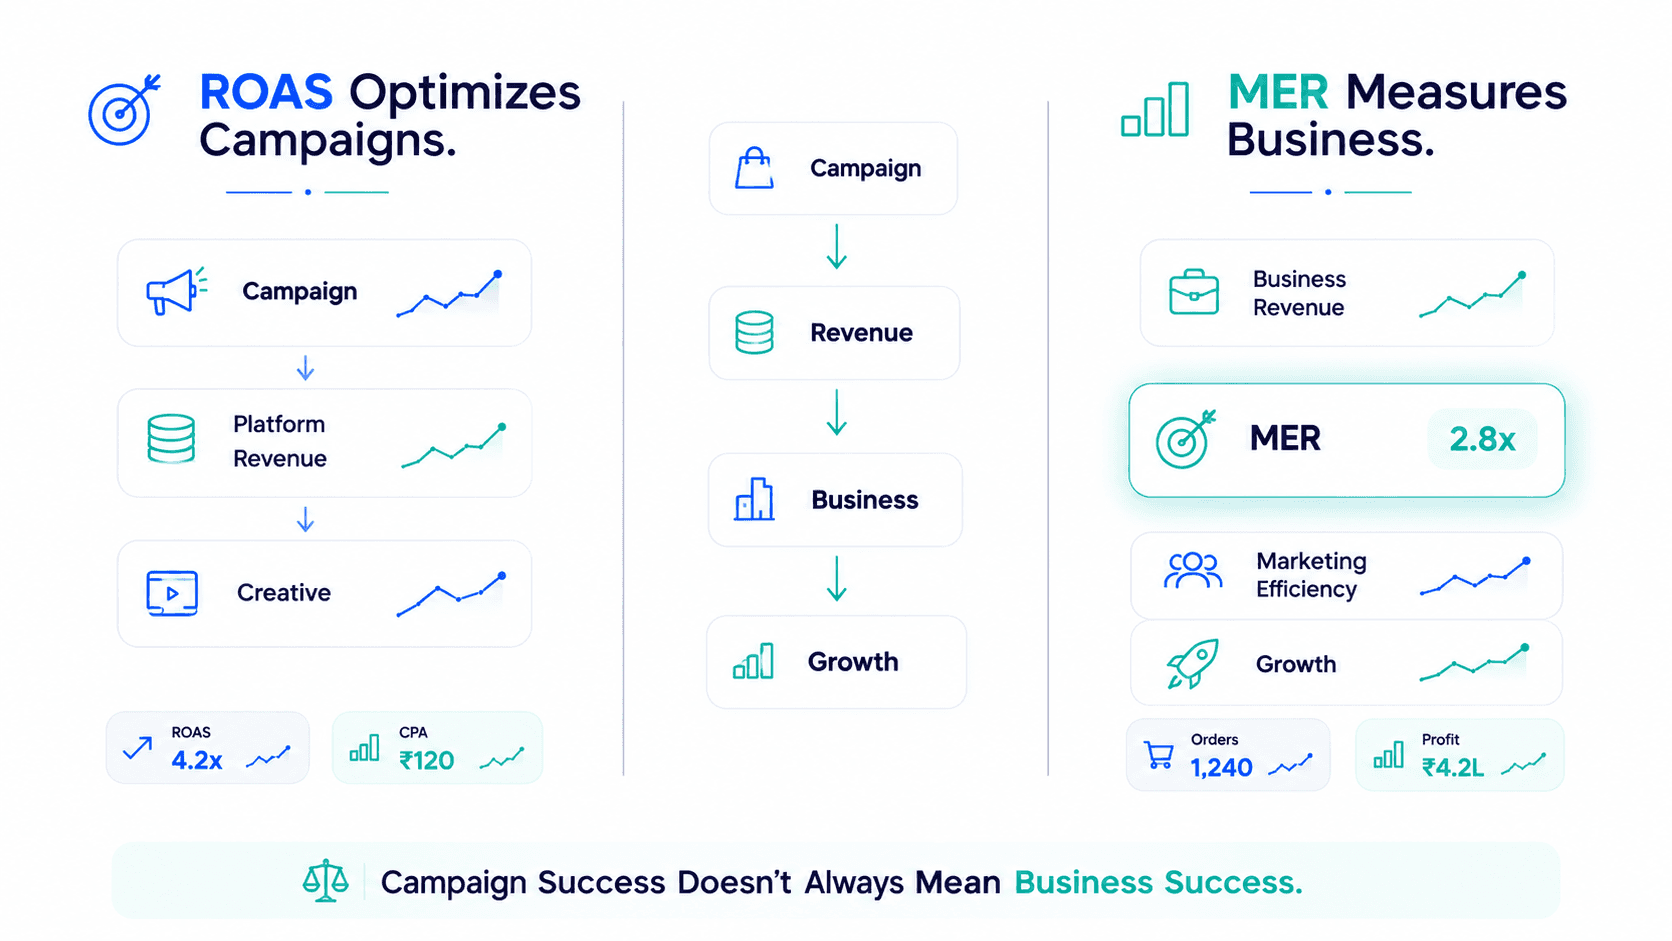
Incrementality testing is the most rigorous way to answer the question MER can suggest but not fully resolve: which channels are actually creating revenue, not just claiming it?
The test is simple. The pause is uncomfortable. The data is irreplaceable.
Run your first holdout test this quarter. Start with Google Brand Search. Measure for 14 days. Apply the incrementality percentage to your attribution and discover what your budget is actually earning versus what the platform is claiming.
Attribution tells you who took credit. Incrementality tells you who deserves it.
Key Takeaways
Frequently Asked Questions
An incrementality test measures the true causal impact of an ad campaign by comparing what happened with advertising against what would have happened without it. It answers whether a campaign is creating new demand or capturing demand that would have converted anyway the distinction that attribution cannot make.
Minimum 14 days for most D2C purchase cycles. 21 days is better for products with longer consideration cycles (above ₹1,500 AOV) or retargeting campaigns with 30-day windows. The test must run long enough to capture a complete purchase cycle for your typical customer.
Above 70% is strong most of what the channel is attributing is genuinely incremental. 40–70% is mixed real demand creation exists but significant organic capture is happening. Below 40% is concerning the channel is primarily capturing conversions that would have occurred through other channels anyway.
Possibly, but only the incremental portion. If Google Brand Search is 40% incremental, pausing it causes a 40% revenue drop on that channel's attribution. But that means 60% of what it was attributing was already being captured elsewhere. The test cost is the temporary loss of 40% incremental revenue from that channel for 14 days typically worth far more in budget efficiency insights.
Flable's MER calculation already uses Shopify net revenue as the ground truth, providing the aggregate picture. Incrementality tests at the channel level tell you how to allocate within that aggregate. Together, MER + incrementality data + Flable's per-campaign CM2 give the most complete picture of where each marketing rupee is genuinely earning its place.
MER and CM2 per channel calculated from Shopify, not platforms. Live.
Book a Live Demo →Setup in 48 hours · No credit card required · Backed by Microsoft & NVIDIA