Founder Series
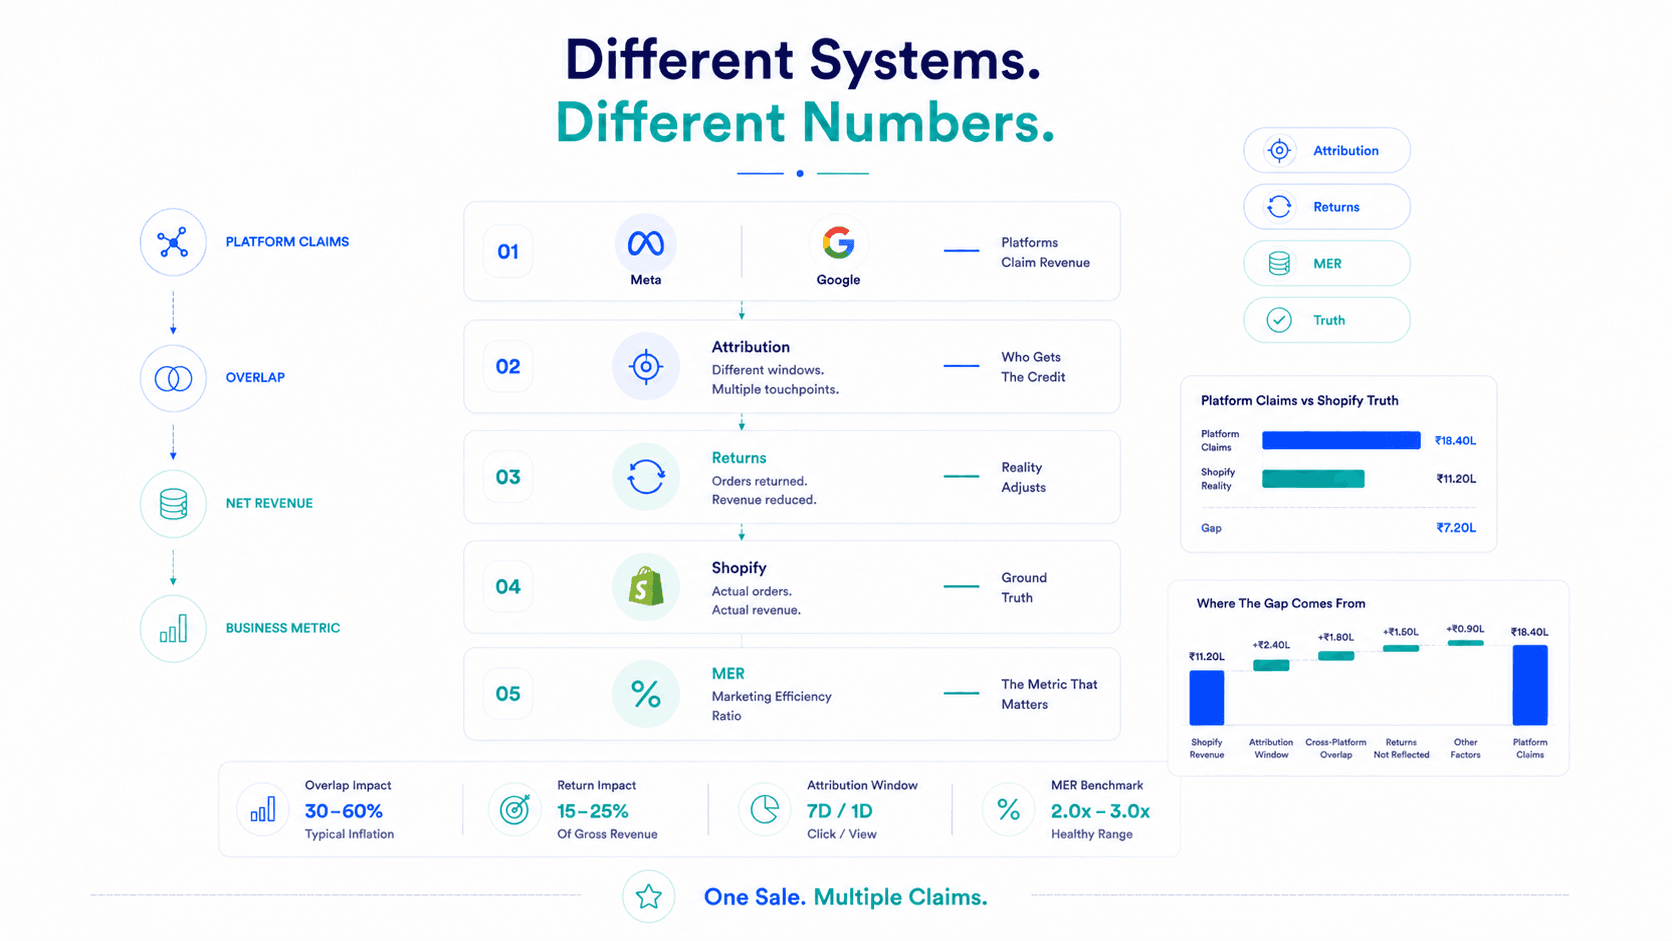
You open Meta Ads Manager. Last week's revenue: ₹18,40,000. You open Shopify. Last week's revenue: ₹11,20,000. Same business. Same week. ₹7,20,000 apart.
30% – 60%
Meta + Google Overlap
Self-Attribution
Double-counting same orders
Shopify MER
Net Revenue ÷ Total Spend
You've been staring at this gap for months. Your agency says Meta is working. Your Shopify says otherwise. Someone is wrong and you're not sure who to believe or what to do about it.
Here's the answer: neither number is wrong. They're measuring different things. Understanding why they differ, and by how much, is one of the most important things a D2C founder can do for their business in 2026.
The gap between Meta Ads Manager and Shopify is called attribution inflation, and it's not a bug — it's a structural feature of how ad platforms report performance.
Meta claims revenue from every customer who interacted with your ad and then purchased within Meta's attribution window (7-day click, 1-day view).
Shopify records revenue from every order placed on your store regardless of where the customer came from.
These two methods produce different numbers because Meta takes credit for purchases it influenced, purchases it didn't exclusively influence, and sometimes purchases that would have happened without it at all. Shopify just counts what actually happened.
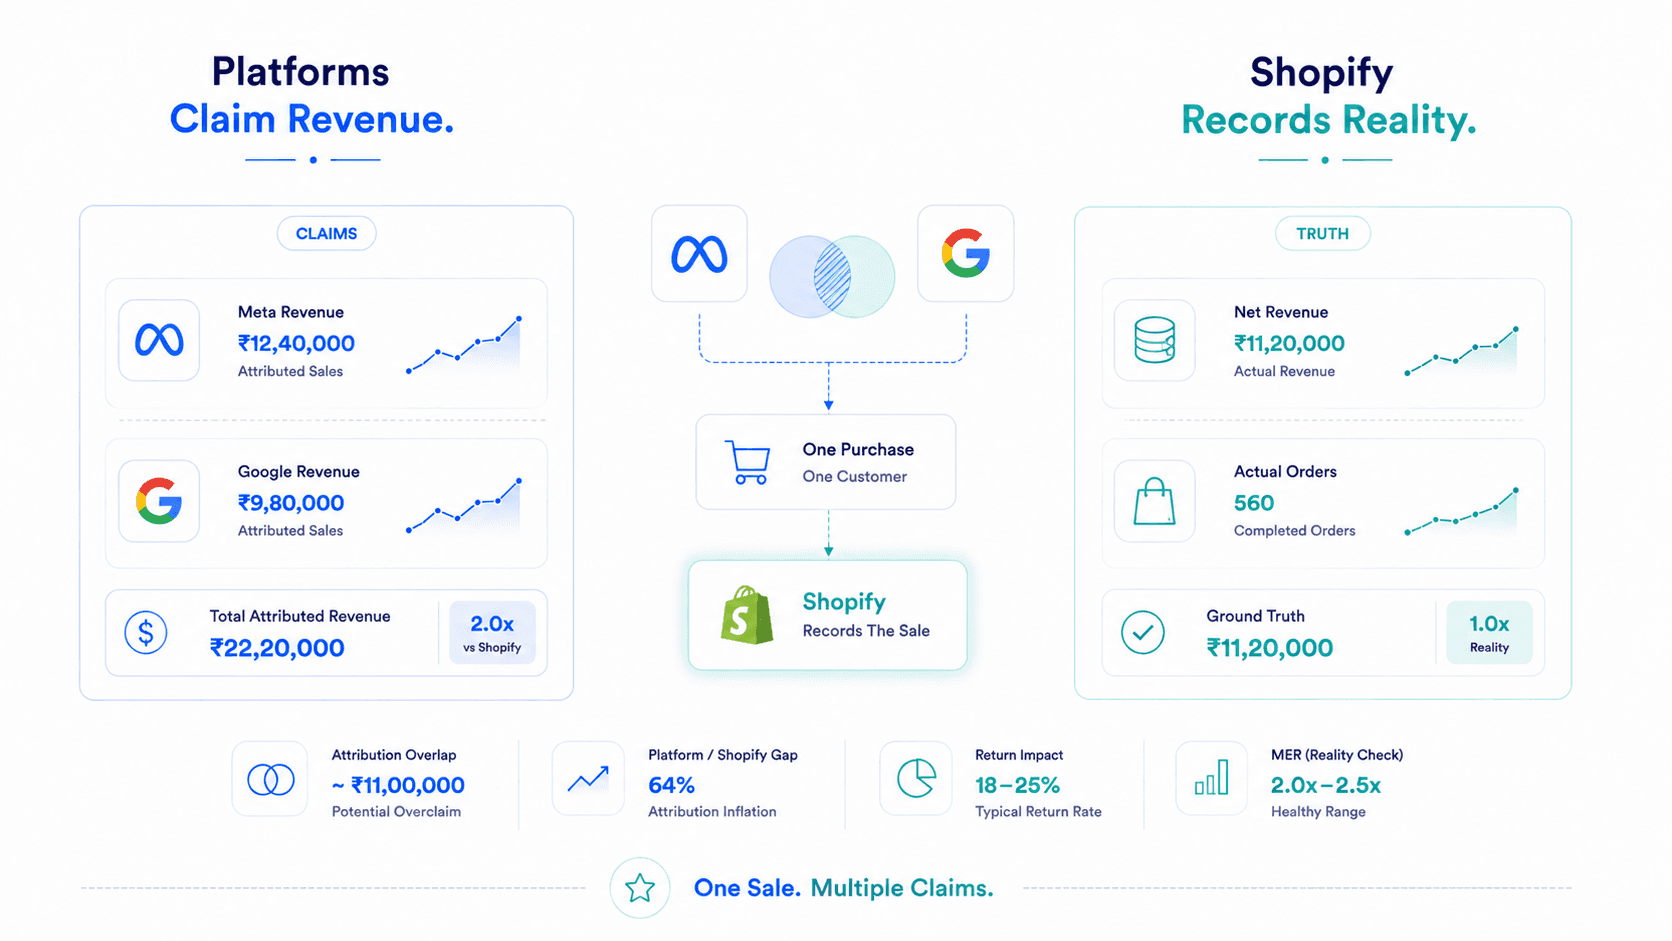
This is the biggest driver of the gap for brands running both Meta and Google simultaneously.
A customer sees your Meta ad on Monday. They don't click. On Wednesday they search for your brand on Google, click a Shopping result, and purchase.
Two platforms. One sale. Combined, your platform-reported revenue is nearly double your real revenue from this customer alone.
This overlap is systematic, not occasional. For brands running Meta + Google simultaneously, combined platform-reported revenue typically overstates actual Shopify revenue by 30–60%.
💡 The Test: Add up your Meta attributed revenue and Google attributed revenue for the same period. Compare against your Shopify net revenue. The combined platform number should be significantly higher. That excess is overlap.
Meta's default attribution window is 7-day click, 1-day view.
This means Meta claims credit for any purchase that happens within 7 days of someone clicking your ad, and within 1 day of someone simply seeing your ad (without clicking).
Here's what that creates: a customer who saw your ad on January 1st, forgot about it, and then purchased on January 6th after seeing your organic Instagram post gets attributed to the paid campaign in Meta's reporting. The paid ad may have played a role. It may not have. Meta takes credit regardless.
The 1-day view attribution is particularly aggressive. A person who scrolled past your ad without stopping, then purchased the next day for entirely unrelated reasons (maybe a friend recommended the product), shows up as a Meta conversion.
The impact: Meta captures a significant portion of sales that would have happened organically. It looks like paid is driving more revenue than it is.
A customer purchases. Meta records the conversion and the revenue. 12 days later, the customer returns the product.
For D2C brands with 15–25% return rates (common in fashion and electronics), this creates a systematic overstatement of Meta-attributed revenue relative to real Shopify net revenue. Every returned order widens the gap without Meta ever acknowledging it.
📉 The Impact: On a ₹18L Meta-attributed revenue week with a 20% return rate, approximately ₹3.6L of that revenue eventually reverses in Shopify. Meta still shows ₹18L.
Apple's App Tracking Transparency (ATT) framework requires iOS users to opt into tracking. The majority opted out. This removed device-level conversion data from Meta's pixel for a significant portion of iOS users.
The counterintuitive result: Meta now both overcounts and undercounts conversions simultaneously.
Overcounting
View-through attribution picks up iOS users Meta can't track at device level using statistical modeling. Some modeled attributions are legitimate; some are not.
Undercounting
Some real conversions driven by Meta ads on iOS devices don't get captured at all because the pixel cannot fire correctly.
The Fix: Conversions API (CAPI), which sends conversion events from your server directly to Meta, bypassing browser and iOS limitations. CAPI doesn't eliminate the Shopify-Meta gap entirely, but it makes Meta's data more accurate and reduces modeling inaccuracy.
Your email sequence converts a customer who originally came from Meta. Shopify's UTM data shows "email" as the source (last click). Meta shows it as a Meta conversion (the customer clicked a Meta ad 4 days ago).
Same order. Different channel credited.
This happens across every channel combination: Meta + email, Meta + SMS, Meta + influencer referral link, Meta + organic Instagram. Meta's multi-touch attribution gives it credit for being part of the journey. Shopify's last-click model gives credit to the last touchpoint. Neither is capturing the full truth, but both inflate their own numbers at the expense of the other.
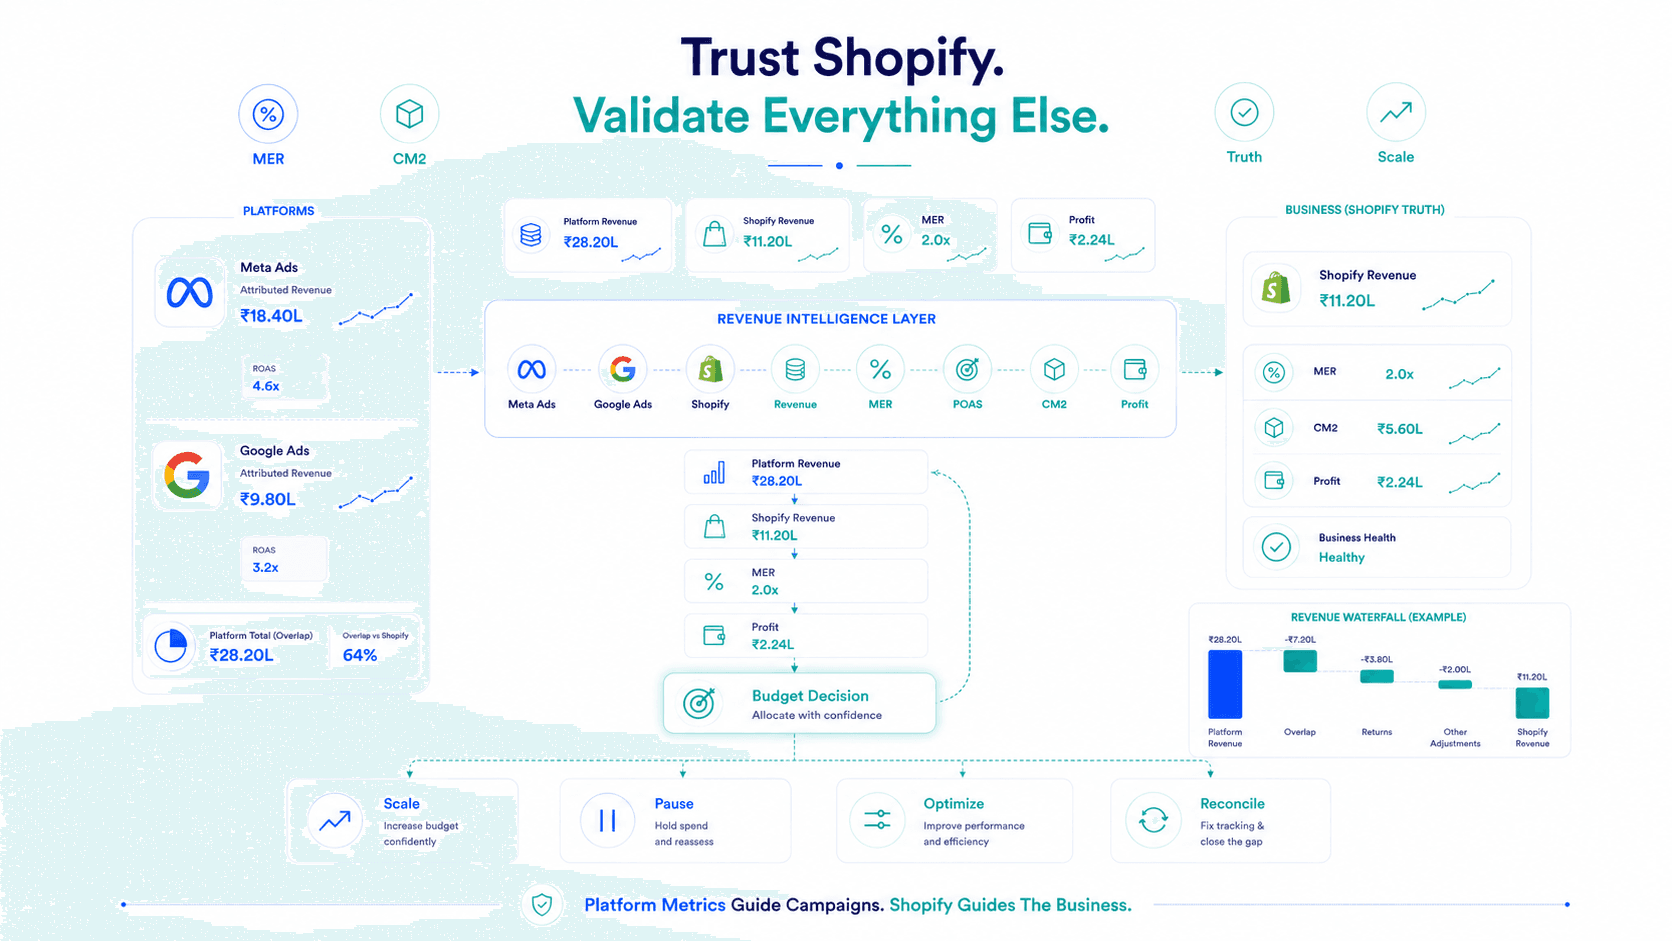
Add up all platform-attributed revenue for a period (Meta + Google + any other paid channels). Divide by your Shopify net revenue for the same period.
Attribution Inflation Ratio = Combined Platform Revenue ÷ Shopify Net Revenue
A ratio of 1.8x means platforms are claiming 80% more revenue than Shopify recorded. A ratio of 1.3x means 30% inflation, relatively controlled.
Most D2C brands running Meta + Google see a ratio of 1.4–2.0x. If yours is above 2.0x, your attribution overlap is severe enough to make individual platform ROAS numbers nearly meaningless for budget allocation decisions.
Marketing Efficiency Ratio (MER) = Total Net Revenue (Shopify) ÷ Total Marketing Spend
MER bypasses the attribution inflation problem entirely. It doesn't care which platform claims what — it measures the aggregate efficiency of all your marketing against the revenue that actually landed in your business.
Example Calculation:
Real Business MER: 3.5x
MER of 3.5x is the honest number. Everything else is platforms taking credit.
The only rigorous way to know whether a specific channel is genuinely driving incremental sales versus claiming credit for sales that would have happened anyway is to pause it and measure what changes.
Pause your Google Brand Search campaigns for two weeks. If Shopify revenue drops by less than what Google was attributing, Brand Search has poor incrementality — customers were finding you organically anyway.
This feels uncomfortable (pausing campaigns that look like they're working is counterintuitive). But it's the most accurate way to cut through attribution noise and know where your budget is actually earning its place.
Build a simple weekly reconciliation table and run this every Monday. Track the inflation ratio week-over-week:
| Metric | This Week |
|---|---|
| Shopify Gross Revenue | ₹14,20,000 |
| Shopify Returns/Refunds | −₹1,80,000 |
| Shopify Net Revenue | ₹12,40,000 |
| Meta Attributed Revenue | ₹16,80,000 |
| Google Attributed Revenue | ₹9,40,000 |
| Combined Platform Claims | ₹26,20,000 |
| Attribution Inflation Ratio | 2.11x |
| Total Marketing Spend | ₹3,60,000 |
| MER (Real Business Efficiency) | 3.44x |
The Shopify-Meta gap is not your agency stealing money. It's not Meta lying. It's not a technical glitch.
It's a structural property of how different systems measure the same thing differently. Understanding the gap and building your decision-making around Shopify net revenue (as the ground truth) and MER (as the efficiency metric) is what separates D2C brands that scale profitably from those that scale on inflated platform data and wonder where the money went.
Your Shopify revenue is real. Your Meta revenue is claimed. The gap between them is attribution inflation and knowing its size and causes is the beginning of making honest marketing decisions.
Use Shopify net revenue as your ground truth. Use MER as your efficiency metric. Use POAS and CM2 per campaign for individual campaign decisions. And treat individual platform ROAS for what it is: a directional signal, not a business metric.
The number that matters is what landed in your Shopify. Everything else is working backwards from there.
Key Takeaways
Frequently Asked Questions
Meta claims revenue from every purchase within its attribution window (7-day click, 1-day view) including purchases that may have been influenced by multiple channels or would have happened organically. Shopify records actual orders placed. The gap is attribution inflation: platforms taking credit for sales that Shopify records as one number.
For brands running only Meta, a 10–30% gap is typical and largely explained by view-through attribution and returns. For brands running Meta + Google + email simultaneously, a 40–80% combined platform inflation over Shopify net revenue is common. Above 100% inflation means attribution overlap is severe enough to make individual channel ROAS meaningless.
MER (Marketing Efficiency Ratio) = Total Shopify Net Revenue ÷ Total Marketing Spend. It measures aggregate marketing efficiency against real revenue without caring about which platform claims what. It's immune to attribution inflation and is the most reliable single metric for cross-channel marketing performance.
CAPI sends conversion data from your server directly to Meta, recovering conversions that iOS restrictions and browser privacy settings caused the pixel to miss. CAPI makes Meta's data more accurate and reduces statistical modeling inaccuracies, narrowing (but not eliminating) the Shopify-Meta gap by improving the quality of Meta's attribution.
Flable connects your Shopify net revenue, Meta and Google ad spend, and returns data to calculate MER, POAS, and CM2 automatically. It uses Shopify as the ground truth for revenue — not platform-reported figures — so every profitability metric reflects what actually happened in your business, not what platforms claimed.
Real contribution margin per campaign and channel. The number that tells you whether to scale.
Start Measuring Profitability →Setup in 48 hours · No credit card required · Backed by Microsoft & NVIDIA