Dashboard & Analytics
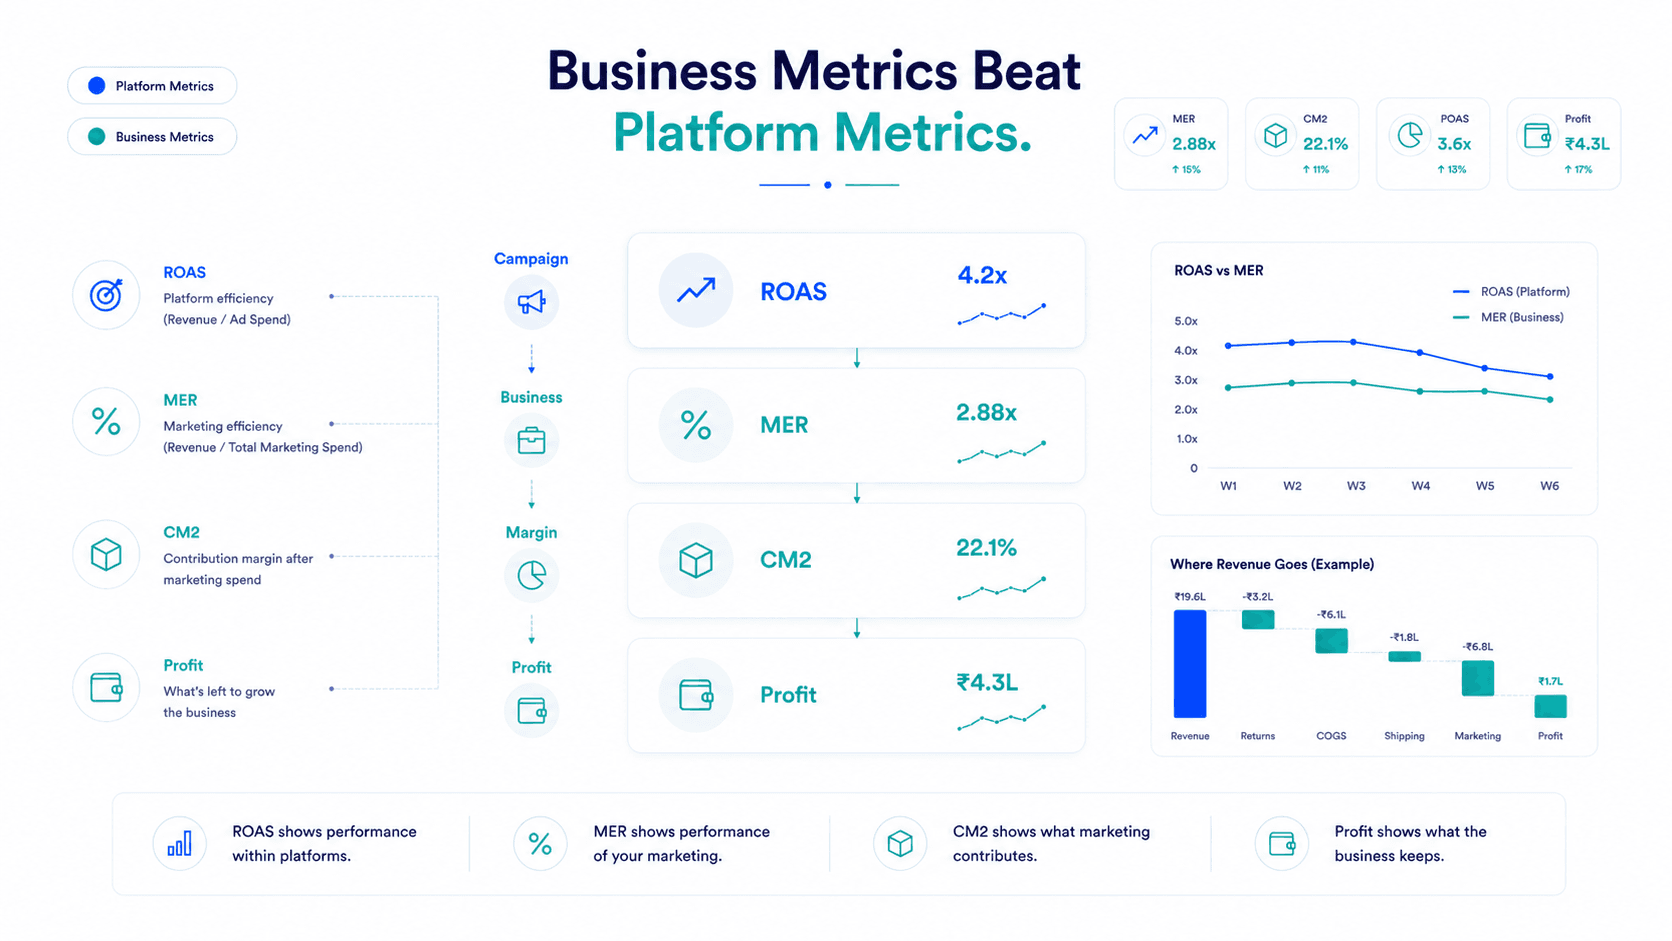
Every D2C brand tracks ROAS. Very few track MER. That asymmetry explains a lot — why budgets get allocated to channels that look efficient but aren't, why revenue grows while profit doesn't, and why the weekly agency call sounds optimistic while the monthly P&L tells a quieter story.
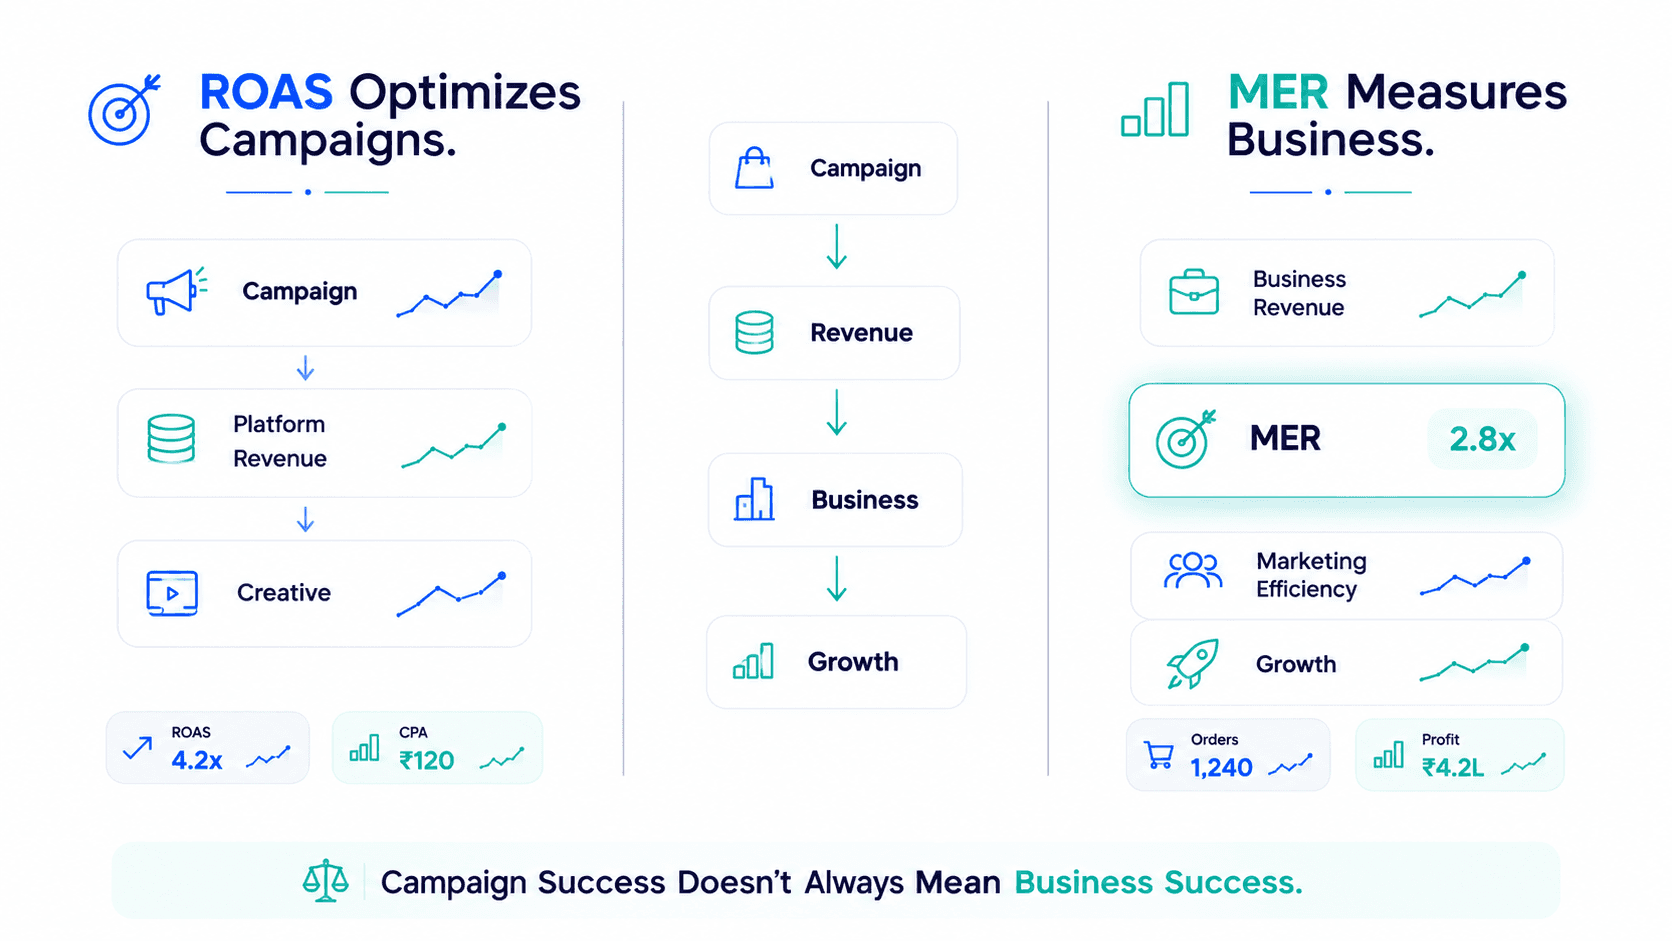
In-Platform
Campaign & Creative test
Business Truth
Shopify Net Rev ÷ Total Spend
2.8 – 5.0x
Varies by growth stage
ROAS and MER both measure marketing performance. They're not the same metric, they don't answer the same question, and using one where you need the other is one of the most expensive mistakes in D2C scaling.
Here's the complete breakdown.
ROAS = Revenue Attributed to a Campaign ÷ Ad Spend on That Campaign
ROAS is a platform metric. Meta calculates it. Google calculates it. It lives inside the ad platform's reporting and reflects the platform's own rules for what counts as an attributed conversion.
What ROAS is genuinely useful for:
These are all intra-platform decisions. ROAS is built for them.
1. It's self-reported by each platform: Meta's ROAS uses Meta's attribution model. Google's ROAS uses Google's. When you run both simultaneously, the same customer who interacted with both platforms gets counted by both. Your combined attributed revenue can be 40–80% higher than your actual Shopify revenue. Individual platform ROAS numbers become unreliable for any cross-channel comparison.
2. It ignores everything after the click: Returns, COGS, shipping costs, payment fees — none of these appear in ROAS. A 4x ROAS on a 20% gross margin product with a 25% return rate is a loss-making campaign. ROAS cannot tell you this.
3. It rewards cheap conversions over valuable ones: The algorithm optimises toward the conversions it can find most cheaply. Retargeting conversions are cheaper than prospecting conversions. Existing customer re-purchases are cheaper than new customer acquisitions. If your campaigns aren't structured to separate these, ROAS rises while real new customer acquisition stalls.
MER = Total Net Revenue (Shopify) ÷ Total Marketing Spend (All Channels)
MER is not a platform metric. It's a business metric. You calculate it yourself from your Shopify net revenue and your total marketing spend, including ad spend, agency fees, influencer costs, tool subscriptions, and any other variable marketing cost.
It doesn't care which platform claimed what. It doesn't use attribution windows. It doesn't see individual campaigns.
It asks one simple question: for every rupee spent on marketing in total, how much revenue came back to the actual business?
What MER is genuinely useful for:
| Parameter | ROAS | MER |
|---|---|---|
| Formula | Platform revenue ÷ Campaign spend | Shopify net revenue ÷ Total spend |
| Source of revenue data | Platform attribution | Shopify (actual orders) |
| Accounts for overlap | ❌ Self-reports independently | ✅ Uses single source of truth |
| Per-campaign visibility | ✅ Yes | ❌ Aggregate only |
| Immune to self-attribution | ❌ No | ✅ Yes |
| Reflects returns | ❌ Ignored | ✅ Net of returns |
| Budget allocation decisions | ❌ Unreliable | ✅ Highly reliable |
| Agency accountability | ❌ Easily manipulated | ✅ Ground truth |
Here's a practical illustration of what happens when you compare both metrics simultaneously for a D2C skincare brand last month:
| Source | Reported Revenue |
|---|---|
| Meta Ads Manager | ₹24,00,000 |
| Google Ads | ₹16,80,000 |
| Email Platform | ₹8,40,000 |
| Combined Platform Claims | ₹49,20,000 |
| Shopify Net Revenue (Actual) | ₹19,60,000 |
Attribution Inflation Ratio: ₹49.2L ÷ ₹19.6L = 2.51x
Platforms are claiming 2.5x more revenue than Shopify recorded. Total marketing spend was ₹6,80,000.
This is the number to manage against, track weekly, and hold your team and agency accountable to.
Step 1: Pull Shopify net revenue for the week — Shopify Analytics → Sales → Net Sales figure (which excludes refunds).
Step 2: Pull total marketing spend for the week — Include Meta ad spend + Google ad spend + influencer fees + agency retainer (prorated weekly) + creative costs + tool costs.
Step 3: Divide — MER = Shopify Net Revenue ÷ Total Marketing Spend.
Step 4: Track trend — Add to a simple spreadsheet week-over-week to monitor marketing efficiency independent of platform self-reporting.
| Growth Stage | Typical MER Range |
|---|---|
| Early Stage (Under ₹1Cr MRR) | 3.5–5.0x |
| Growth Stage (₹1–5Cr MRR) | 2.8–4.0x |
| Scale Stage (₹5–15Cr MRR) | 2.2–3.5x |
| Brand-Mature (₹15Cr+ MRR) | 1.8–3.0x |
Use ROAS for:
Use MER for:
ROAS is the metric ad platforms give you because it's the one they can calculate. MER is the metric your business needs because it's the one that reflects what actually happened.
Run both. Use ROAS for in-platform decisions. Use MER for business decisions. And measure both against contribution margin — the number that tells you whether any of it was actually profitable.
Key Takeaway
The difference between ROAS and MER is the difference between what platforms claim and what your business earned. Know both. Trust the right one.
Frequently Asked Questions
MER stands for Marketing Efficiency Ratio. It's calculated as Total Net Revenue (from Shopify) ÷ Total Marketing Spend across all channels. Unlike ROAS, it uses your actual Shopify revenue as the numerator, not platform-attributed revenue — making it immune to attribution overlap and self-reporting bias.
ROAS uses each platform's attributed revenue divided by that platform's ad spend, subject to self-attribution bias and cross-channel overlap. MER uses actual Shopify net revenue divided by all marketing spend, providing a single, attribution-proof view of aggregate marketing efficiency. ROAS is better for campaign-level decisions; MER is better for business-level decisions.
Depends on stage: early-stage brands typically target 3.5–5.0x, growth-stage 2.8–4.0x, scaling brands 2.2–3.5x. MER naturally declines as brands invest in upper-funnel brand building. A declining MER combined with declining LTV is the warning signal — MER declining while LTV holds or grows is often acceptable.
Attribution overlap. Both platforms claim credit for the same sales when customers interact with ads on both platforms before purchasing. A customer who saw a Meta ad and clicked a Google Shopping ad counts as a conversion for both. Combined platform-attributed revenue for brands running Meta + Google typically overstates actual Shopify revenue by 40–100%.
Flable connects your Shopify net revenue with all ad spend inputs (Meta, Google) to calculate MER automatically, updated in real time as new orders and refunds process. Your MER is live on your dashboard alongside POAS and CM2 per campaign.
What your business actually earned vs what you spent. Automatic.
Start Measuring Profitability →Setup in 48 hours · No credit card required · Backed by Microsoft & NVIDIA