Profitability
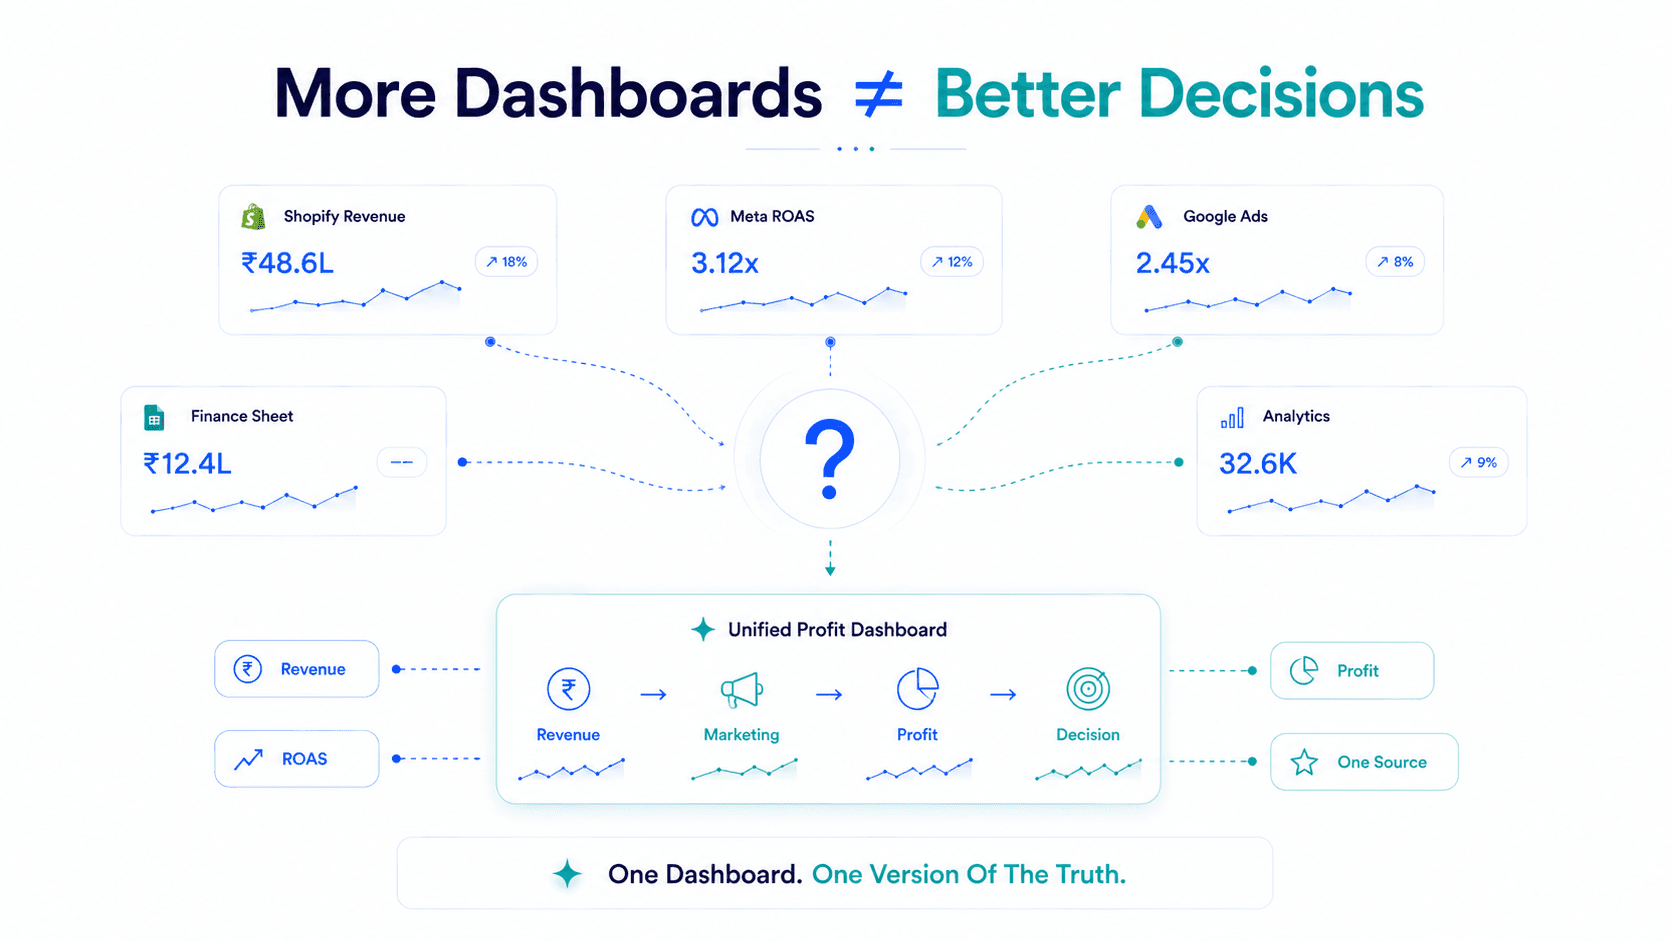
Most D2C brands have too many metrics and too little clarity. Shopify has 40 reports. Meta Ads Manager has 200+ columns. Google Ads has its own set. Your logistics platform has another. By the time you check everything, you still don't know the one thing that matters: is the business growing profitably?
5 Mins
Operations & Anomaly Detection
CM2 & POAS
Campaign Scale / Hold / Kill
LTV & Payback
Unit Economics & Capital
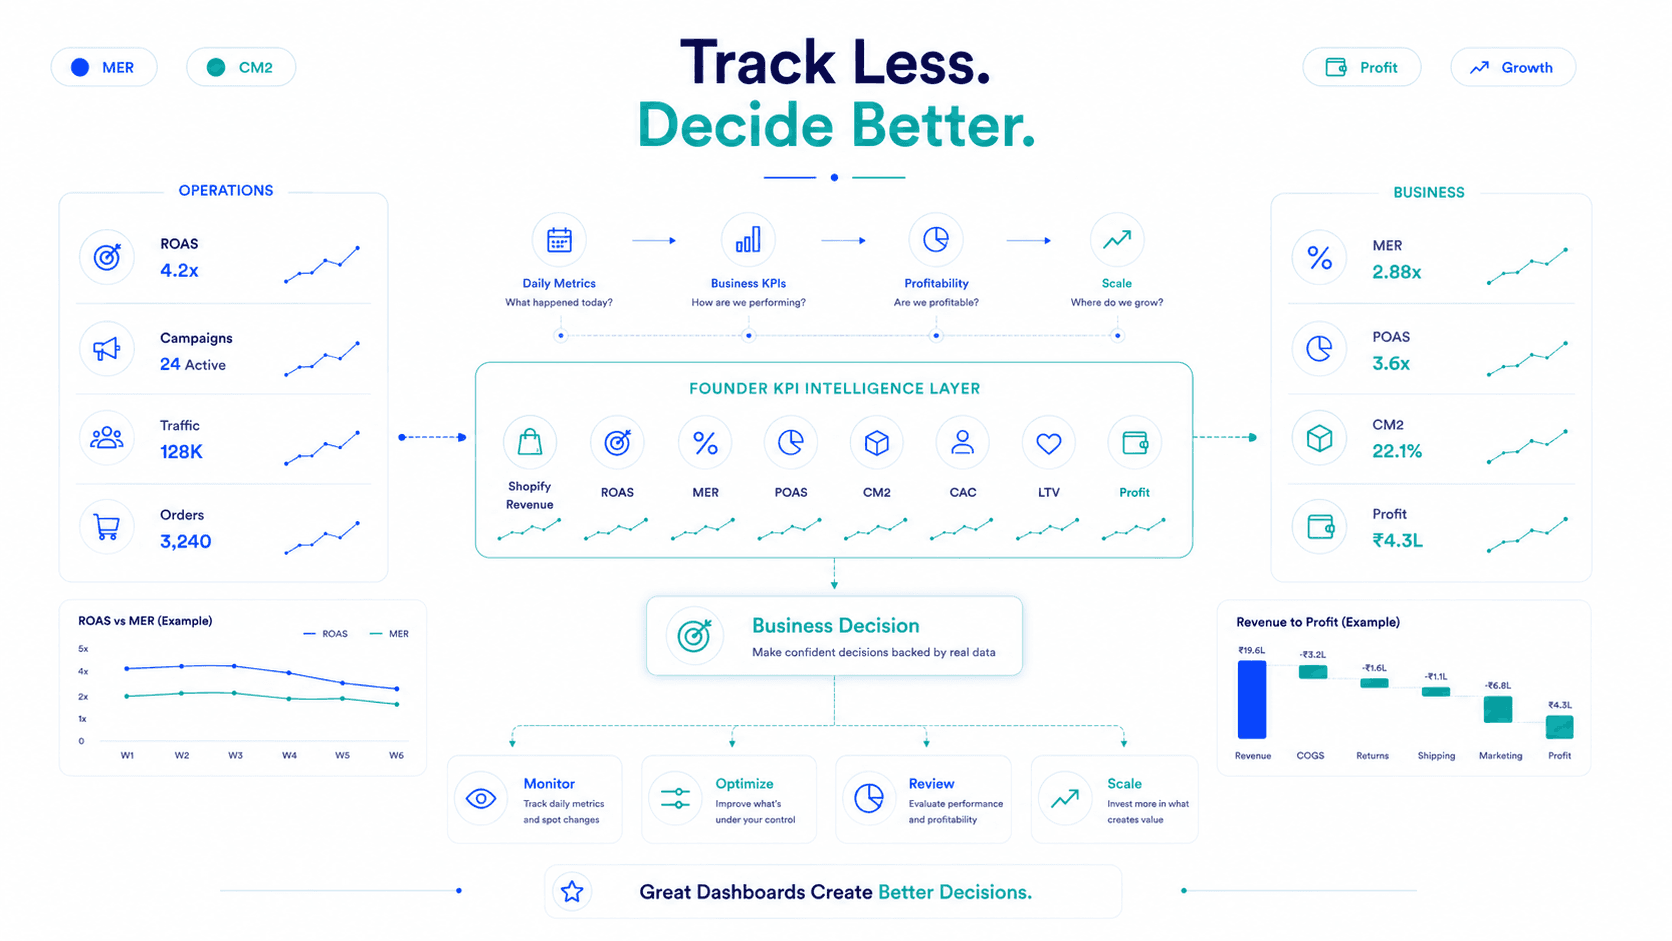
The problem isn't a lack of data. It's the absence of a structure that tells you which numbers to act on, when, and what questions each one answers.
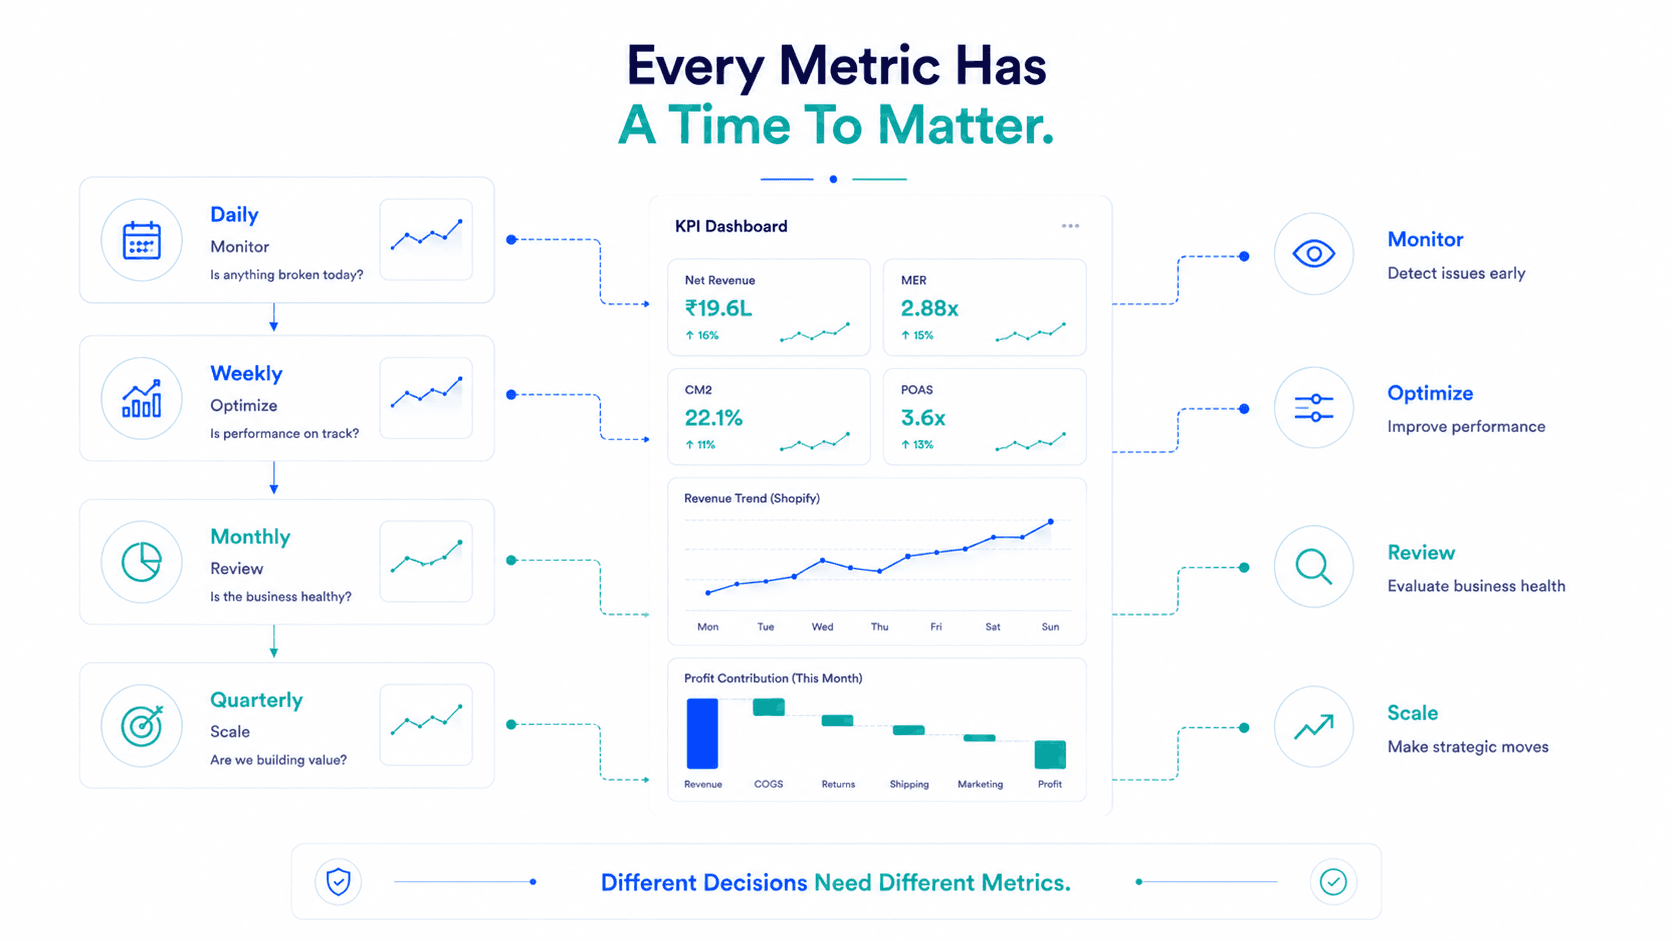
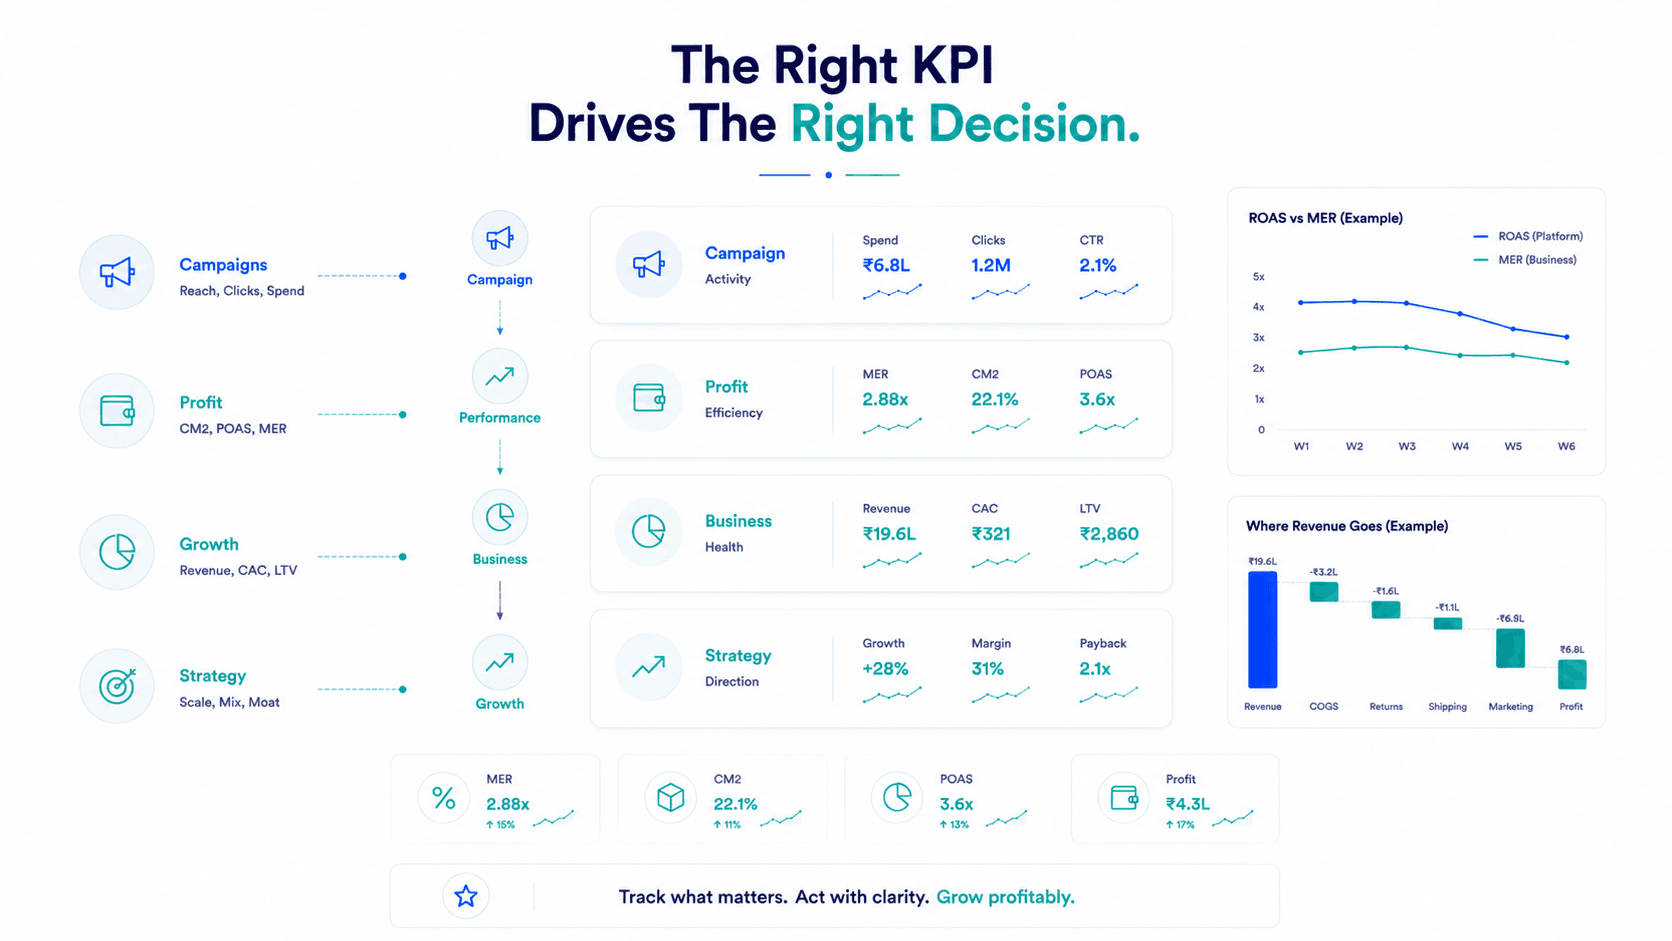
A D2C business makes decisions at four different levels, each with a different time horizon and a different set of metrics:
Campaign Operations: Catching anomalies, broken links, or tracking fires.
Performance Management: Are campaigns profitable? Scale, hold, or kill.
Business Health: Unit economics, LTV, gross margins, and retention.
Strategic Review: CAC payback, cohort LTV, and channel mix model.
Most D2C brands blur all four layers into one dashboard and check everything with the same frequency. The result is either panic (acting on daily noise) or blindness (missing weekly trends). The right dashboard separates them.
What you're looking for: anomalies — things that are broken or significantly off from their recent trend. What you're NOT doing daily: making scaling decisions, changing campaign budgets, assessing profitability. Daily is for catching fires, not redecorating the house.
| Daily Metric | Where to Find It | Alert Threshold |
|---|---|---|
| Ad spend pacing | Meta/Google campaign view | >20% above/below daily target |
| Cost per purchase (CPA) | Ads Manager | >30% above 7-day average |
| Campaign status | Ads Manager | Unexpectedly paused / reset |
| Shopify order volume | Shopify dashboard | >30% drop vs same day last week |
| Website errors | Shopify / analytics tool | Significant drop in checkout rate |
This is the most important operating cadence in D2C performance marketing. Weekly is granular enough to catch problems early and broad enough to see patterns beyond daily noise.
Weekly Profitability Metrics:
| Metric | Formula | Target | Decision It Drives |
|---|---|---|---|
| CM2 per campaign | Net Rev − COGS − Shipping − Returns − Fees − Ad Spend | Category-specific | Scale / Hold / Kill |
| POAS per campaign | Gross Profit ÷ Ad Spend | >1.2x for most | Scale / Hold / Kill |
| Return rate by campaign | Returns ÷ Total Orders | <15% general | Brief / Audience change |
| MER | Shopify Net Rev ÷ Total Spend | 2.8–5.0x | Macro efficiency flag |
CM2 Targets by Category (Weekly Reference):
| Category | Target CM2 | Minimum Viable | Kill Signal |
|---|---|---|---|
| Beauty / Skincare | 25–40% | 15% | <8% |
| Health / Supplements | 30–45% | 18% | <10% |
| Apparel / Fashion | 15–28% | 10% | <5% |
| Food & Beverage | 12–22% | 8% | <3% |
| Home / Lifestyle | 18–28% | 12% | <6% |
| Electronics | 8–15% | 5% | <2% |
Monthly is where you assess whether the business model is working, not just whether the campaigns are performing.
1. Revenue Quality
Net revenue (post-returns), AOV trend, revenue by channel, overall return rate.
2. Profitability
Gross Margin %, CM1 by SKU, blended CM2 %, blended POAS.
3. Marketing Efficiency
MER trend, marketing spend as % of net revenue, cost per new customer.
4. Customer Quality
30-day & 90-day repeat purchase rates, LTV:CAC ratio, average customer lifespan.
Quarterly is where you zoom out and ask whether your D2C model is working at its current scale, and what needs to change structurally.
A D2C dashboard is not a collection of every metric available. It's a structured set of questions about today's operations, this week's profitability, this month's business health, and this quarter's strategic direction answered by the right data at the right frequency.
Dashboards don't improve businesses. Decisions do. Build the dashboard that makes the right decisions obvious.
Key Takeaway
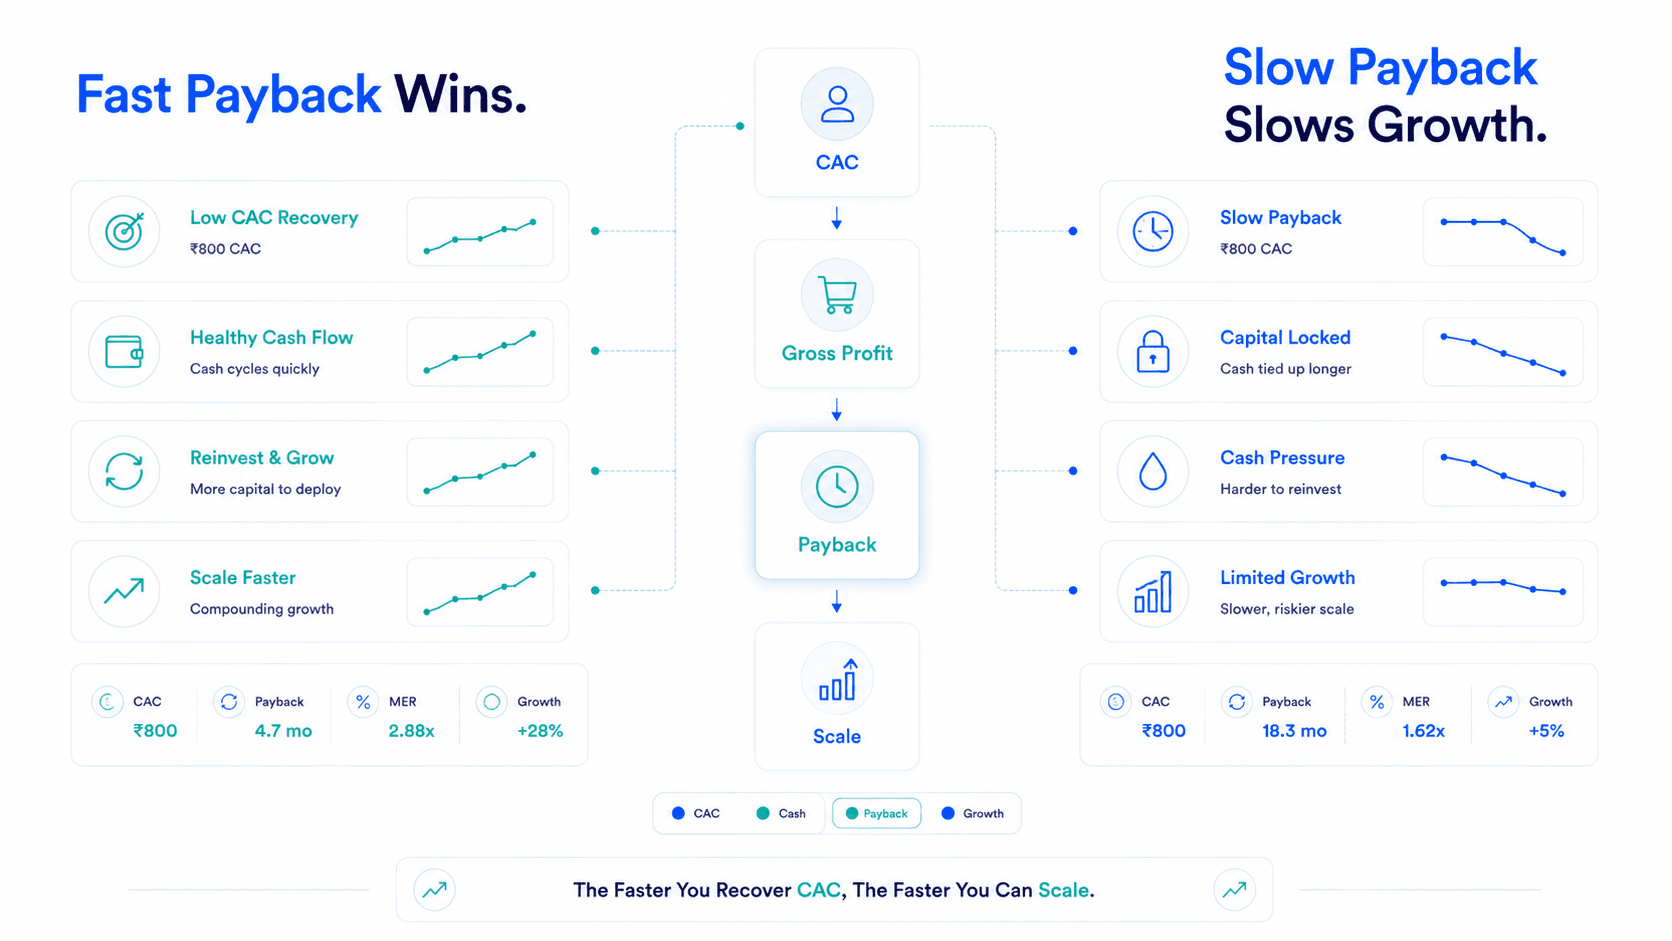
Build the four layers. Track the metrics that drive decisions, not the ones that feel good to watch. And anchor every number that matters to your Shopify net revenue, not your platforms' attributed claims.
Frequently Asked Questions
The most critical: CM2 per campaign, POAS, MER, new customer CAC (return-adjusted), return rate by campaign, Shopify net revenue, gross margin %, 90-day repeat purchase rate, LTV:CAC ratio, and CAC payback period. Organise them by decision frequency: daily for anomaly detection, weekly for performance management, monthly for business health, quarterly for strategic review.
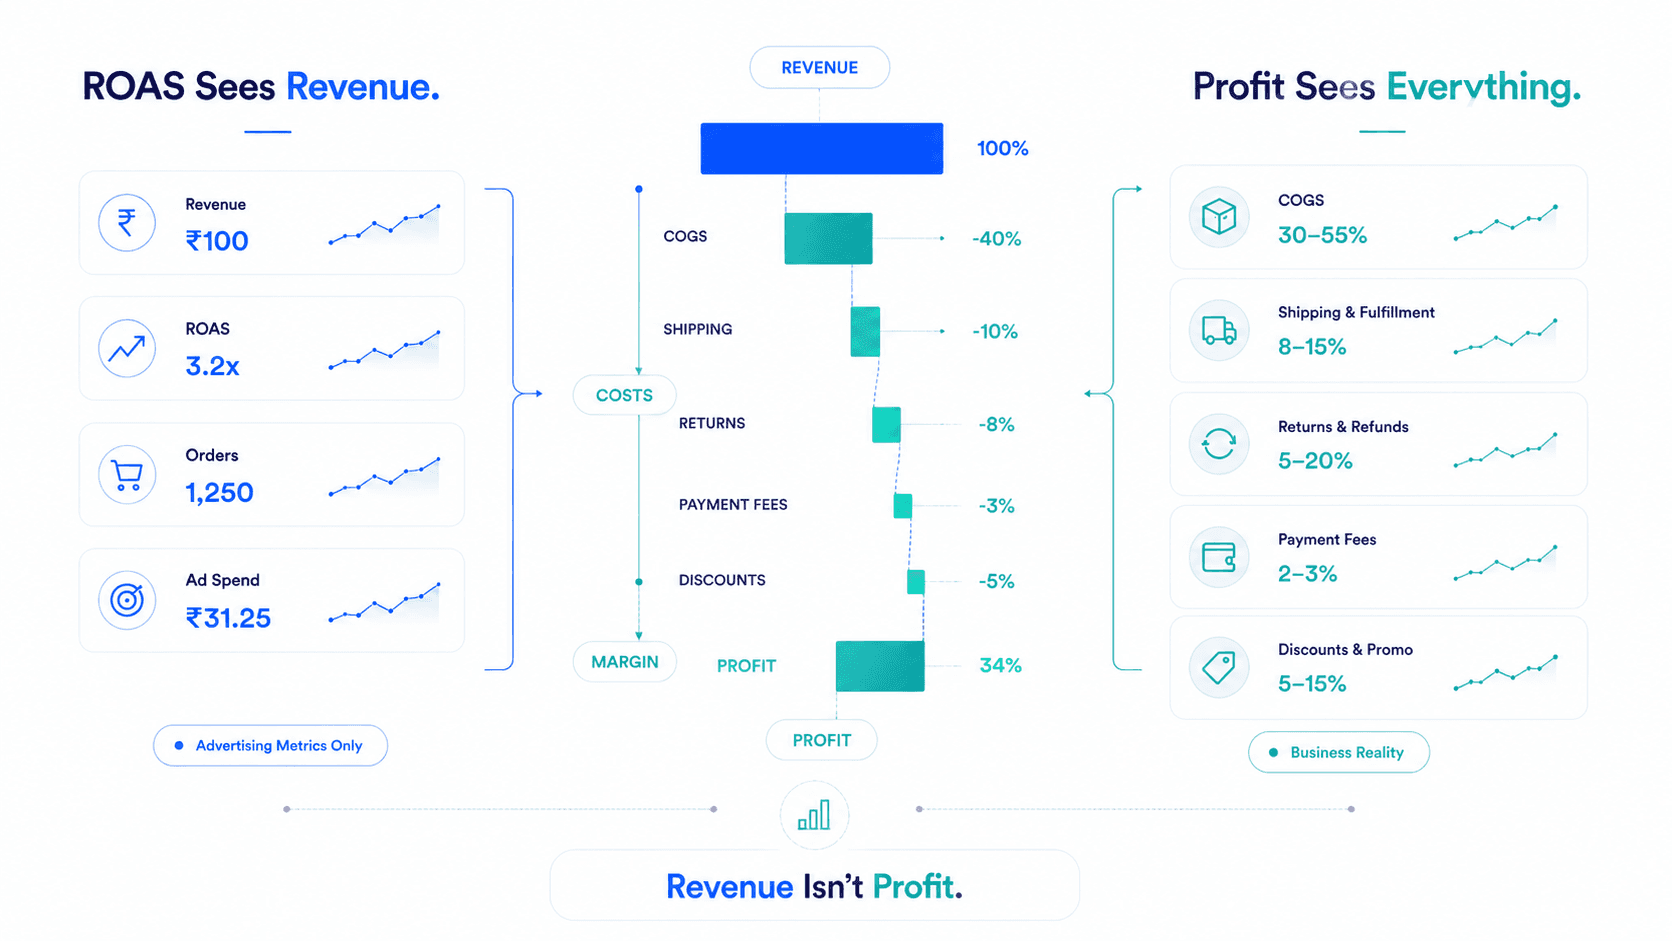
CM2 (Contribution Margin 2) = Net Revenue − COGS − Shipping − Returns − Payment Fees − Ad Spend. It measures what a specific campaign contributed to the business after every variable cost. It's the primary campaign-level decision metric, determining whether to scale, hold, or kill a campaign based on real profitability rather than platform ROAS.
POAS (Profit on Ad Spend) = Gross Profit ÷ Ad Spend. It's the single-number profitability verdict on advertising. A POAS above 1.0 means the campaign is generating more gross profit than it costs. It belongs on the dashboard because ROAS, the metric platforms report, measures revenue efficiency, not profit.
Daily for operational anomalies (5 minutes). Weekly for campaign profitability and marketing efficiency decisions (30–45 minutes). Monthly for business health and unit economics (1–2 hours). Quarterly for strategic channel mix and cohort performance (2–3 hours). Different metrics belong at different frequencies.
Flable connects Shopify revenue, Meta and Google ad spend, COGS inputs, and returns data to calculate CM2, POAS, MER, and new customer CAC in real time, without manual spreadsheet reconciliation. Your complete D2C KPI dashboard is live every morning.
CM2, POAS, MER, CAC all in one place. Automatic.
Start Measuring Profitability →Setup in 48 hours · No credit card required · Backed by Microsoft & NVIDIA