Dashboard & Analytics
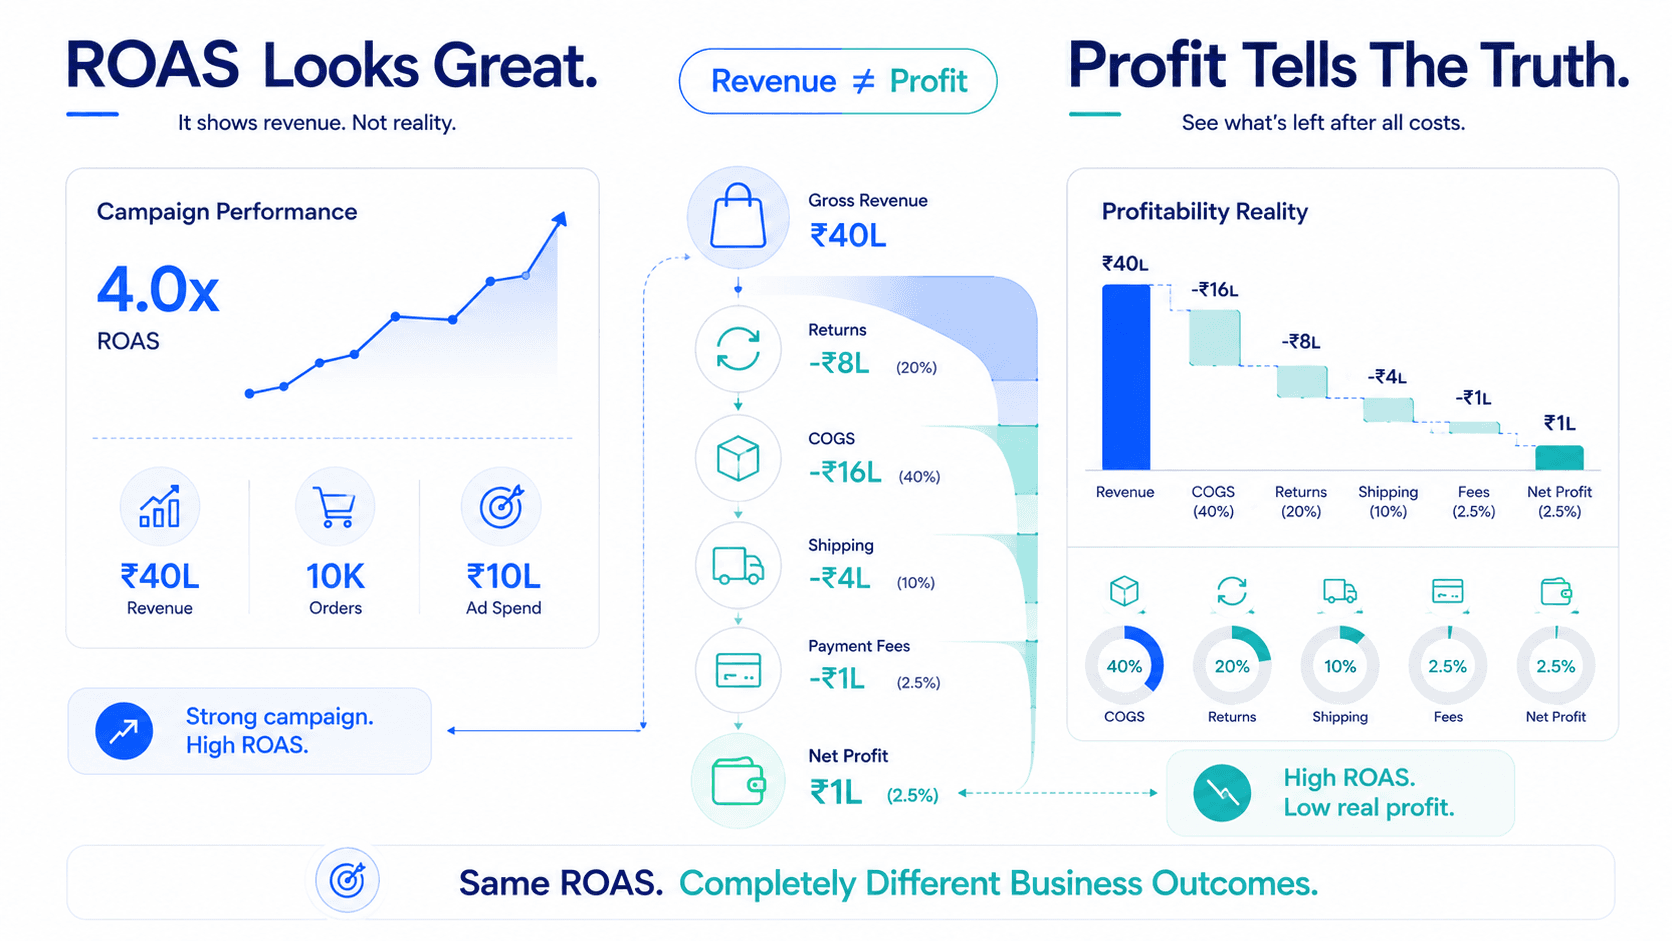
Return on Ad Spend answers exactly one question: how much revenue did this ad generate relative to what it cost? That's it. It says nothing about whether that revenue survived contact with the rest of your business, the cost of the product itself, the fee your payment processor took, the box and the courier, the discount code the customer used, or the return that came back three weeks later.
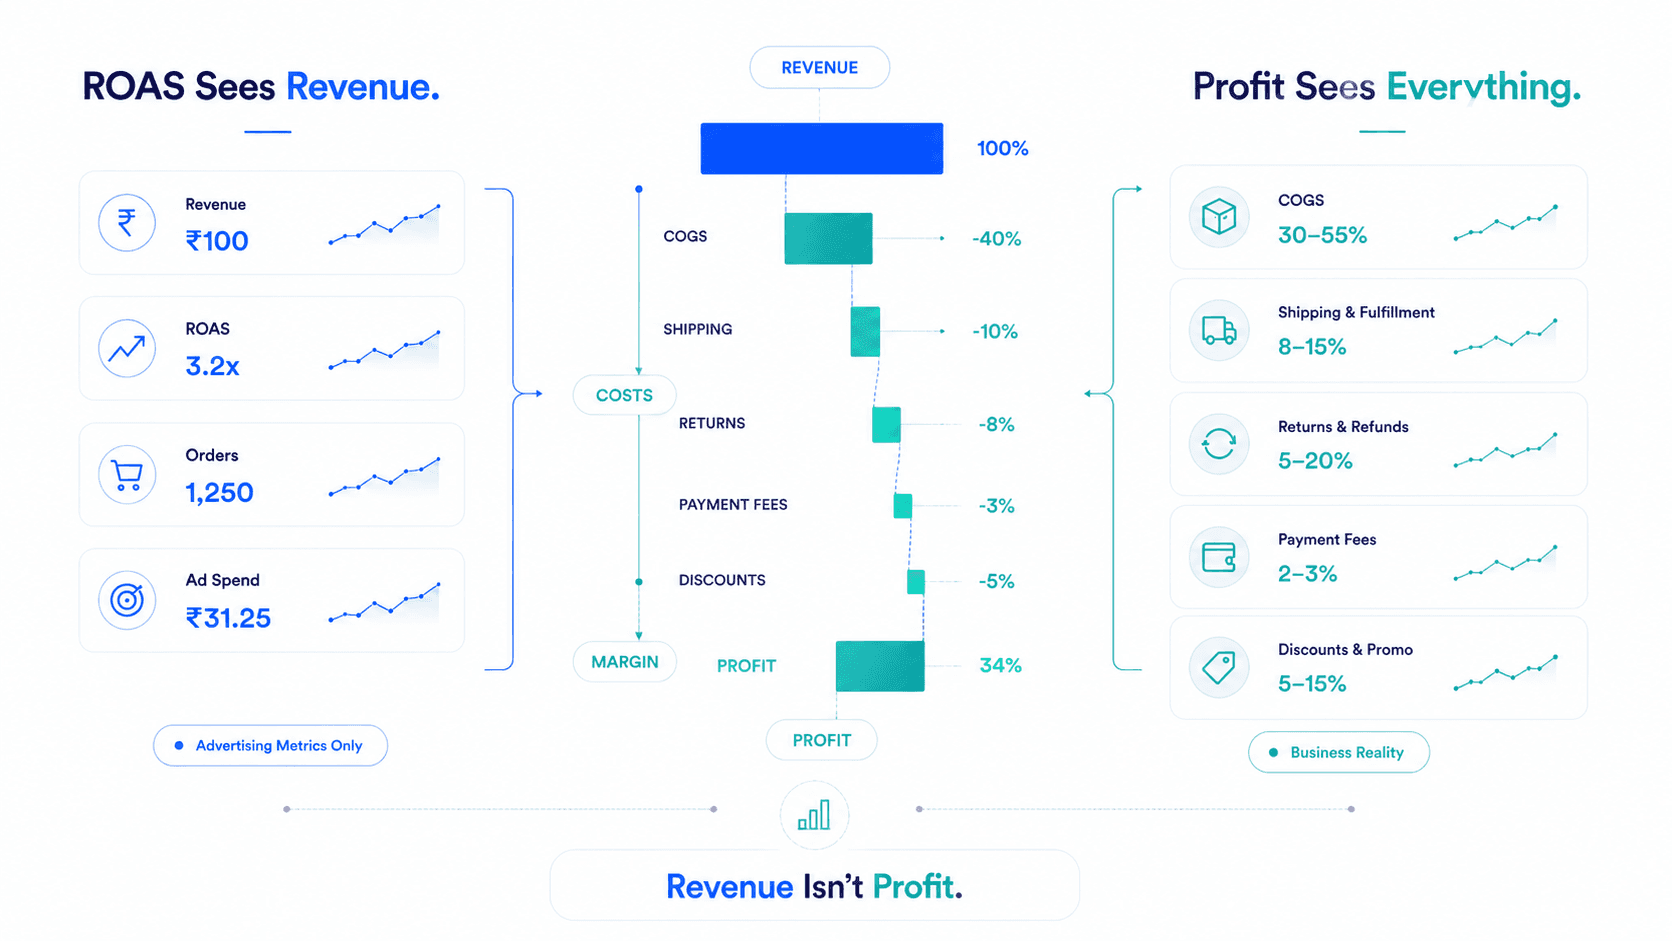
This is why so many D2C brands feel like their numbers "don't add up." It's not a bug in your reporting. It's a structural limitation of the metric itself. ROAS was designed by advertising platforms to measure advertising, not to measure your business.
With customer acquisition costs up 40–60% over the past two years and Meta CPMs rising roughly 18–20% year over year in 2026, the margin for error created by these hidden costs has shrunk considerably. A cost stack that used to be a rounding error can now be the entire difference between a profitable channel and a loss-making one.
This guide walks through every major hidden cost ROAS ignores, in the order they typically hit a P&L, with a full worked example at the end.
ROAS formula: Ad Revenue ÷ Ad Spend.
Notice what's absent from that formula: product cost, fulfillment, fees, discounts, and returns. Every one of these categories can independently turn a "profitable" ROAS into an unprofitable business outcome. Worse, they compound a brand can be hit by two or three of them simultaneously without realizing it, since each cost typically lives in a different system (Shopify, the payment gateway, the 3PL, the discount engine) with no single place pulling them together.
COGS is the most obvious and most commonly underestimated hidden cost. It includes:
Why it's missed: ROAS is calculated purely from ad platform and revenue data, COGS typically lives in an inventory or accounting system that never talks to Meta Ads Manager. Many brands also use a single blended COGS percentage across their entire catalog, which masks large differences between hero SKUs and long-tail products.
Every transaction, regardless of ROAS, loses roughly 2–3% to payment processing, sometimes more for international cards, Buy Now Pay Later options, or high-risk category surcharges. On a $60 order, that's $1.20–$1.80 gone before any other cost is considered. At scale, across thousands of orders monthly, this becomes a meaningful five- or six-figure annual cost that never appears in ad reporting.
Shipping and fulfillment often represents 8–15% of order value once you include:
Brands offering free shipping above a certain order value frequently absorb this cost silently, and it rarely shows up anywhere near the ad performance dashboard where ROAS lives.
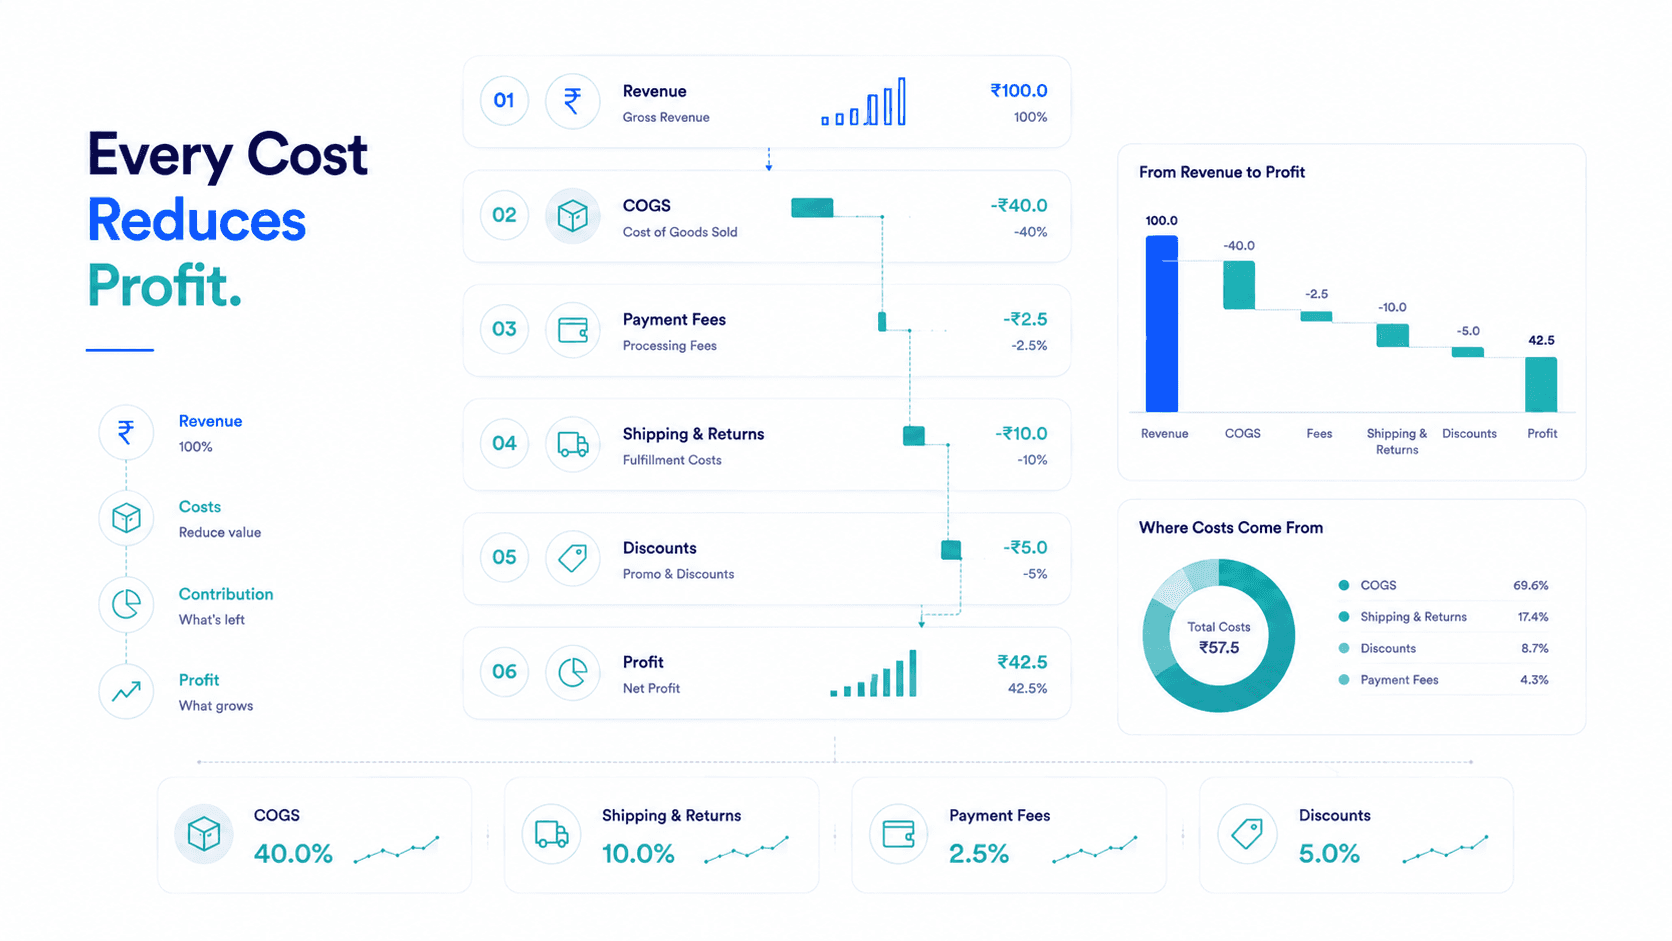
Ad platforms report gross revenue at the transaction's list price in many setups, not always net of the discount actually applied. A 20%-off welcome code effectively means your "won" customer generated 20% less real revenue than what shows up in some reporting views a distortion that widens further during sale periods, when discount usage and ad spend often both spike simultaneously.
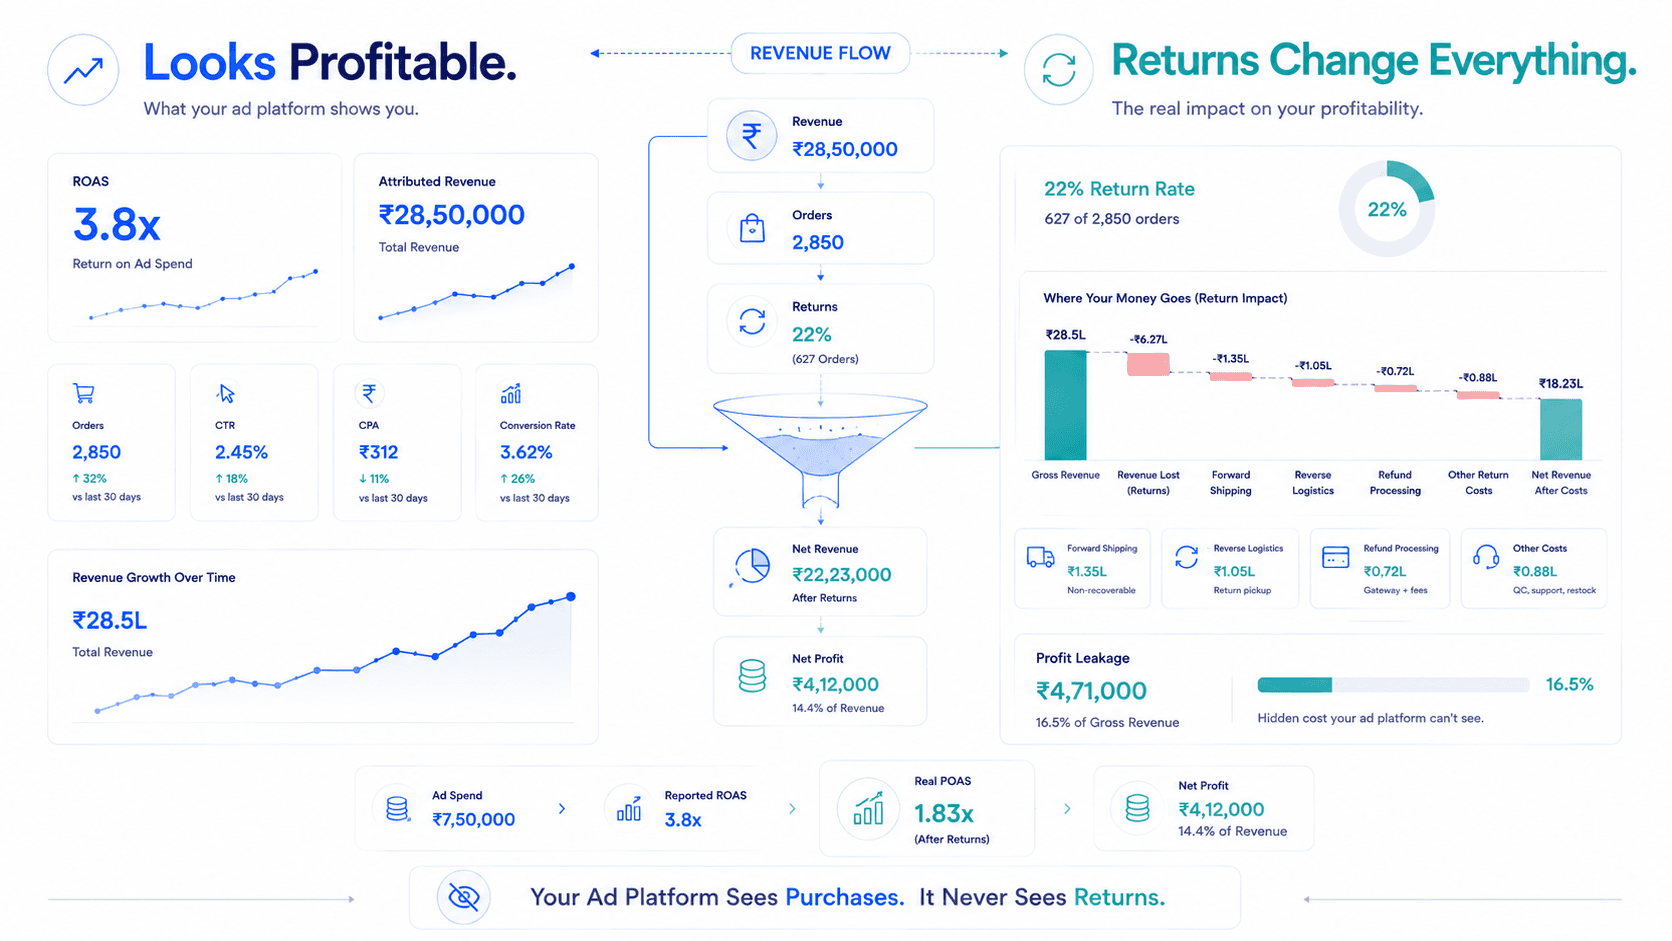
This is one of the most expensive and most delayed hidden costs, because it happens after the ROAS number has already been reported and often already acted on.
Apparel and footwear categories frequently see return rates well above 15–20%.
A return typically costs more than just the refunded amount return shipping, restocking labor, and often a partial write-down on damaged or unsellable inventory all add up.
Chargebacks (disputed payments) carry an additional processing penalty fee on top of the lost revenue.
Why it's missed: Attribution and ROAS are calculated at the point of purchase. Nothing in Ads Manager updates retroactively when a return happens three weeks later the campaign still shows the original "win."
Every order carries a small implicit cost in customer support order status questions, sizing help, return processing, and dispute resolution. This is rarely allocated per-order in most reporting, but categories with higher support volume (electronics, apparel with sizing complexity) carry meaningfully higher overhead than simpler categories like consumables.
The final hidden "cost" isn't a cash cost at all, it's a measurement distortion. Because of iOS privacy changes, Meta increasingly relies on modeled conversions to estimate attribution, and multiple industry studies (including analysis from Triple Whale and ProfitMetrics) have found that in-platform ROAS commonly overstates true incremental revenue. This means that even before any of the cost categories above are applied, the "revenue" side of the ROAS equation may already be inflated.
| Hidden Cost | Typical Range (% of Revenue) | Where It Lives | Visible in ROAS? |
|---|---|---|---|
| COGS | 30–55% | Inventory / accounting system | No |
| Payment Processing | 2–3% | Payment gateway | No |
| Shipping & Fulfillment | 8–15% | 3PL / logistics system | No |
| Discounts / Promo Codes | 5–15% (varies by season) | Discount engine | Partially, if net revenue is used |
| Returns & Chargebacks | 5–20% (category-dependent) | Order management system | No — recorded after the fact |
| Customer Service Overhead | 1–3% | Support platform | No |
| Attribution Inflation | Variable, often 10–30% overstatement | Ad platform modeling | Actively distorts the number itself |
Take a $100 apparel order attributed to a Meta ad with a reported 4x ROAS on a $25 ad cost.
Allocated return-rate risk (18% category return rate, 65% average refund): −$9.95
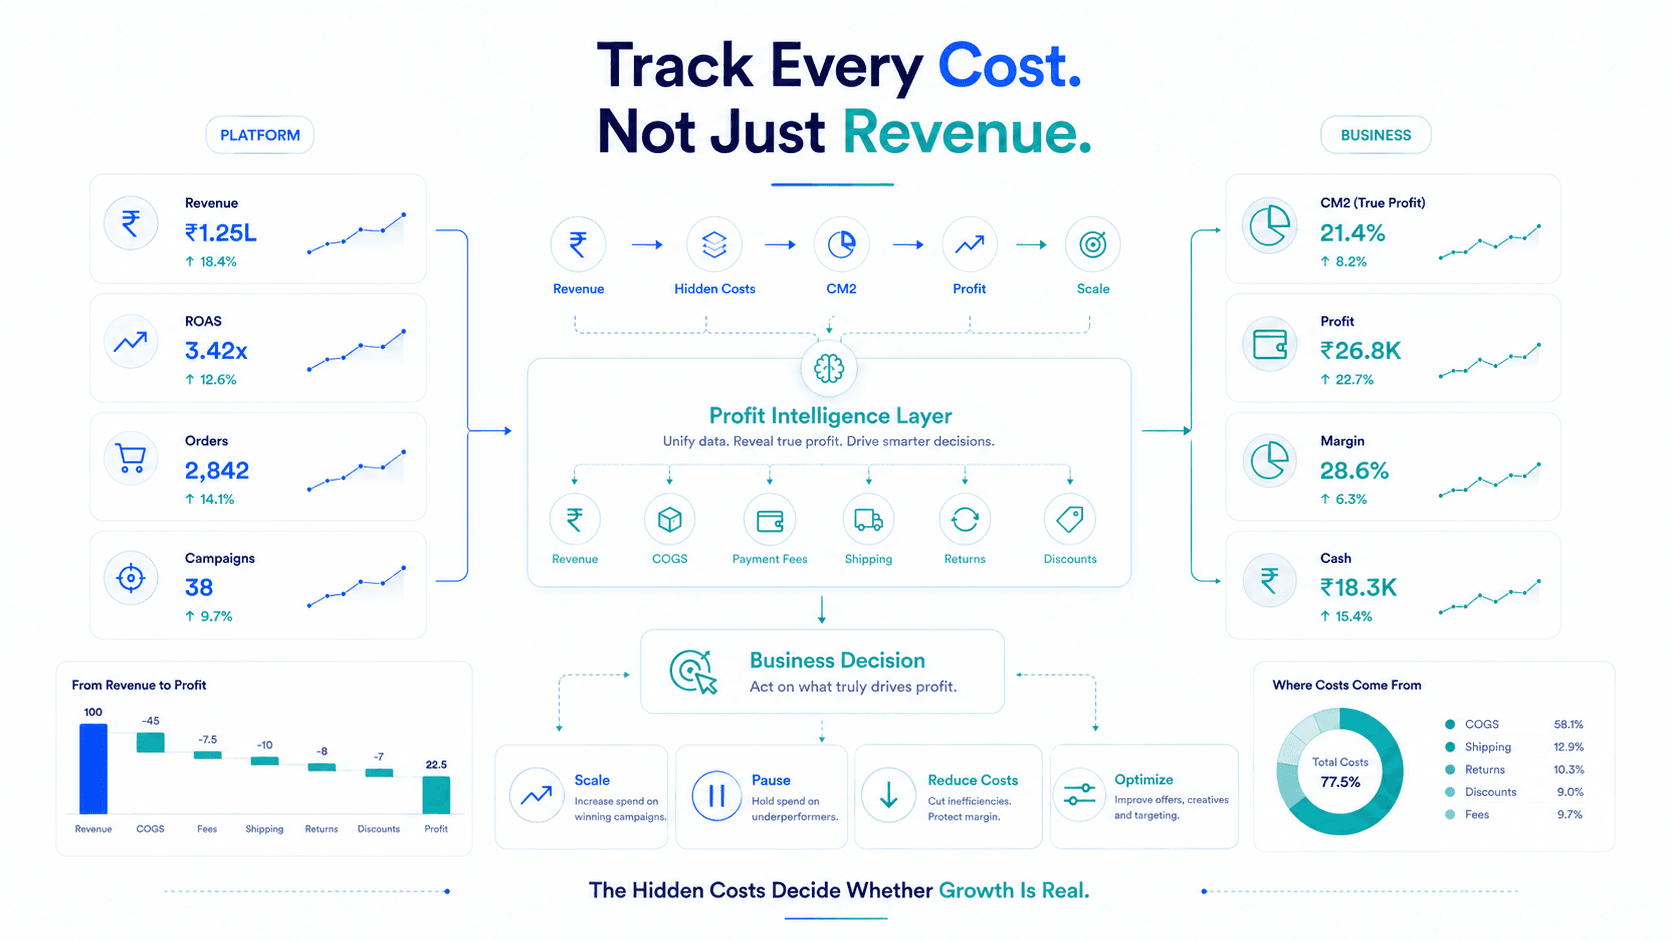
Remaining contribution profit: roughly $15.15 against a $25 ad cost — a POAS well below 1.0x, despite the headline 4x ROAS looking impressive in Ads Manager.
This is the exact mechanism behind the common founder complaint: "my ROAS is great but I'm not seeing the profit in the bank."
Using a single blended COGS percentage across an entire catalog instead of SKU-level costs.
Ignoring category-specific return rates, treating apparel and consumables as if they behave the same way.
Forgetting to net out discounts before calculating true revenue.
Not accounting for return shipping costs, only the refunded product value.
Treating attribution inflation as noise rather than a real, quantifiable distortion worth cross-checking against MER.
Maintain SKU-level COGS and update it whenever supplier or freight costs change.
Pull payment processing fees directly from your gateway rather than estimating a flat percentage.
Build category-specific return-rate assumptions into every profitability model.
Calculate net-of-discount revenue as the baseline for any profitability metric, not gross list price.
Reconcile ad-platform-reported ROAS against blended MER regularly to catch attribution drift.
Automate the pipeline, connecting Shopify, your payment gateway, and ad platforms into a single profitability view removes the manual reconciliation that causes most of these costs to go unnoticed in the first place.
Key Takeaways
Frequently Asked Questions
ROAS ignores cost of goods sold, payment processing fees, shipping and fulfillment, discounts, returns, chargebacks, and customer service overhead.
Because ROAS only compares revenue to ad spend, it doesn't subtract any of the real costs required to deliver and support that sale.
Beyond the refunded amount, returns typically add return shipping, restocking labor, and potential inventory write-down costs, which can total well beyond the face value of the refund.
Yes, at 2–3% per transaction, payment fees can represent a significant five- or six-figure cost annually for growing brands, none of which shows up in ROAS.
It depends on platform reporting settings, but many setups report gross revenue, meaning discounted sales can appear more valuable than they truly are.
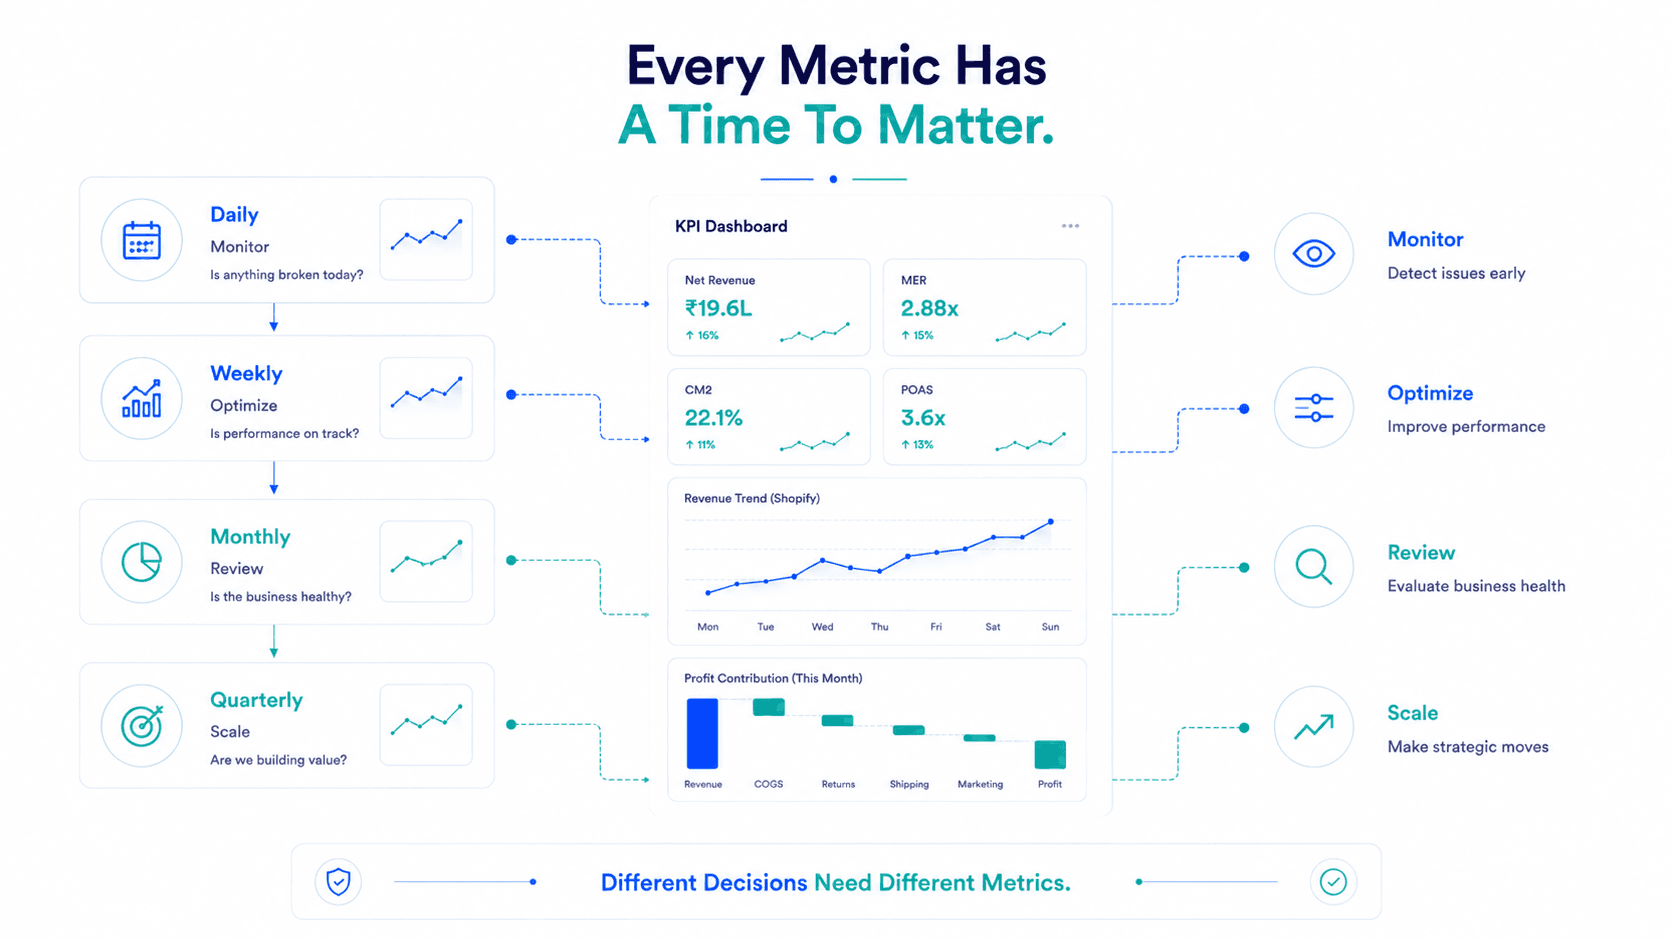
POAS (Profit on Ad Spend) and contribution margin (CM1/CM2) both explicitly subtract these cost categories, unlike ROAS.
It's not a cash cost, but it distorts the revenue side of the ROAS equation, effectively inflating performance before any real costs are even applied.
Not necessarily, discounts can be a valid growth lever, but they should always be reflected in net revenue calculations rather than ignored in profitability reporting.
Many growing brands now use AI-powered profitability platforms that automatically pull COGS, fees, and returns data alongside ad spend to surface true profitability without manual spreadsheet work.
COGS is typically the largest by percentage, but returns and chargebacks are often the most dangerous because they're invisible at the time ROAS is first reported. If you're still optimizing for ROAS alone, you're only seeing part of the picture. Platforms like Flable AI help D2C brands surface every hidden cost — COGS, fees, returns, and discounts — against real ad performance, so profitability stops being a guessing game.
Real contribution margin per campaign and channel. The number that tells you whether to scale.
Start Measuring Profitability →Setup in 48 hours · No credit card required · Backed by Microsoft & NVIDIA