Margin Protection
Revenue is vanity. Contribution margin is sanity. Most D2C founders nod at it. Very few actually measure it — because nobody ever explained the full mechanics.

You've heard it. Most D2C founders nod at it. Very few actually measure it — because nobody ever explained the full mechanics of how to calculate it, what the two levels mean, and why the gap between them is where every scaling decision should live.
This is that guide. Complete. Practical. Built for D2C brands spending ₹2L–₹50L/month on paid ads.
Contribution Margin 1 (CM1) is pure product-level profitability. Revenue minus the direct cost of the product itself.
CM1 = Selling Price − COGS (Cost of Goods Sold)
COGS includes everything directly tied to producing and delivering one unit: raw materials, manufacturing labour, packaging, quality control allocation, and inbound freight from your manufacturer to warehouse. CM1 tells you one thing clearly: before you spend a single rupee on marketing, does this product have enough margin to support paid acquisition?
If CM1 is 30% on a ₹999 product, you have ₹300 per unit to fund everything else: ads, shipping, returns, payment processing, and the profit you actually want to keep.
Contribution Margin 2 (CM2) is campaign-level profitability — the number that answers: "Is this campaign actually making money?"
CM2 = Revenue − COGS − Shipping − Returns Cost − Ad Spend − Payment Fees
CM2 takes the product margin (CM1) and subtracts every variable cost that sits between a sale and actual profit: outbound shipping, returns processing, return-adjusted revenue loss, ad spend attributed to the campaign, and payment gateway fees.
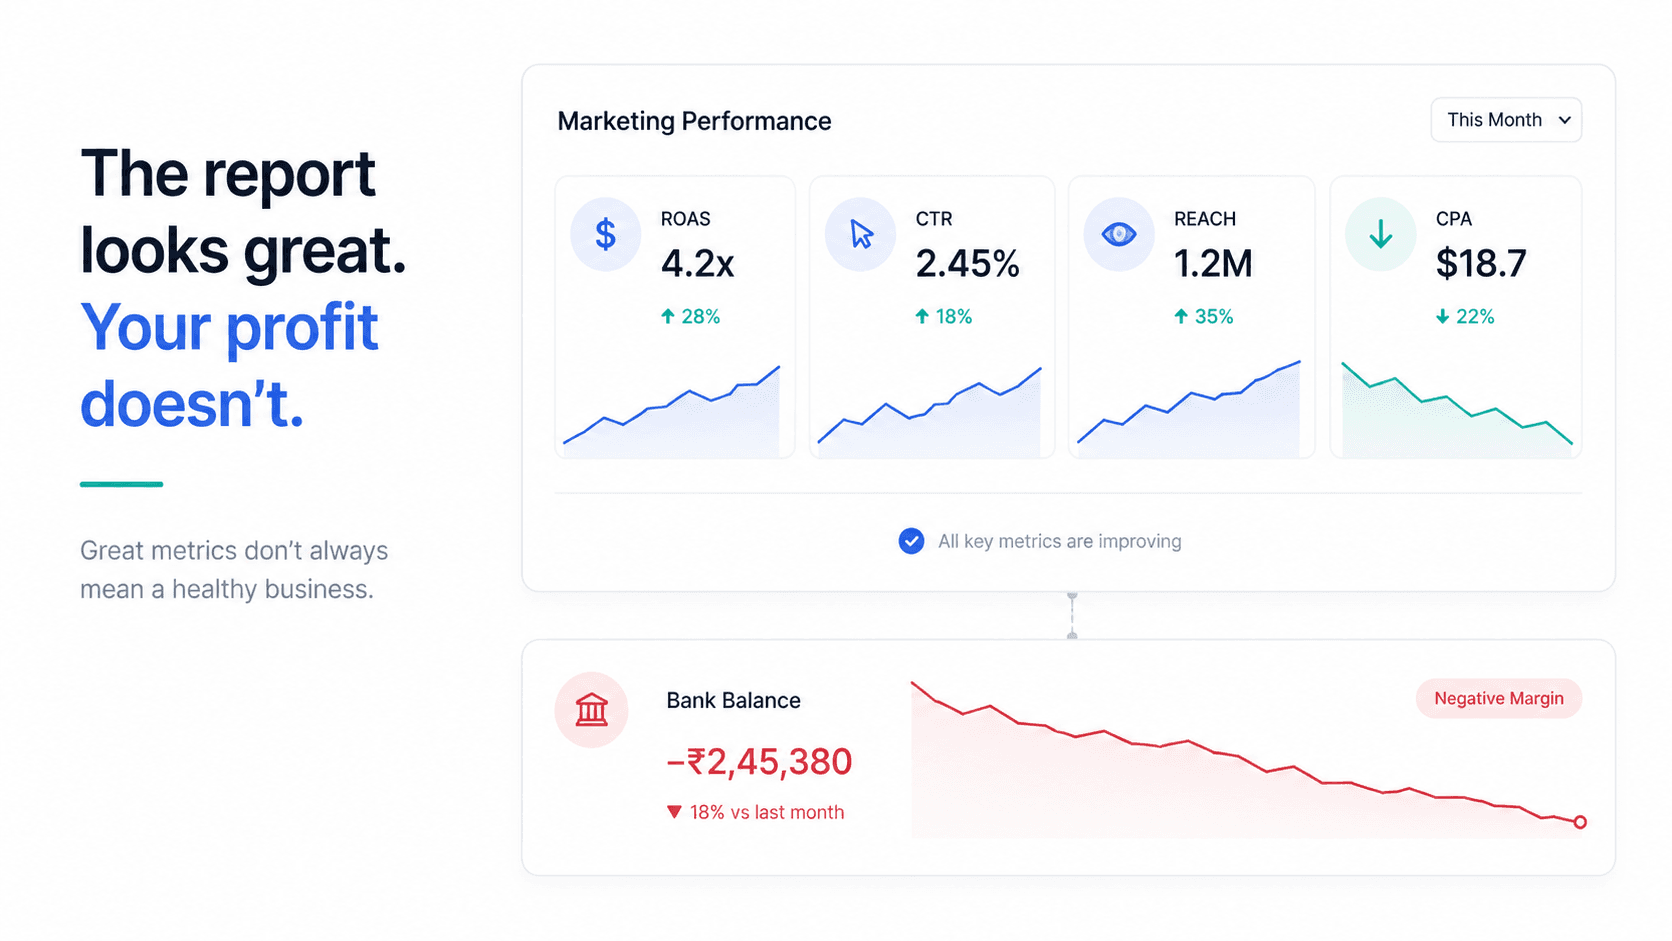
ROAS = Revenue ÷ Ad Spend. That's it. ROAS does not see COGS, does not see shipping cost, does not see return rates, and does not see payment processing fees. Two campaigns with identical 4x ROAS can have completely different CM2 profiles: one is highly profitable, one is losing money on every order.
Every D2C brand that has ever scaled profitably did it by knowing their CM2 per campaign — not their ROAS.

Step 1: Pull campaign-level revenue from your ad platform (Meta, Google) — this is gross revenue before returns.
Step 2: Apply return rate adjustment. Net Revenue = Gross Revenue × (1 − Return Rate). Return rates vary by campaign, not just by product.
Step 3: Calculate fulfilment cost per order — shipping cost per order from your logistics partner, plus returns processing cost (typically ₹80–150 per returned item).
Step 4: Apply payment processing fees (Razorpay, Stripe — typically 2–3% per transaction).
Step 5: The CM2 Formula: CM2 = Net Revenue − COGS − Shipping − Returns Processing − Ad Spend − Payment Fees
Gross revenue attributed: ₹18,00,000 · Return rate: 15%
Net revenue: ₹15,30,000 · COGS (45%): ₹8,10,000
Shipping (₹120 × 900 orders): ₹1,08,000 · Returns processing: ₹15,000
Payment processing (2.5%): ₹38,250 · Ad spend: ₹3,60,000
CM2 = ₹1,98,750 → CM2% = 13%
Platform ROAS: 5x. Looks excellent. CM2: 13% — adequate but returns are compressing margin significantly.
| Category | Strong CM1 | Adequate CM1 | At Risk |
|---|---|---|---|
| Beauty / Skincare | >60% | 40–60% | <40% |
| Health / Supplements | >65% | 45–65% | <45% |
| Apparel / Fashion | >50% | 35–50% | <35% |
| Food & Beverage | >40% | 25–40% | <25% |
| Home / Lifestyle | >45% | 30–45% | <30% |
| Electronics | >35% | 20–35% | <20% |
| Category | Target CM2 | Minimum Viable | Danger Zone |
|---|---|---|---|
| Beauty / Skincare | 25–40% | 15% | <10% |
| Health / Supplements | 30–45% | 18% | <12% |
| Apparel / Fashion | 15–28% | 10% | <6% |
| Food & Beverage | 12–22% | 8% | <5% |
| Home / Lifestyle | 18–28% | 12% | <8% |
| Electronics | 8–15% | 5% | <3% |
Done manually, CM2 calculation takes hours and goes stale immediately. Flable AI connects your Meta and Google ad spend, your Shopify revenue and returns data, and your COGS inputs to calculate CM1 and CM2 per campaign automatically — in real time.
CM1 tells you whether your product can support paid acquisition. CM2 tells you whether your campaigns are actually generating profit. Together, they replace the incomplete picture that ROAS alone provides. Calculate both. Calculate them per SKU and per campaign. Update them regularly. Make every scaling decision against CM2 — not ROAS. That is what separates D2C brands that grow profitably from D2C brands that just grow.
Frequently Asked Questions
CM1 is product-level profitability — revenue minus COGS. It measures whether a product has enough margin to support advertising before any marketing costs. CM2 is campaign-level profitability — CM1 minus shipping, returns, and ad spend. It measures whether a specific campaign is generating real profit after every variable cost.
Manufacturing cost, packaging, quality testing allocation, and inbound freight from manufacturer to warehouse. Do not include outbound shipping, returns, or marketing costs in COGS — those belong in the CM2 calculation.
It varies by category. Beauty and supplements should target 25–40%. Apparel should target 15–28%. Electronics are viable at 8–15%. Any CM2 below 5–8% at scale indicates the business is growing revenue while destroying margin — typically a sign of over-reliance on discounts or high return rates.
Flable connects your ad spend data, Shopify revenue, returns portal, and COGS inputs to calculate real-time CM2 per campaign. It removes the manual reconciliation across multiple data sources and ensures your CM2 is always current — not based on last week's snapshot.
ROAS measures revenue against ad spend. It doesn't see your COGS, returns, or fulfilment costs. CM2 measures actual profit after all variable costs. Two campaigns with identical ROAS can have CM2 that differs by 30 percentage points — making completely opposite scaling decisions correct. CM2 reveals the business outcome; ROAS reveals the platform metric.
Real contribution margin per campaign and channel. The number that tells you whether to scale.
Start Measuring Profitability →