Profitability
10 Marketing Metrics Every D2C Founder Should Track Beyond ROAS
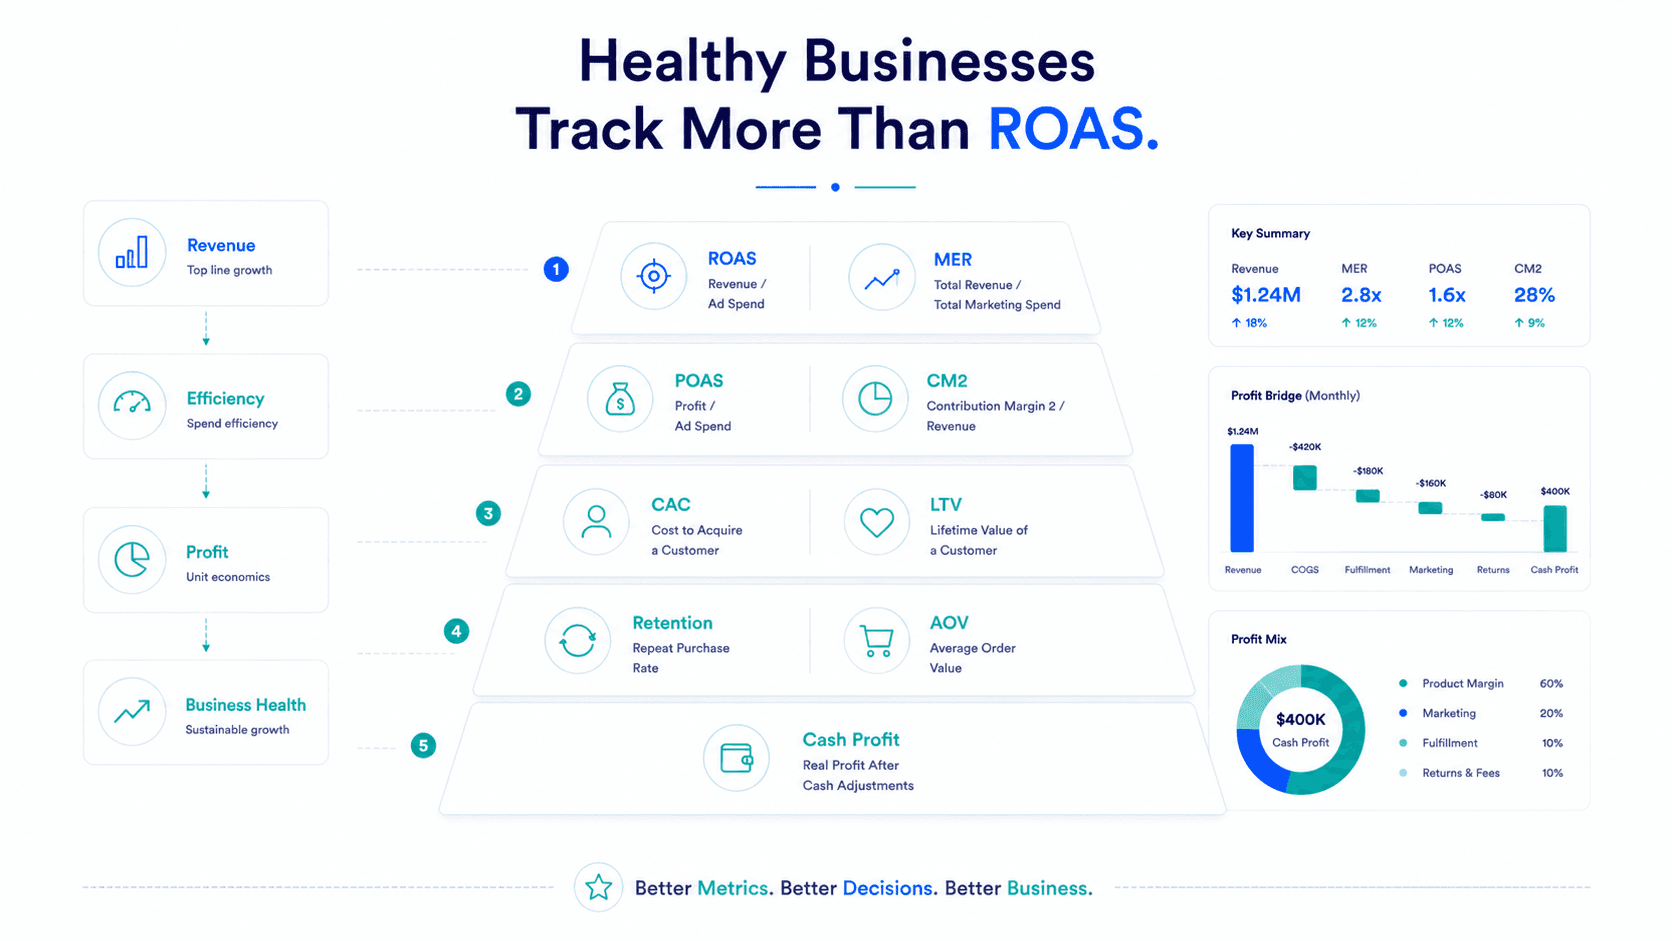
ROAS earned its place as the default performance marketing metric for good reason, it's fast, it's easy to calculate, and every ad platform reports it natively. But used alone, it answers a narrow question ("how much revenue per ad dollar?") while founders are really asking a much bigger one: "is this business actually getting healthier?"
That gap matters more in 2026 than it used to. Customer acquisition costs have risen 40–60% since 2023, Meta CPMs are up roughly 18–20% year over year, and margin pressure across nearly every D2C category has intensified. A single metric simply can't carry the weight of all the decisions founders need to make in this environment.
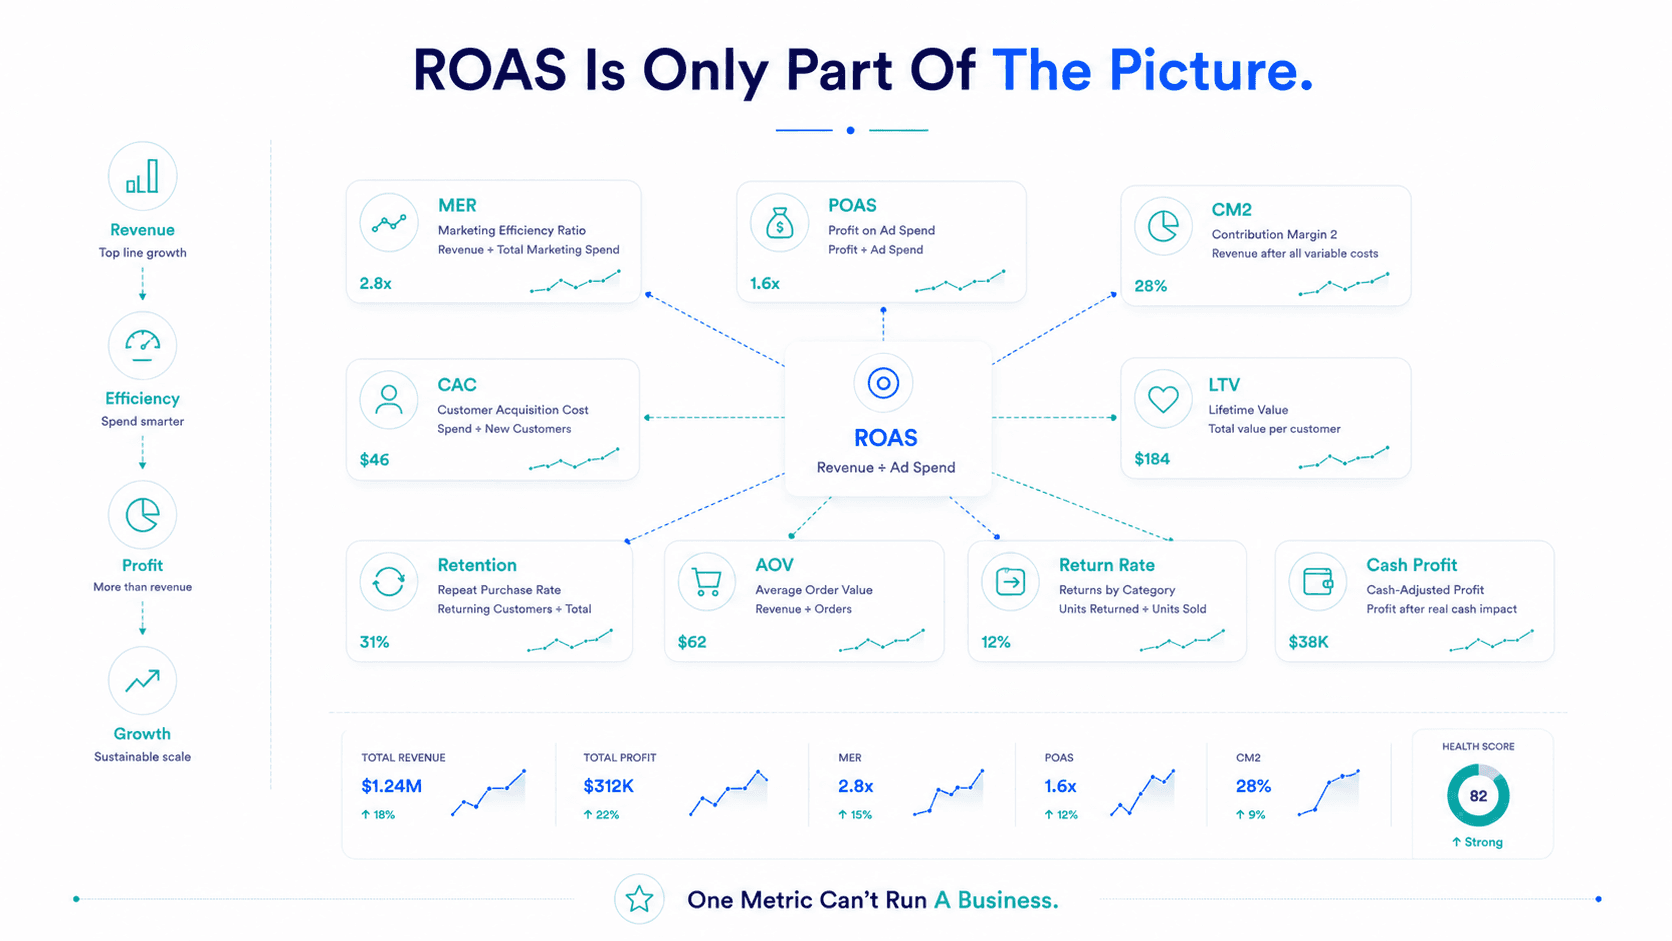
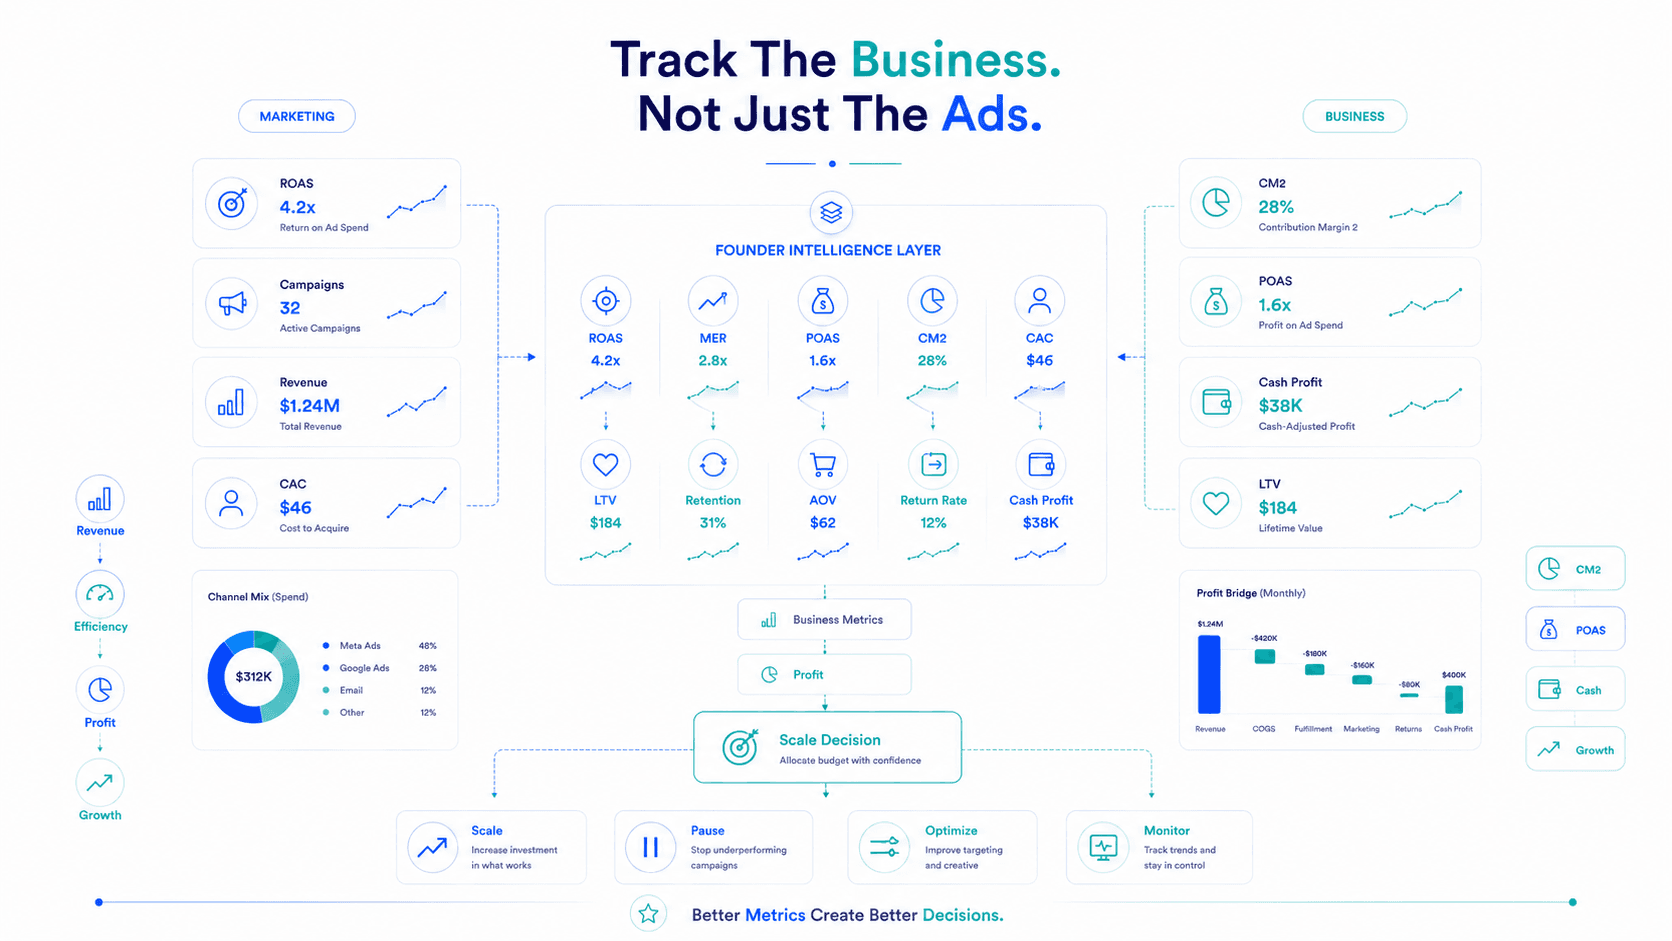
This guide lays out ten metrics, beyond ROAS, that together give a complete, honest view of marketing performance and business health, along with formulas, real context, and how each one should actually be used.
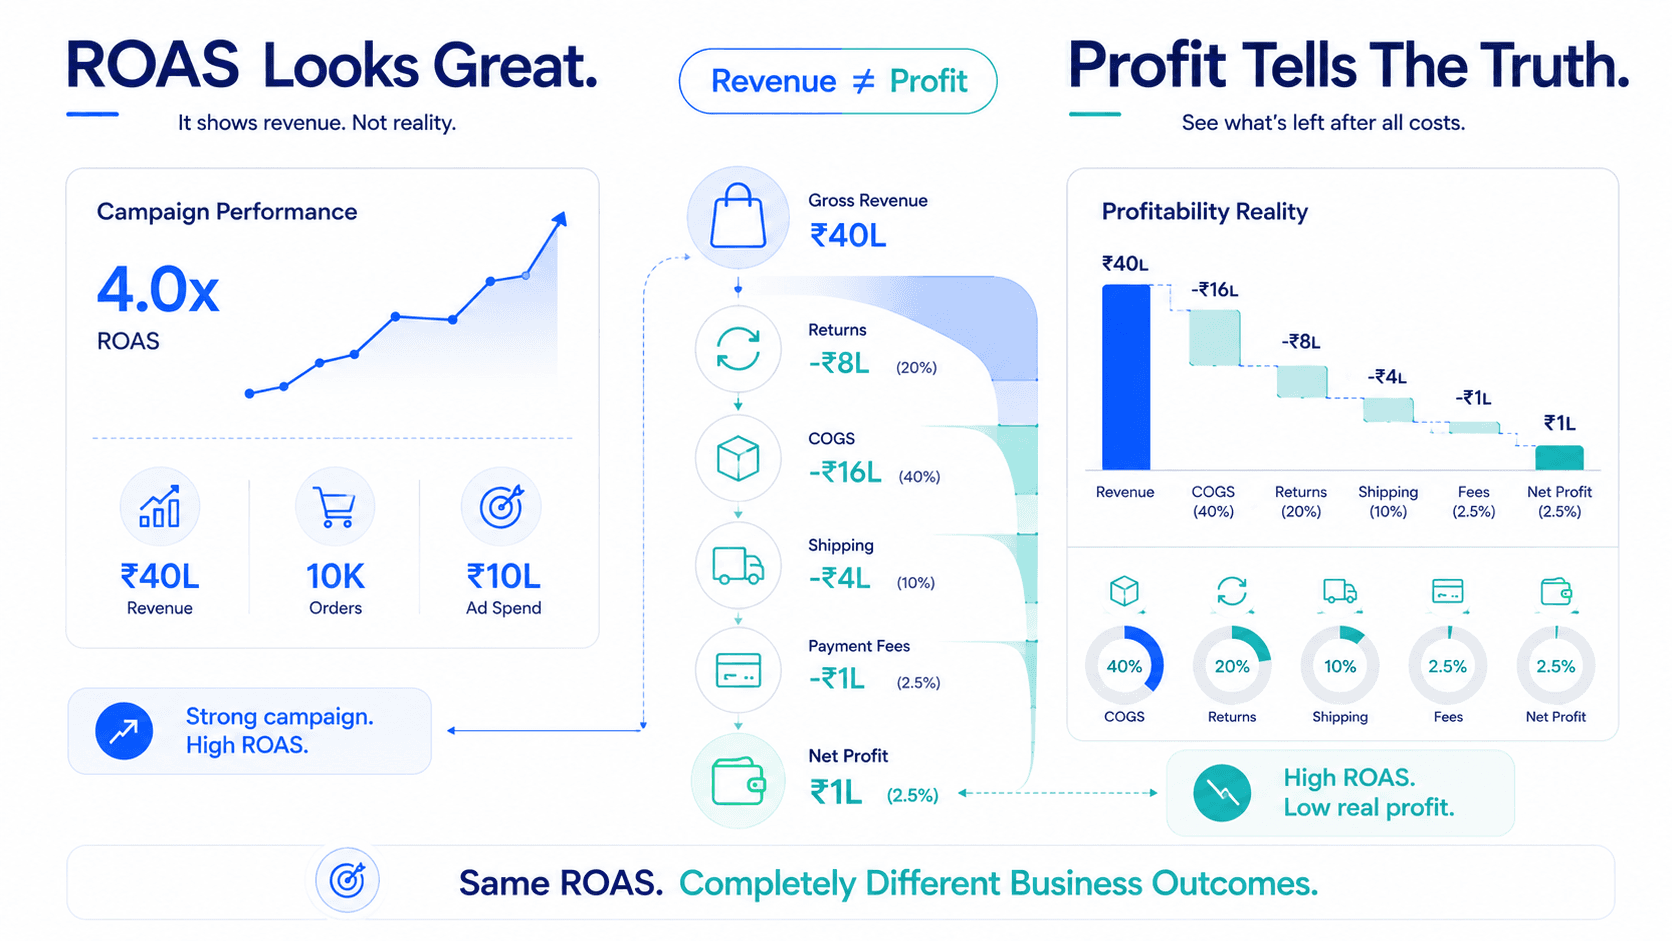
ROAS was designed by ad platforms to measure advertising efficiency, not business health. It has no visibility into product cost, fulfillment expense, discounting, returns, or customer retention, all of which materially affect whether a "high ROAS" business is actually thriving or quietly burning cash. The ten metrics below fill in exactly the gaps ROAS leaves open.
Formula: Total Revenue ÷ Total Marketing Spend (all channels)
MER corrects for the attribution overlap that inflates individual platform ROAS numbers, since it compares actual store-wide revenue against total marketing spend rather than trusting each platform's self-reported figures. A persistent gap between MER and summed channel ROAS is one of the clearest early signals of attribution inflation.
Formula: (Revenue − COGS − Variable Costs) ÷ Ad Spend
POAS is the metric that actually reflects profit rather than revenue per ad dollar. It should be tracked by product and campaign, not just blended account-wide, since a strong hero SKU can mask several unprofitable ones in a blended number. For a deeper breakdown, see our full guide, ROAS vs POAS vs MER.
CM1 = Revenue − COGS − direct fulfillment costs (shipping, payment fees)
CM2 = CM1 − variable marketing costs
CM2 is arguably the single most important number for assessing overall business health, since it shows whether the company generates enough margin, after both product and marketing costs to eventually cover fixed overhead and produce real profit.
Formula: Total Acquisition Spend ÷ New Customers Acquired
CAC has become one of the most scrutinized metrics in ecommerce, and for good reason, the average ecommerce CAC has climbed 40–60% between 2023 and 2025, with Shopify's 2026 Global Commerce Report putting the merchant-wide average at $318, up 16.1% year over year. Tracking CAC in isolation is less useful than tracking it against LTV, which brings us to the next metric.
Formula: Customer Lifetime Value ÷ Customer Acquisition Cost
This ratio answers the question CAC alone can't: is what you're spending to acquire a customer justified by what that customer is actually worth over time? Industry benchmarks commonly cited by marketing research suggest a healthy baseline ratio around 3:1, with top-performing brands reaching 8:1 or higher. A declining LTV-to-CAC ratio is often the earliest warning sign of an unsustainable growth strategy, even while ROAS still looks fine.
Formula: Returning Customers ÷ Total Customers (over a given period)
Retention is consistently one of the highest-leverage levers in ecommerce economics, a commonly cited benchmark suggests that a 5% increase in retention can lift profit by 25–95%, since it's typically five to seven times cheaper to retain an existing customer than acquire a new one. In DTC specifically, returning customers are frequently reported to generate the majority of overall brand revenue, making retention rate a critical counterbalance to acquisition-focused metrics like ROAS and CAC.
Formula: Total Revenue ÷ Number of Orders
AOV interacts closely with several other metrics on this list. A rising purchase count with a falling AOV, often driven by discount-heavy, bundle-focused campaigns, can quietly erode contribution margin even while ROAS and purchase volume both look healthy (a pattern explored in more depth in Why Your Meta Ads Are Getting Purchases But Not Profits).
Formula: Units Returned ÷ Units Sold (segmented by product category)
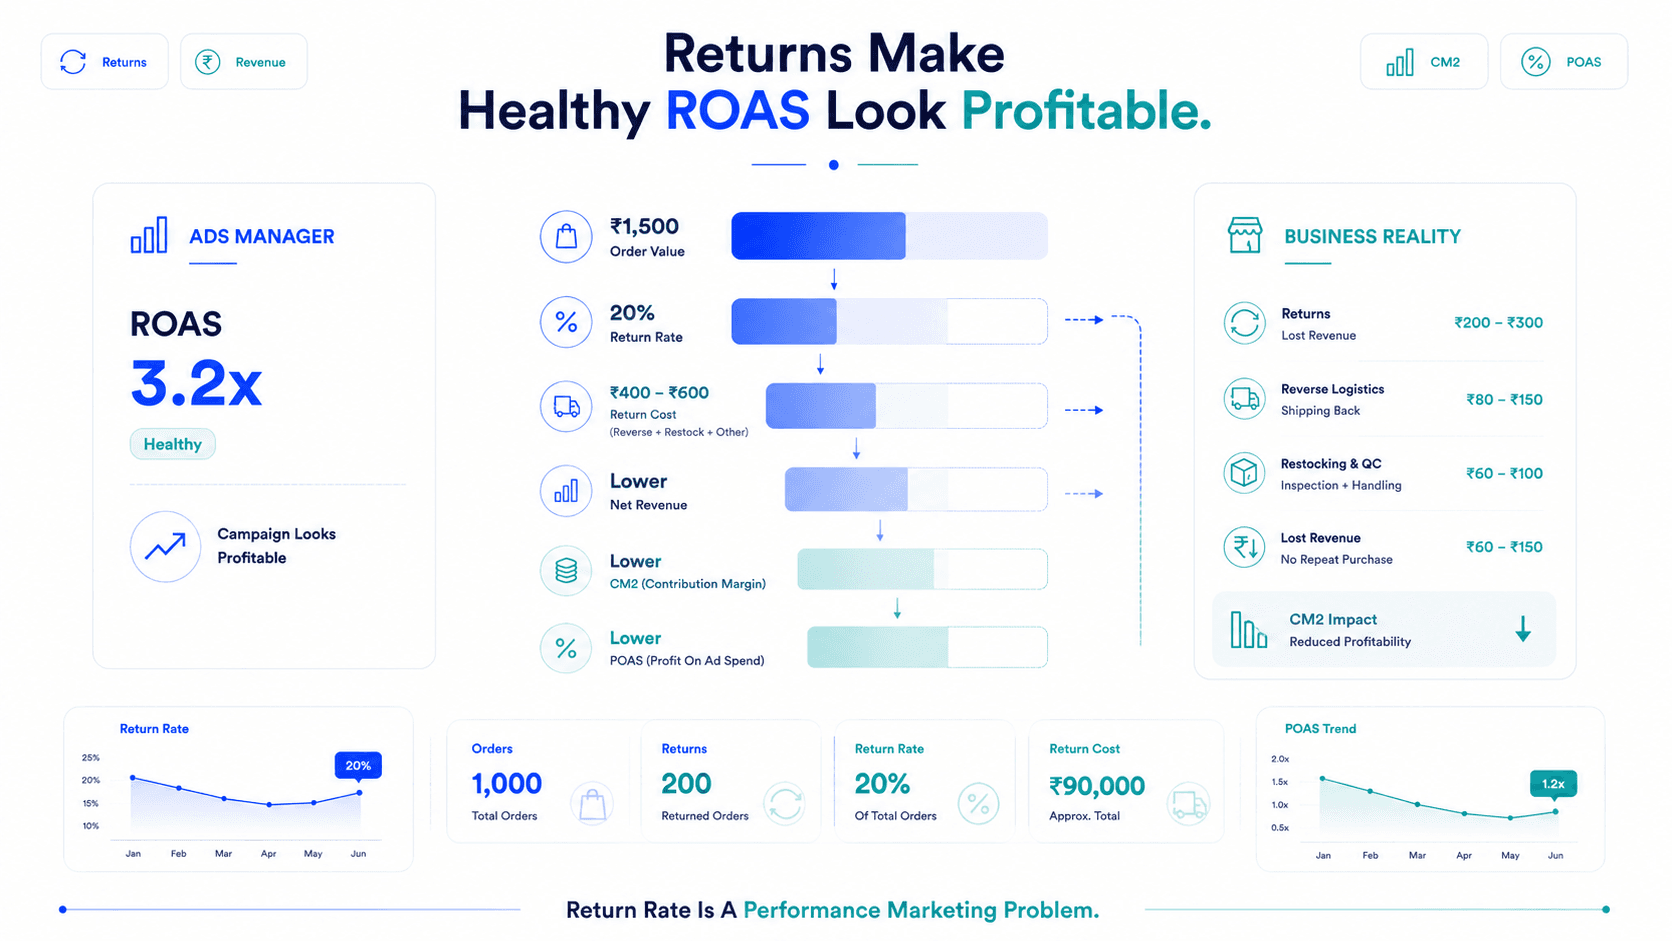
Return rate deserves category-level tracking, not a single blended number, since categories like apparel and footwear commonly see return rates well above 15–20%, while categories like consumables or beauty typically run much lower. Return rate directly affects realized profit, often reversing revenue that had already been counted as a "win" in ROAS and purchase reporting weeks earlier.
Formula: Reported Profit − (Pending Returns + Chargebacks + Payment Processing Delays)
This is the metric that finally reconciles reported performance with what's actually happening in the bank account, and it's frequently the most revealing number on a founder's dashboard — the one that explains why "the numbers look good but the cash doesn't match."
Formula: Conversion Rate (Test Group) − Conversion Rate (Holdout Group)
Incremental lift measures whether ad spend is truly causing additional sales, rather than simply appearing alongside conversions that would have happened anyway. Recent analysis of well-designed geo and holdout experiments found a median incremental return on ad spend around 2.3x, a figure that can diverge significantly from what standard platform attribution reports for the same campaigns, particularly for retargeting and branded search.
| # | Metric | Formula | What It Reveals | Review Cadence |
|---|---|---|---|---|
| 1 | MER | Total Revenue ÷ Total Marketing Spend | Overall marketing efficiency, attribution sanity check | Weekly |
| 2 | POAS | (Revenue − COGS − Variable Costs) ÷ Ad Spend | True profit per ad dollar | Weekly |
| 3 | CM1 / CM2 | Revenue − COGS − Costs (± Marketing Costs) | Overall business health | Monthly |
| 4 | CAC | Acquisition Spend ÷ New Customers | Cost efficiency of growth | Weekly |
| 5 | LTV : CAC | Lifetime Value ÷ CAC | Sustainability of growth strategy | Monthly |
| 6 | Retention Rate | Returning Customers ÷ Total Customers | Customer loyalty and repeat revenue strength | Monthly |
| 7 | AOV | Revenue ÷ Number of Orders | Basket size trends, discount impact | Weekly |
| 8 | Return Rate | Units Returned ÷ Units Sold | Category-level profit erosion | Monthly |
| 9 | Cash-Adjusted Profit | Reported Profit − Pending Returns/Fees | Reality check against bank balance | Monthly |
| 10 | Incremental Lift | Test Group CVR − Holdout Group CVR | True causal impact of ad spend | Quarterly |
Tracking all ten metrics but never connecting them, reviewing them in five different disconnected tools instead of one unified view.
Reviewing acquisition metrics weekly but retention and LTV only annually, missing early warning signs of unsustainable growth.
Using blended, account-wide numbers for POAS, contribution margin, and return rate instead of segmenting by product or category.
Ignoring incrementality entirely because it feels too complex, even though even simple holdout tests can meaningfully improve budget decisions.
Treating this as a one-time dashboard-building exercise rather than a system that needs regular COGS, cost, and fee data updates to stay accurate.
Group metrics by cadence: weekly (MER, POAS, CAC, AOV), monthly (CM1/CM2, LTV:CAC, retention, return rate, cash-adjusted profit), quarterly (incremental lift).
Segment POAS, return rate, and contribution margin by product or category, never rely on a single blended figure for scaling decisions.
Set explicit thresholds (e.g., "no budget increase without POAS above 1.2x and LTV:CAC above 3:1") so these metrics actively inform decisions rather than sitting passively in a report.
Reconcile cash-adjusted profit against reported profit monthly to catch drift from returns, chargebacks, or payment delays early.
Consider an AI-powered profitability platform to automate the data pipeline connecting Shopify, ad platforms, and payment gateways, since manually maintaining ten interconnected metrics in spreadsheets becomes unmanageable as a brand scales.
Key Takeaways
Frequently Asked Questions
POAS and contribution margin (CM2) are generally considered the most important, since they most directly reflect actual profit rather than revenue.
MER compares total revenue across all channels to total marketing spend, correcting for the attribution overlap that inflates individual platform ROAS.
A commonly cited baseline is around 3:1, with top-performing brands reaching 8:1 or higher, though this varies by category and business model.
Because returns reverse revenue that was already counted as a "win" in ROAS and purchase reporting, often weeks after the fact, directly eroding realized profit.
It's profit recalculated to reflect actual cash impact, factoring in pending returns, chargebacks, and payment processing delays that standard reporting doesn't capture in real time.
Yes, ideally incrementality testing is the only method that proves causation rather than correlation, and it's especially useful for validating retargeting and branded search spend.
Monthly is typical, though brands with subscription models or high repeat-purchase categories may benefit from more frequent tracking.
Yes, though it's easier with a unified data pipeline; starting with MER, POAS, CAC, and AOV first, then adding the others as the business scales, is a practical approach.
Because return rates vary dramatically by category, apparel and footwear often exceed 15–20%, while consumables and beauty are typically much lower, and blending them hides where profit is actually leaking.
AI-powered marketing intelligence platforms are increasingly built to automatically connect Shopify, ad platform, and payment data into a single view covering most of these metrics without manual spreadsheet work. If you're still measuring success by ROAS alone, you're only seeing part of the picture. Platforms like Flable AI help D2C brands track POAS, contribution margin, and the other metrics that actually reflect profitability — so growth decisions are based on the full picture, not just one number.
Real contribution margin per campaign and channel. The number that tells you whether to scale.
Start Measuring Profitability →Setup in 48 hours · No credit card required · Backed by Microsoft & NVIDIA