Operations
The Only D2C Dashboard Every Founder Needs in 2026
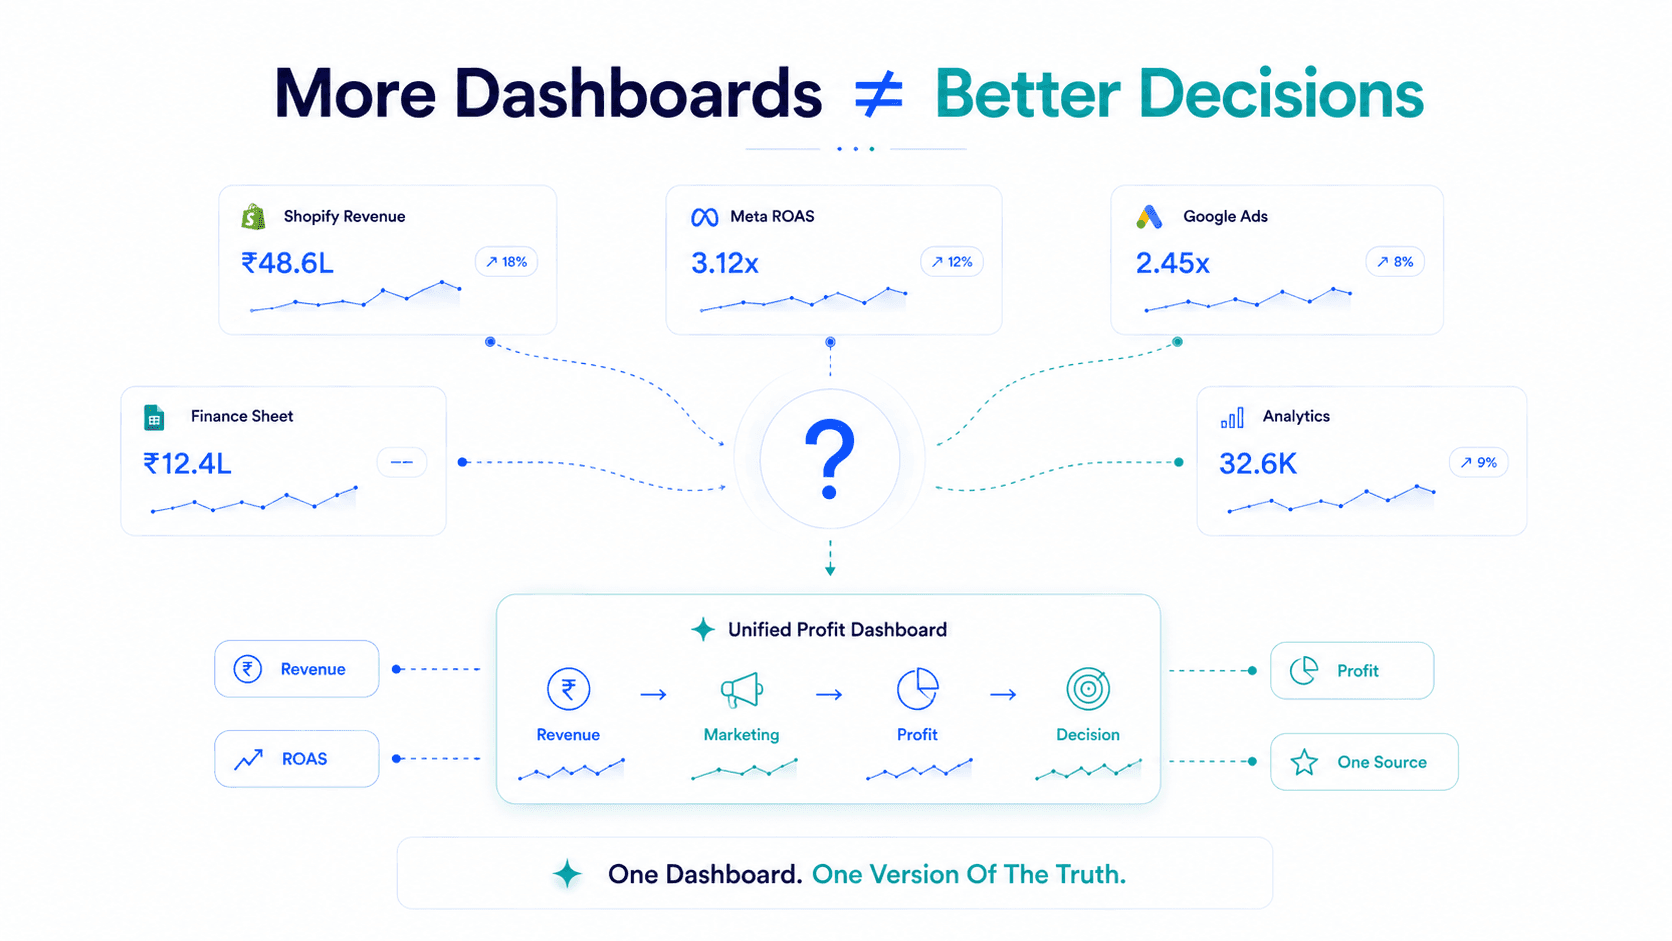
Most D2C founders don't have a dashboard problem in the sense of missing data. They have too many dashboards, each showing a different partial truth: Shopify Analytics shows revenue, Meta Ads Manager shows ROAS, the finance spreadsheet shows a P&L that's three weeks stale, and nobody's numbers agree with each other.
This fragmentation has gotten more costly in 2026. Customer acquisition costs are up 40–60% since 2023, and Meta CPMs have risen roughly 18–20% year over year across most verticals. In a market where margin is this compressed, checking five disconnected dashboards to understand whether last week was actually profitable isn't just inefficient it's a genuine business risk.
This guide lays out the exact dashboard structure D2C founders need in 2026: five layers, from top-line revenue down to actual cash-adjusted profit, and what to actually do with each one.
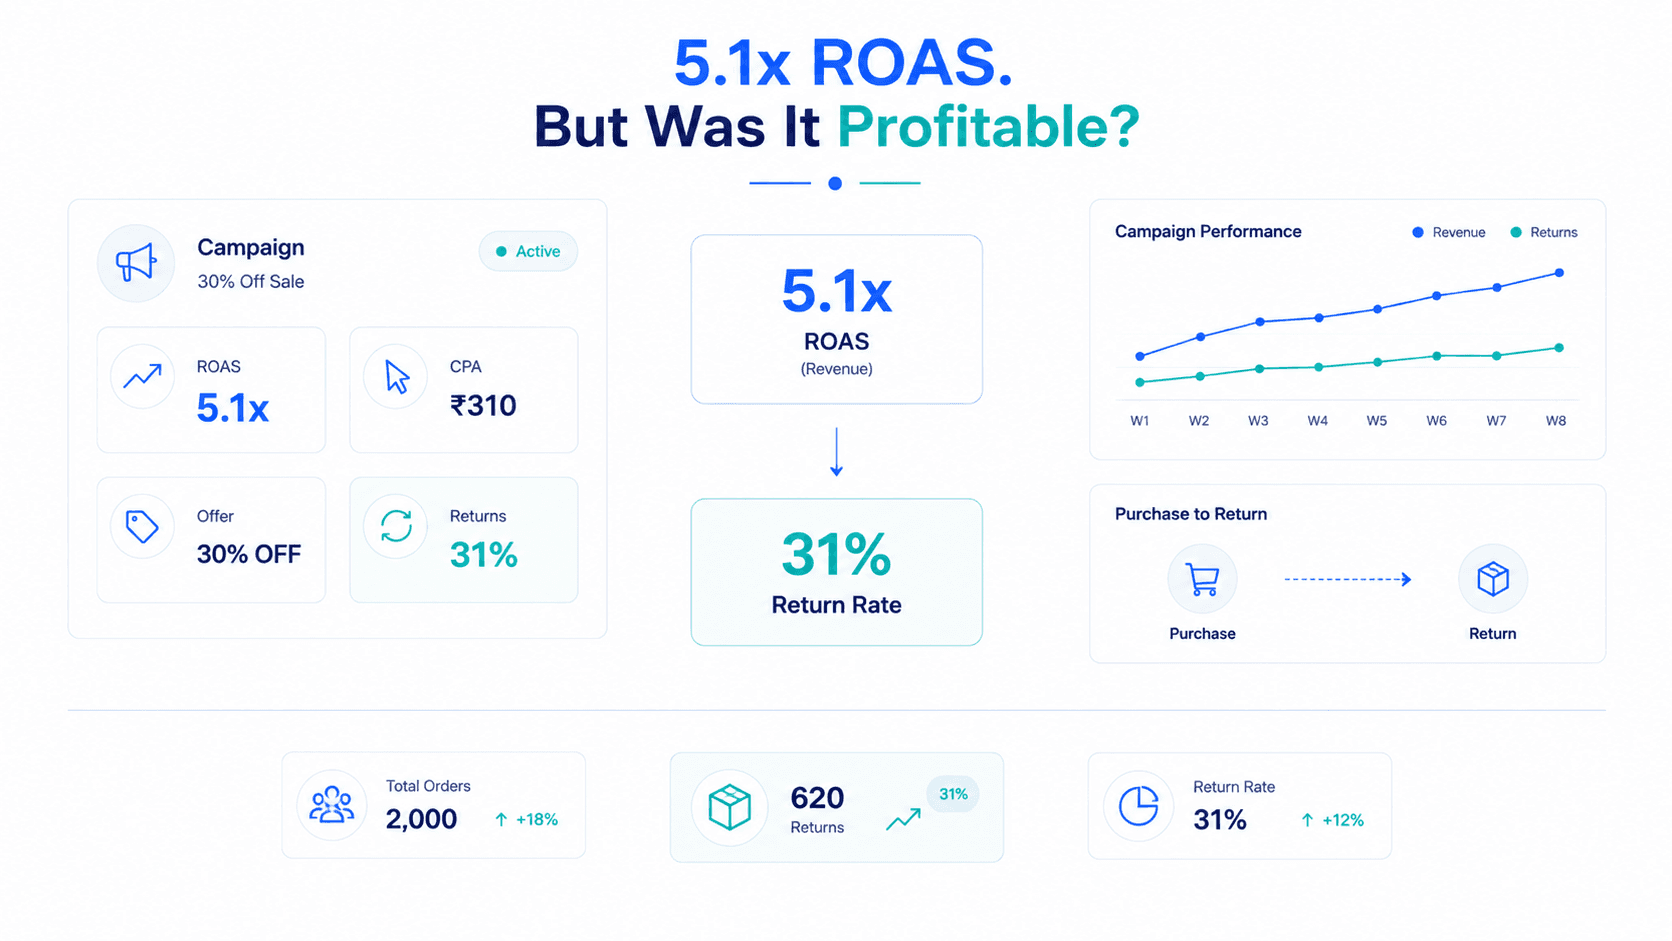
A dashboard built around revenue, ROAS, and traffic looks impressive and moves in a satisfying upward direction most of the time which is exactly the problem. These are lagging, easily-gamed metrics that don't tell you whether the business is healthier or weaker than last month.
A genuinely useful founder dashboard needs to answer three uncomfortable questions at a glance:
Are we actually more profitable than we were last month, not just bigger?
If I scale spend right now, will it increase profit or just increase revenue?
None of Shopify's default analytics, Meta's Ads Manager, or a standalone Google Analytics view can answer all three on their own.
This layer answers a simple question: is overall marketing spend efficient across every channel combined? MER (total revenue ÷ total marketing spend) is the key number here, because it corrects for the attribution overlap that inflates individual platform ROAS numbers. If MER is trending down while individual channel ROAS numbers look stable or improving, that's often an early signal of attribution inflation or a genuine efficiency problem masked by platform-level reporting.
This is where day-to-day media buying decisions happen comparing Meta, Google, TikTok, and other channels against each other, and comparing campaigns and creatives within each channel. ROAS is the right tool for this layer specifically because it's fast, granular, and good at surfacing which creative or audience is working right now. The mistake isn't using ROAS here, it's stopping here.
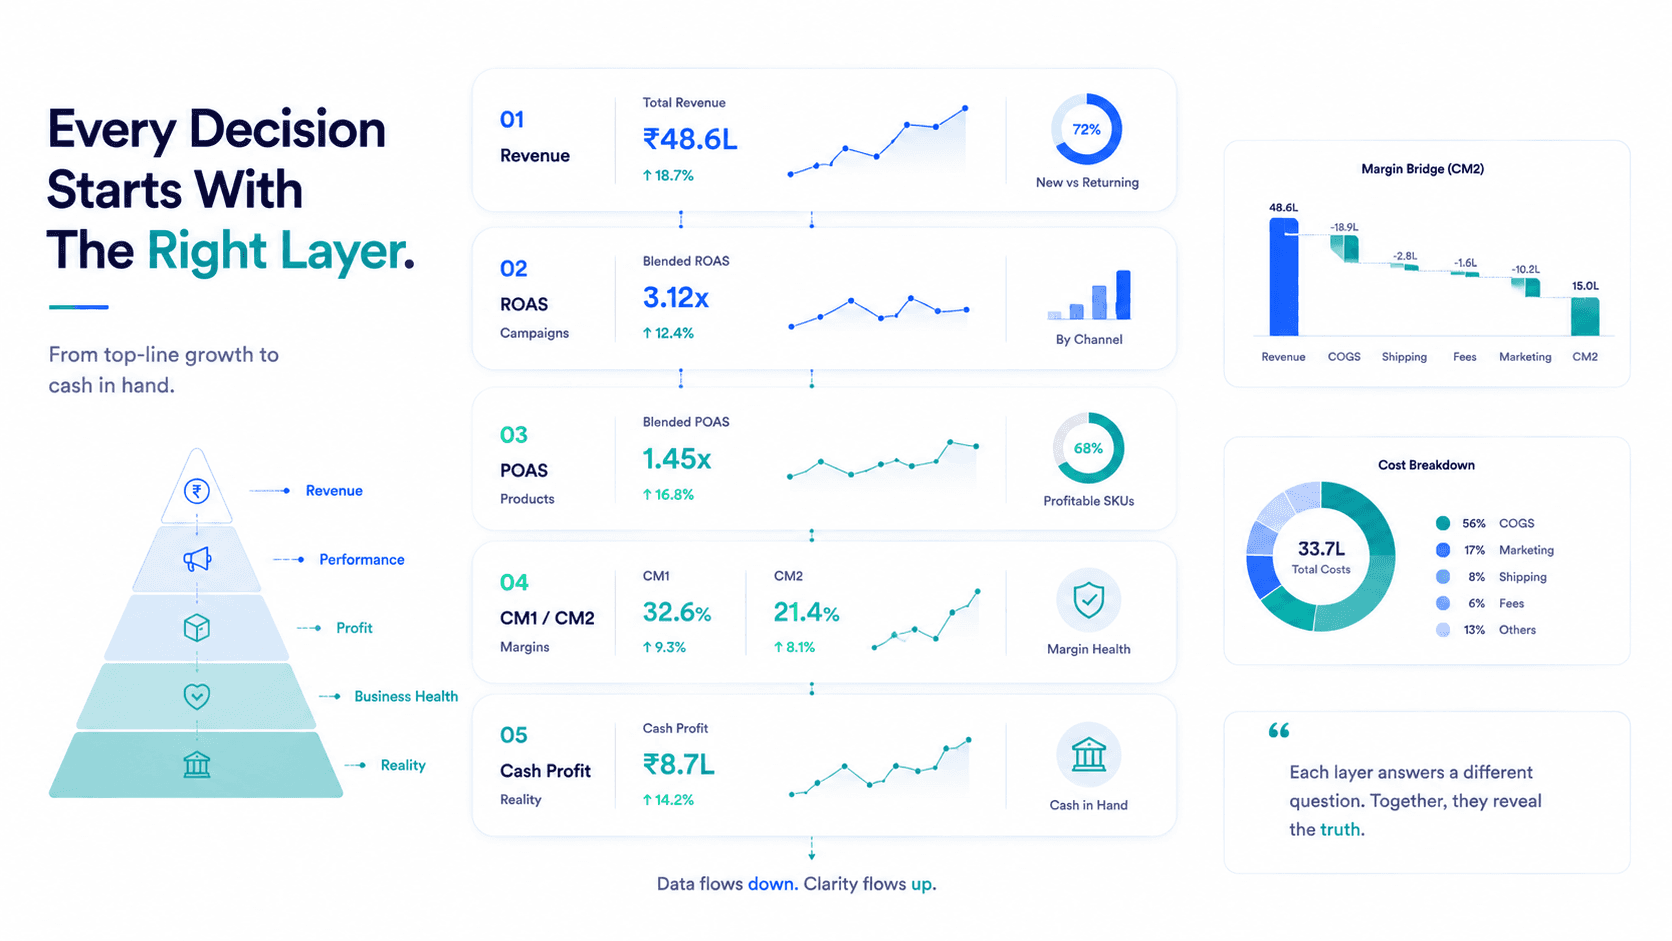
This layer takes the ROAS data from Layer 2 and overlays cost of goods and variable costs to show actual profit per ad dollar, segmented by product and campaign, not just blended account-wide. This segmentation matters enormously: a blended POAS of 1.4x can hide the fact that one hero SKU is running at 2.5x while three long-tail SKUs are quietly running below 1.0x.
Practical rule: No campaign or SKU should receive increased budget without a positive, stable POAS at this layer.
CM1 = Revenue − COGS − direct fulfillment costs (shipping, payment fees)
CM2 = CM1 − variable marketing costs
CM2 is arguably the single most important number on the entire dashboard, because it reflects whether the business generates enough margin, after both product and marketing costs, to cover fixed overhead and eventually produce net profit. Founders and CMOs should treat CM2 trend lines as more important than any individual channel's ROAS.
This final layer reconciles everything above against what's actually happening to cash factoring in returns and refunds that land after the original sale, chargebacks, and payment processing holds or delays. This is the layer that finally answers the question every founder has quietly asked at some point: "why doesn't my dashboard match my bank account?"
| Layer | What It Answers | Primary Metrics | Update Frequency |
|---|---|---|---|
| 1. Top-Line | Is overall marketing efficient? | Total Revenue, MER | Weekly |
| 2. Tactical | Which campaigns/creatives are working? | ROAS by channel and campaign | Daily |
| 3. Profit | Is this spend actually profitable? | POAS by product and campaign | Weekly |
| 4. Business Health | Is the business fundamentally sound? | CM1, CM2 | Monthly |
| 5. Reality | Does this match the bank account? | Cash-adjusted profit after returns/fees | Monthly |
A well-structured founder dashboard, reviewed at the right cadence, might look like this:
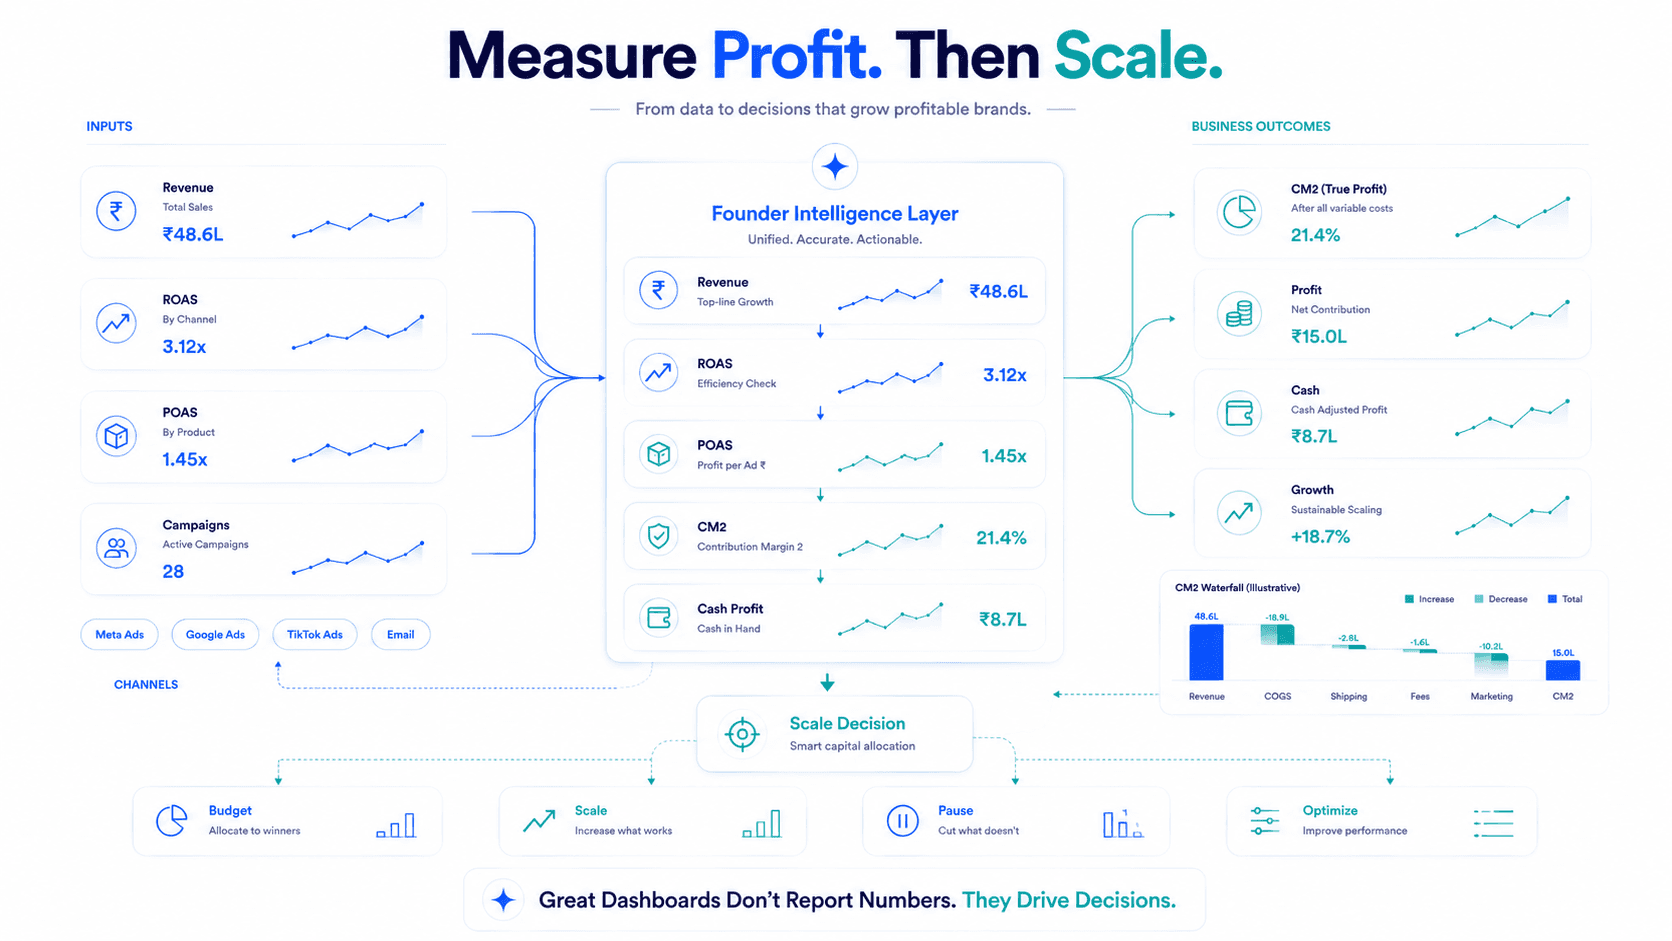
The key design principle: each layer should be visible without needing to open a separate tool. This is the exact problem AI-powered marketing intelligence platforms have been built to solve unifying Shopify, ad platform, and payment data into a single continuously updated view instead of five disconnected exports.
Building a dashboard around whatever data is easiest to pull, rather than the data that actually answers a business question.
Reviewing ROAS daily but contribution margin only at quarter-end, creating a lag where unprofitable decisions compound for months before being caught.
Not segmenting POAS by SKU or campaign, relying on a blended number that hides underperformers.
Ignoring returns until the accounting close, rather than tracking a rolling return-rate impact in near real time.
Treating dashboard-building as a one-time project rather than a system that needs regular COGS and cost updates to stay accurate.
| Approach | Strengths | Weaknesses | Best Fit |
|---|---|---|---|
| Manual spreadsheets | Full control, no cost | Breaks down past a handful of SKUs/channels, prone to manual error, always lagging | Very early-stage brands |
| Generic BI tools | Flexible, customizable visuals | Still requires manual data pipeline setup and maintenance | Brands with in-house data/analytics resources |
| AI marketing intelligence platforms | Automated data pipeline, built specifically for POAS/CM/MER logic | Requires integration setup, ongoing subscription cost | Growing D2C brands scaling across multiple channels/SKUs |
For most brands past the very earliest stage, the maintenance burden of manually reconciling Shopify, ad platforms, and payment gateways in spreadsheets becomes the actual bottleneck not a lack of desire to track the right metrics.
Review Layer 1 and 2 (revenue, MER, ROAS) at least weekly.
Review Layer 3 (POAS) weekly, segmented by product and campaign, not just blended.
Review Layer 4 and 5 (CM1/CM2, cash-adjusted profit) monthly, but track the trend line not just the single-month snapshot.
Set explicit thresholds (e.g., "no budget increase without POAS above 1.2x") so the dashboard drives decisions rather than just being observed.
Revisit COGS and cost assumptions on a fixed schedule (monthly at minimum) so every layer stays accurate as supplier and platform costs shift.
Key Takeaways
Frequently Asked Questions
At minimum: total revenue and MER, channel-level ROAS, POAS by product and campaign, contribution margin (CM1/CM2), and cash-adjusted profit.
Revenue, MER, and ROAS should be reviewed weekly; contribution margin and cash-adjusted profit are best reviewed monthly, with attention to the trend line.
CM1 subtracts COGS and direct fulfillment costs from revenue; CM2 further subtracts variable marketing costs, giving a clearer picture of overall business health.
Shopify Analytics is built around revenue and order data it doesn't natively incorporate ad spend, COGS, or return-adjusted profit in a unified view.
They can for very early-stage brands, but they typically break down in accuracy and maintainability once a brand scales across multiple SKUs and channels.
It's profit recalculated to reflect actual cash impact, factoring in returns, chargebacks, and payment processing delays that occur after the original sale is recorded.
By product and campaign whenever possible blended, account-wide POAS can hide underperforming SKUs subsidized by a strong hero product.
Yes, MER is a fast top-line efficiency check and a good early signal of attribution inflation, complementing rather than replacing POAS.
Compare blended MER against summed channel-level ROAS; a persistent, widening gap between the two typically indicates attribution overlap.
AI-powered marketing intelligence platforms are increasingly built specifically to connect Shopify, ad platform, and payment data into one continuously updated profitability view.
Real contribution margin per campaign and channel. The number that tells you whether to scale.
Start Measuring Profitability →Setup in 48 hours · No credit card required · Backed by Microsoft & NVIDIA