Deep Dive
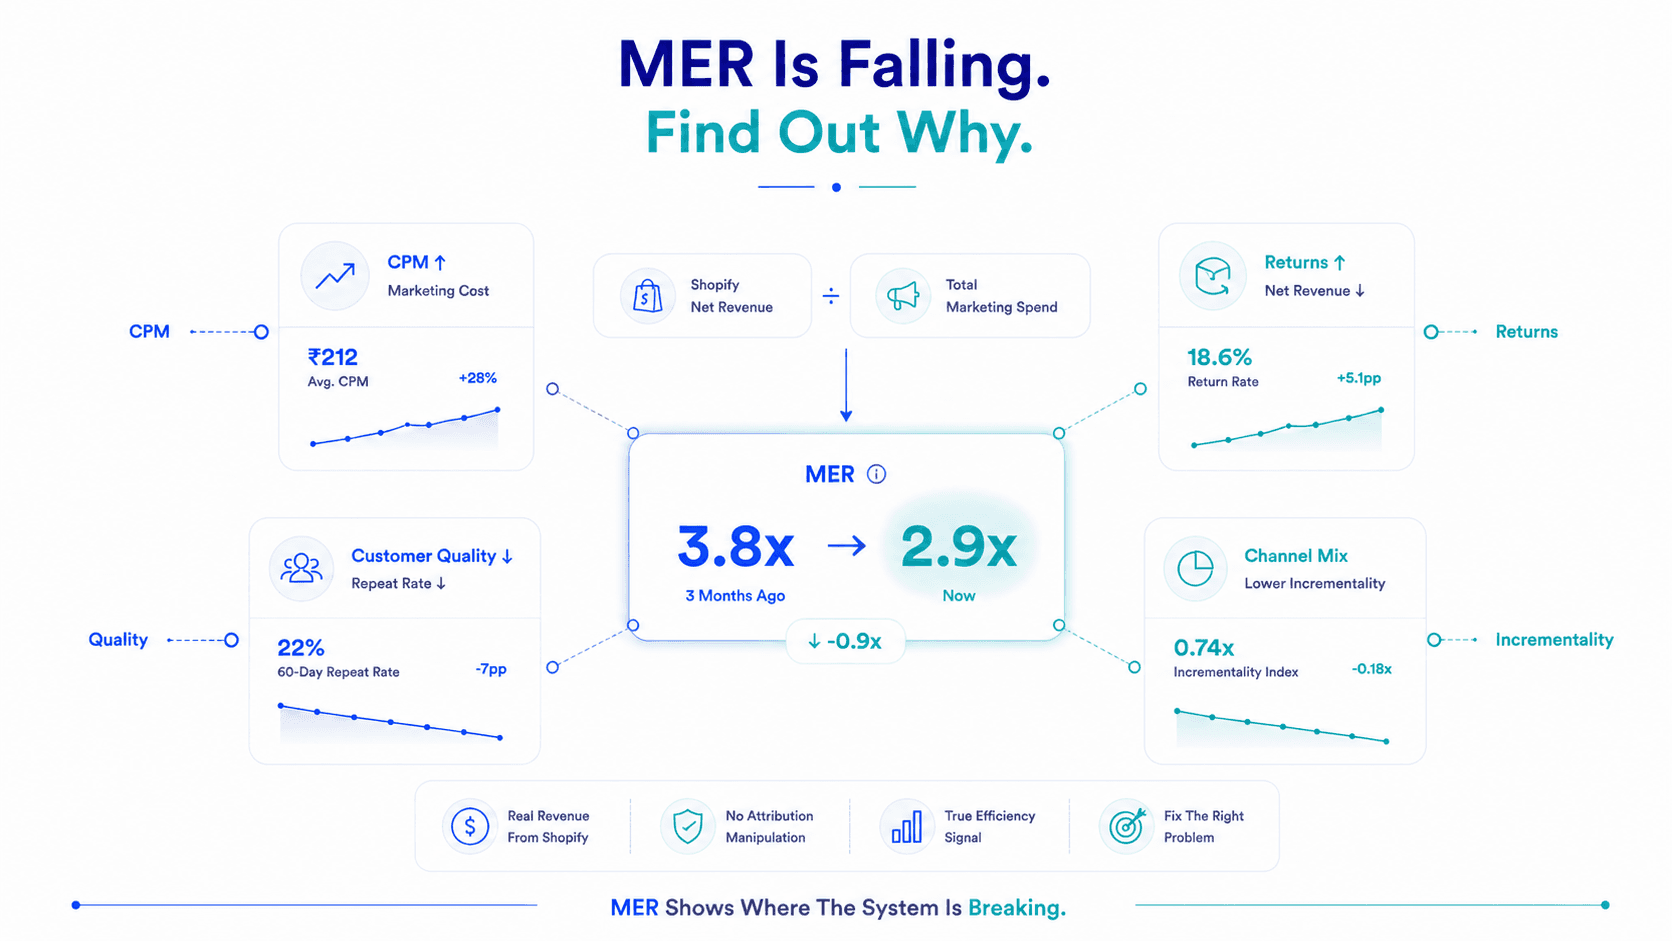
Your MER was 3.8x three months ago. Now it's 2.9x. Revenue is still growing. The agency is still reporting improving ROAS. But your Marketing Efficiency Ratio has dropped nearly a full point.
MER
Shopify Net Rev ÷ Total Ad Spend
4 Areas
CPMs, Returns, LTV, Channel Mix
2 – 12 Wks
Targeted fix turnaround
Something is wrong. But what?
A declining MER is one of the most useful signals in D2C performance marketing precisely because it can't be disguised by attribution tricks. When Shopify net revenue divided by total marketing spend goes down something in the system has genuinely deteriorated. The question is where.
This is the diagnostic playbook. Four possible causes, four different fixes, and a framework to identify which one you're dealing with.
MER = Shopify Net Revenue ÷ Total Marketing Spend
Unlike individual channel ROAS, MER doesn't care about attribution. It uses your real Shopify revenue as the numerator. Which means when MER declines, the decline is real, not an artefact of how platforms count conversions.
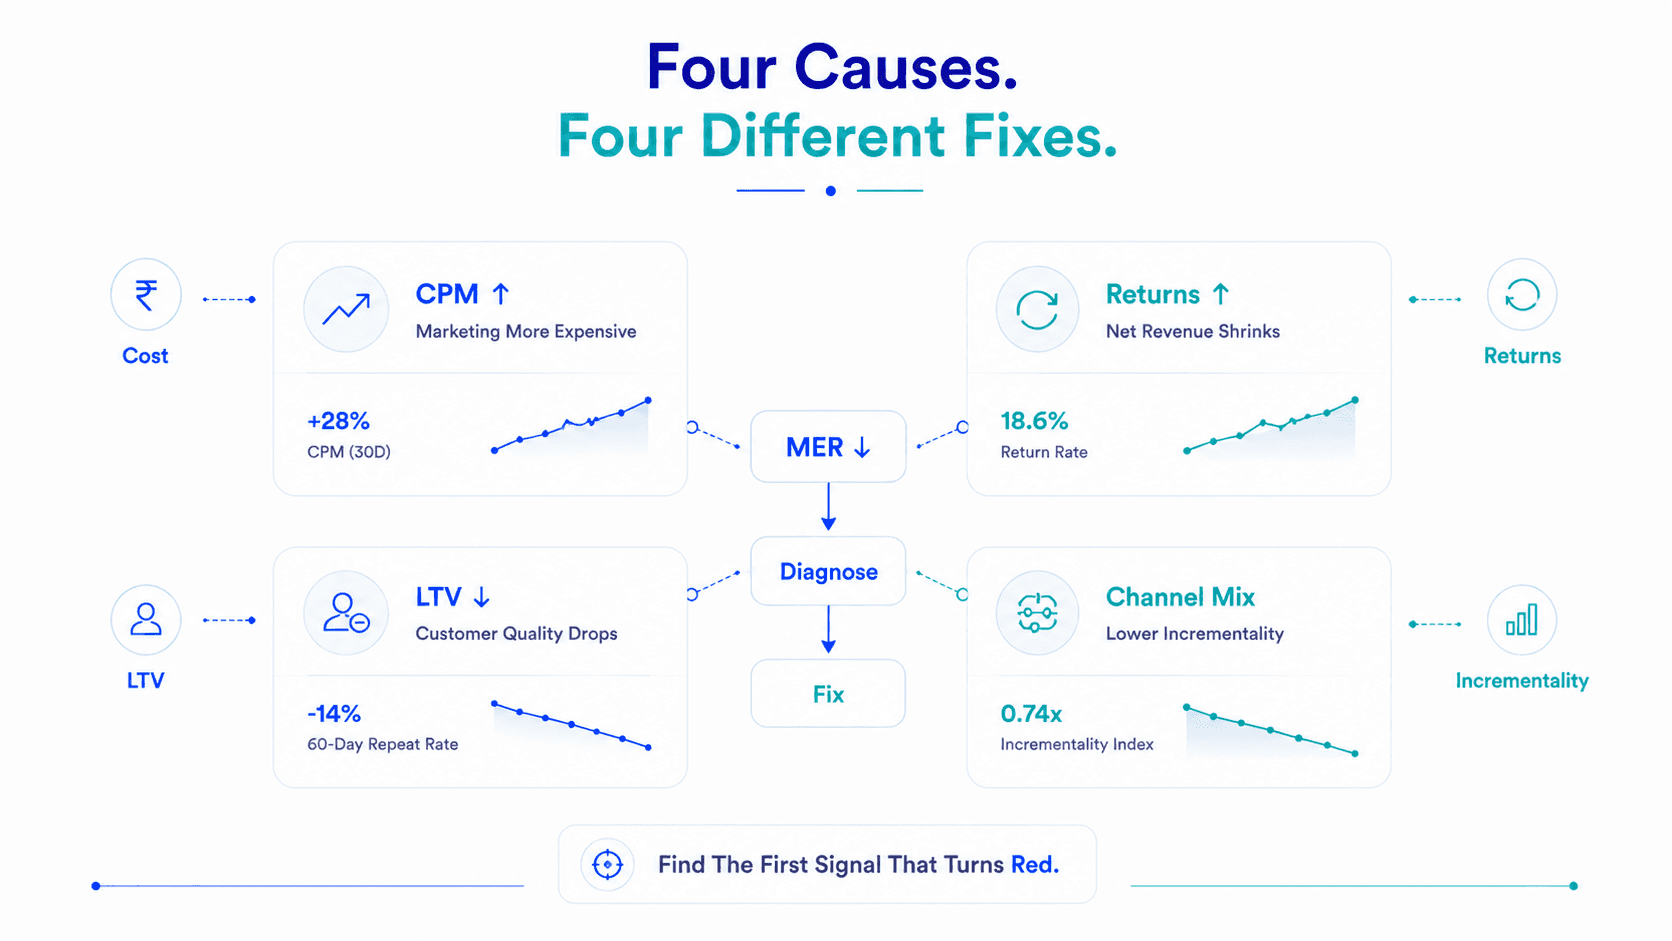
A declining MER means one of four things:
Each cause has different fingerprints in the data, and a different fix.
The fingerprint: ROAS is declining across campaigns. CPMs are rising. CPA is increasing. Performance is worsening across the board, not just in one campaign.
How to confirm: Pull weekly CPM data for your top campaigns over the last 8 weeks. A consistent upward trend, ₹160 CPM → ₹185 → ₹210, with no corresponding increase in CTR or CVR confirms CPM inflation is the driver.
This happens for several reasons:
Improve creative quality.
Higher engagement rates (Hook Rate, CTR) reduce CPM — Meta's algorithm rewards ads that earn attention with better placement at lower cost. Better creative is the only lever that directly reduces CPM without reducing reach.
Test new audience segments.
If core audiences are saturated, expand geographic targeting (Tier 2 cities if you're Tier 1 focused, new states if you're geographically concentrated), or test interest-adjacent audiences that haven't been exhausted.
Improve offer efficiency.
If CPMs are rising faster than revenue, your offer needs to convert more efficiently at a given reach level. Test bundle offers (higher AOV = same click, more revenue), subscription mechanics, or free shipping threshold adjustments that improve revenue per session.
Reduce wasteful spend.
Run a campaign audit, identify campaigns or ad sets with below-break-even POAS that are contributing to total spend without contributing to net revenue. Cutting these recovers MER without reducing genuine revenue.
The fingerprint: Platform ROAS looks stable or even improving. Shopify gross revenue is growing. But net revenue (post-returns) is lagging significantly behind gross. MER calculated on gross revenue would look fine, MER on net revenue is declining.
How to confirm: Pull Shopify refund/return data as a percentage of gross revenue for each of the last 8 weeks. A rising trend — 12% → 15% → 19% — directly explains a declining MER even when platform metrics look healthy.
This is one of the sneakiest MER killers because all your ad platform reporting remains unchanged. Returns happen after the purchase event, after the attribution window. Ads Manager shows a great week. Shopify net revenue tells a different story.
Identify which campaigns are driving high-return customers.
Pull return rates by campaign UTM source. If specific campaigns often discount-driven or broad prospecting campaigns, have return rates 1.5–2x your baseline, those campaigns are acquiring the wrong customers at a cost that compounds every week.
Review ad creative for expectation gaps.
The most common cause of rising return rates is a mismatch between what the ad showed and what the customer received. Over-styled product photography, aspirational claims that the product can't substantiate, or misleading sizing/colour representation all generate returns that look like a logistics problem but are actually a creative problem.
Tighten COD audience targeting.
In India, COD-acquired customers have systematically higher return/RTO rates than prepaid customers. If your campaigns are scaling into COD-heavy Tier 2/3 audiences, return rates will rise. Implement COD-to-prepaid conversion incentives at checkout and monitor whether the split improves.
Implement a post-purchase sequence.
Customers who receive a “you made a great choice” email within 2 hours of purchase, with usage instructions, what to expect, and social proof from similar customers, return products significantly less frequently. The return decision is made in the consideration window between purchase and delivery. Filling that window with reinforcement reduces the return rate.
The fingerprint: MER is declining but return rates are stable. CPMs are stable. Revenue is growing. But 60-day repeat purchase rates are falling, recent cohorts are buying once and not coming back.
How to confirm: Build a simple cohort comparison. For customers acquired 60 days ago what percentage have made a second purchase? Compare this against the same metric for customers acquired 3 months ago and 6 months ago. A declining trend across cohorts signals customer quality deterioration.
This typically happens when scaling pushes campaigns into lower-intent audiences. The algorithm has exhausted high-quality segments and is finding conversions in progressively less committed buyer pools people who will buy once (especially with an offer) but aren't brand-engaged enough to return.
Tighten new customer audience definition.
Use your highest-LTV customer list as the seed for Lookalike audiences rather than your full customer base. The top 20% of customers by 12-month spend generates significantly better lookalikes than a full customer list.
Reduce discount depth on prospecting campaigns.
Discount-acquired customers have consistently lower repeat purchase rates. If your prospecting campaigns lead with a 25% off offer, you're selecting for price-sensitive buyers. Test price-equivalent offers that aren't discount-framed (free shipping + gift > 20% off for the same margin impact with better customer quality).
Invest in retention for recent cohorts.
If recent cohorts are showing weaker repeat purchase rates fix the retention, not just the acquisition. Email sequences, personalised product recommendations, and loyalty incentives for the second purchase can meaningfully improve cohort performance for customers already acquired.
The fingerprint: You've added a new channel or significantly scaled an existing one. Individual channel ROAS looks strong for the new channel. But MER has declined despite growing total spend.
How to confirm: Calculate the incremental MER contribution of each channel, what MER looked like before the channel was added vs after. If adding Google Brand Search at ₹2L/month improved attributed revenue significantly but net Shopify revenue barely moved, the new channel has poor incrementality.
Run an incrementality test on the new channel.
Pause it for 14 days. Measure whether Shopify net revenue falls by the amount the channel was attributing. If revenue barely moves — you've been spending on a channel that was capturing organic demand rather than creating new demand. Redistribute the budget.
Rebalance toward high-incrementality spend.
Meta prospecting and Google non-brand Shopping typically have higher incrementality than Google Brand Search, email, and SMS (which tend to capture organic demand). If your channel mix has shifted toward the latter, rebalancing toward the former often recovers MER.
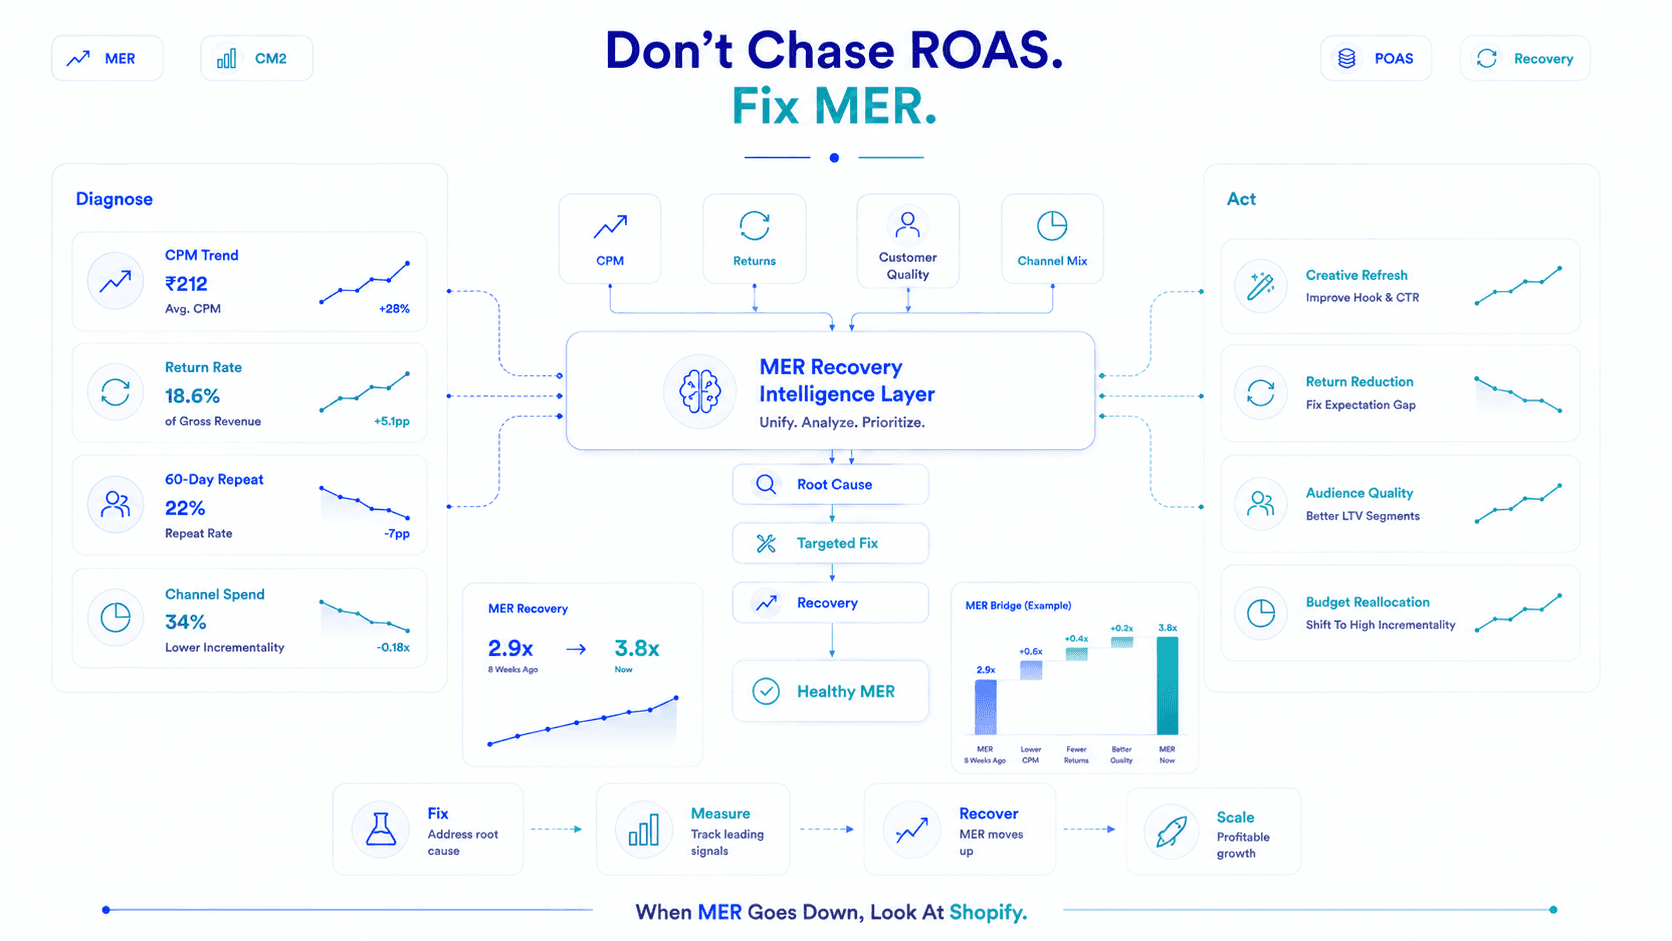
Run through these in order when MER is declining:
| Step | Check | Tool |
|---|---|---|
| 1 | Is gross revenue growing but net revenue lagging? | Shopify return/refund data |
| 2 | Are CPMs rising across campaigns? | Meta/Google CPM trend — 8 weeks |
| 3 | Are 60-day repeat purchase rates falling for recent cohorts? | Shopify cohort data |
| 4 | Have you added or scaled a new channel recently? | Marketing spend breakdown by channel |
| 5 | Are specific campaigns driving disproportionate returns? | Return rate by campaign UTM |
| 6 | Is POAS above 1.0 across all active campaigns? | Flable AI / manual CM2 calculation |
| 7 | Is CAPI active and firing correctly? | Meta Events Manager |
💡 The first question that produces a “yes” is your primary cause. The others may be secondary contributing factors. Fix in priority order.
Depends on the cause:
2–4 weeks
New creative takes 1–2 weeks to produce and 1–2 weeks to stabilise in performance after launch.
3–6 weeks
Return rate changes lag behind campaign changes by 2–3 weeks (purchase-to-return cycle). Give new creative and audience adjustments time to show in return data.
6–12 weeks
Improving cohort quality takes time; the 60-day repeat purchase improvement you create this week won't show up in the data for 60 days.
2–4 weeks
Pausing low-incrementality channels and reallocating budget shows quickly in MER because you're removing spend that wasn't generating real revenue anyway.
A declining MER is never just “marketing is getting harder.” It's a specific diagnostic signal pointing to a specific cause: rising CPMs, increasing return rates, declining customer quality, or channel mix shift.
The playbook is the same every time: identify which of the four causes is primary, apply the targeted fix, measure the recovery time, and hold MER as the ground truth that tells you whether the fix worked.
ROAS can be massaged. MER cannot. Trust it. Fix what it's pointing to.
When MER goes down, don't look at ROAS for the answer. Look at Shopify.
Four primary causes: rising CPMs (marketing becoming more expensive), increasing return rates (net revenue shrinking while gross revenue holds), declining customer quality (recent cohorts showing lower repeat purchase rates), or channel mix shift toward lower-incrementality channels that claim credit without driving genuine new revenue.
Fastest fix: audit campaigns for below-POAS-breakeven spend and pause them immediately — this reduces total marketing spend without reducing net revenue, directly improving MER. Second fastest: identify and fix campaigns with rising return rates; return rates can be addressed in 2–3 weeks with creative and targeting changes.
Yes. ROAS improving while MER declines is a classic attribution inflation signal — platforms are claiming more revenue as channels multiply, but actual Shopify net revenue isn't growing proportionally. This typically means you've added a channel that's taking credit for organic demand (like Google Brand Search) or that cross-channel attribution overlap has increased.
Depends on cause. CPM/creative problems: 2–4 weeks. Return rate problems: 3–6 weeks (return data lags campaign changes by 2–3 weeks). Customer quality problems: 6–12 weeks (cohort improvement takes time to observe). Channel incrementality problems: 2–4 weeks.
Flable shows CM2 and POAS per campaign alongside return rates, so you can immediately see whether specific campaigns are driving returns that compress net revenue, or whether POAS has dropped below breakeven indicating budget inefficiency. Combined with weekly MER tracking, Flable makes the cause of MER decline visible in the same dashboard.
Track CM2, POAS, return rates, and true MER in real time across Meta, Google, and Shopify. Stop guessing why efficiency dropped.