Deep Dive
In 2026, the average ecommerce ROAS dropped to 2.87x — down 4% year over year. But ROAS was never measuring profitability to begin with. The sooner D2C brands understand this, the sooner they can stop making expensive decisions based on the wrong number.
ROAS stands for Return on Ad Spend. The formula is simple: revenue generated ÷ ad spend.
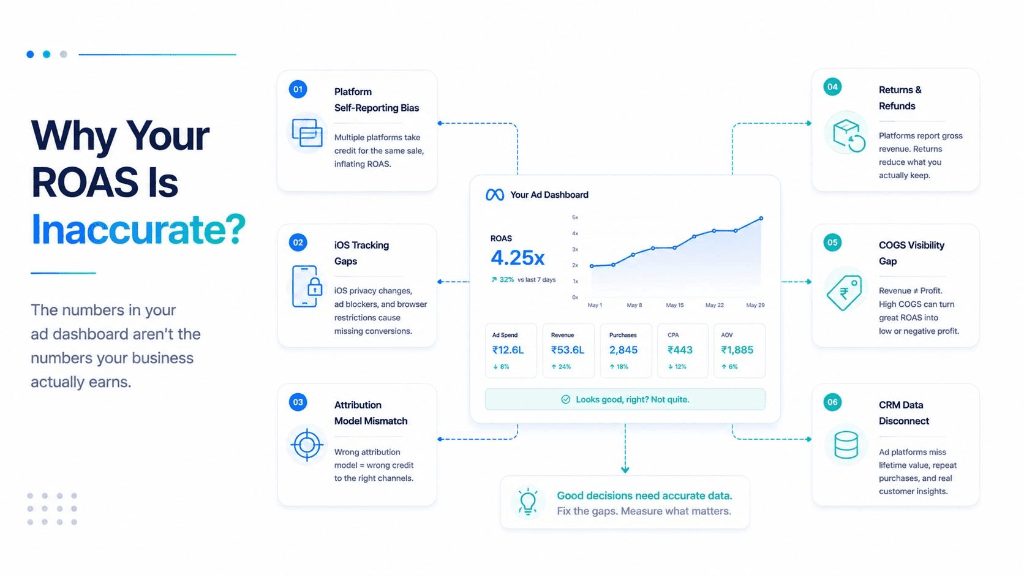
The problem is that "return" in ROAS doesn't mean what it sounds like. When Google and Meta built ROAS as a metric, they didn't have access to your COGS. So they swapped "return" (profit) for "revenue" — and the metric has misled founders ever since.
What ROAS ignores: COGS, shipping, fulfilment, return processing, payment processing fees, and agency costs.
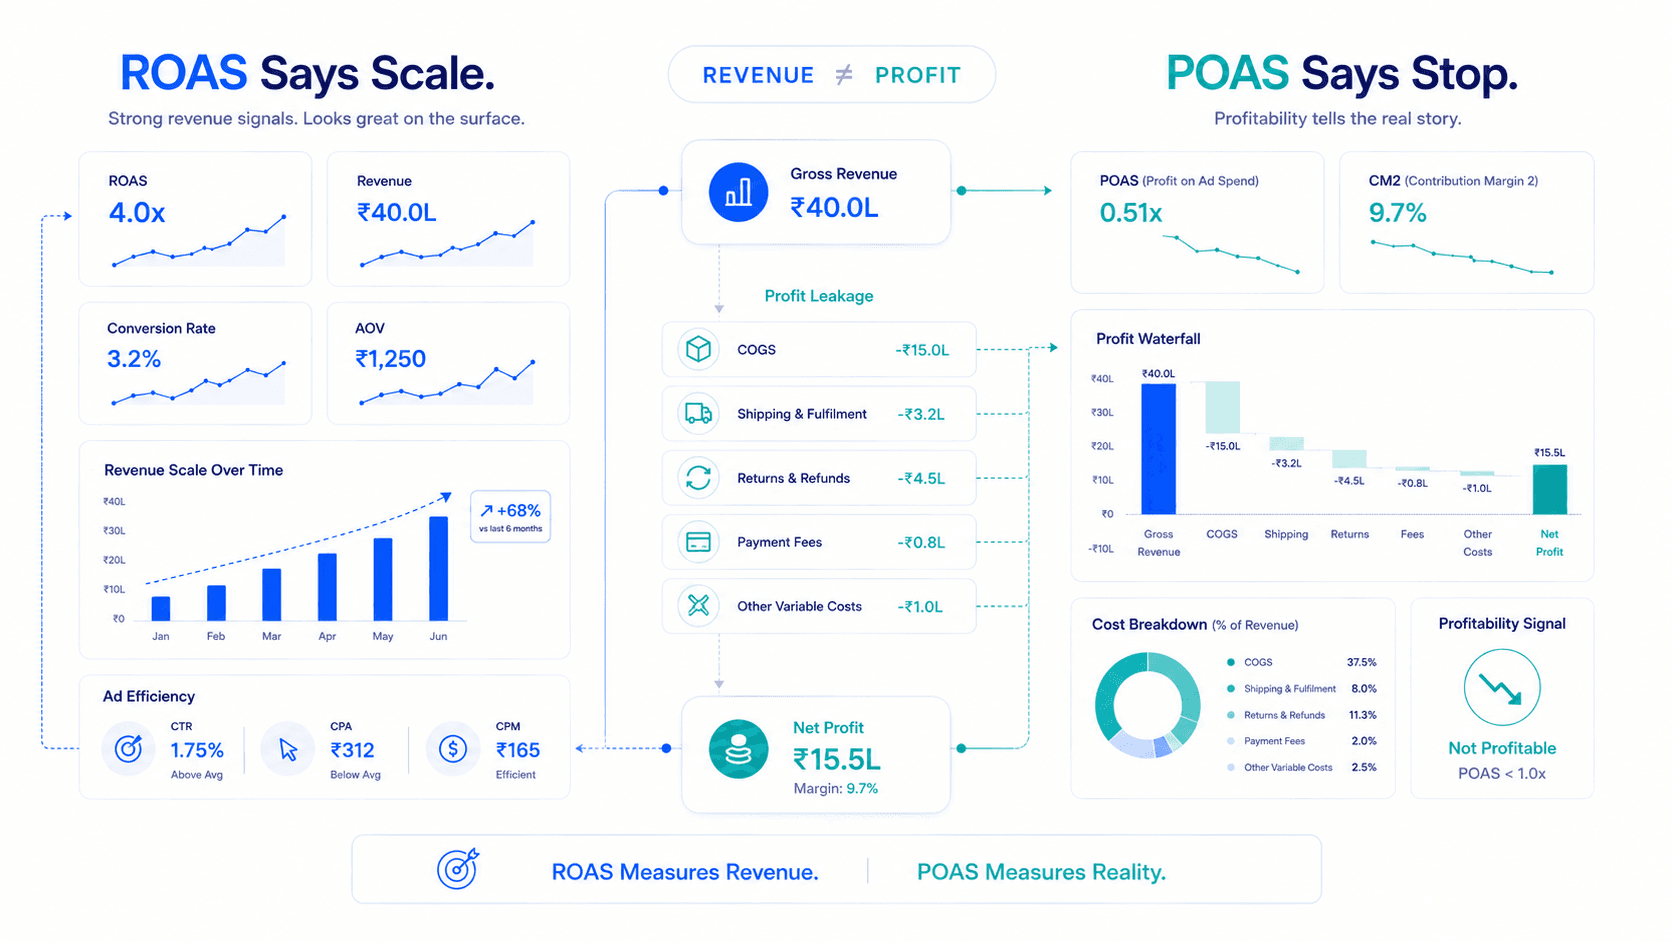
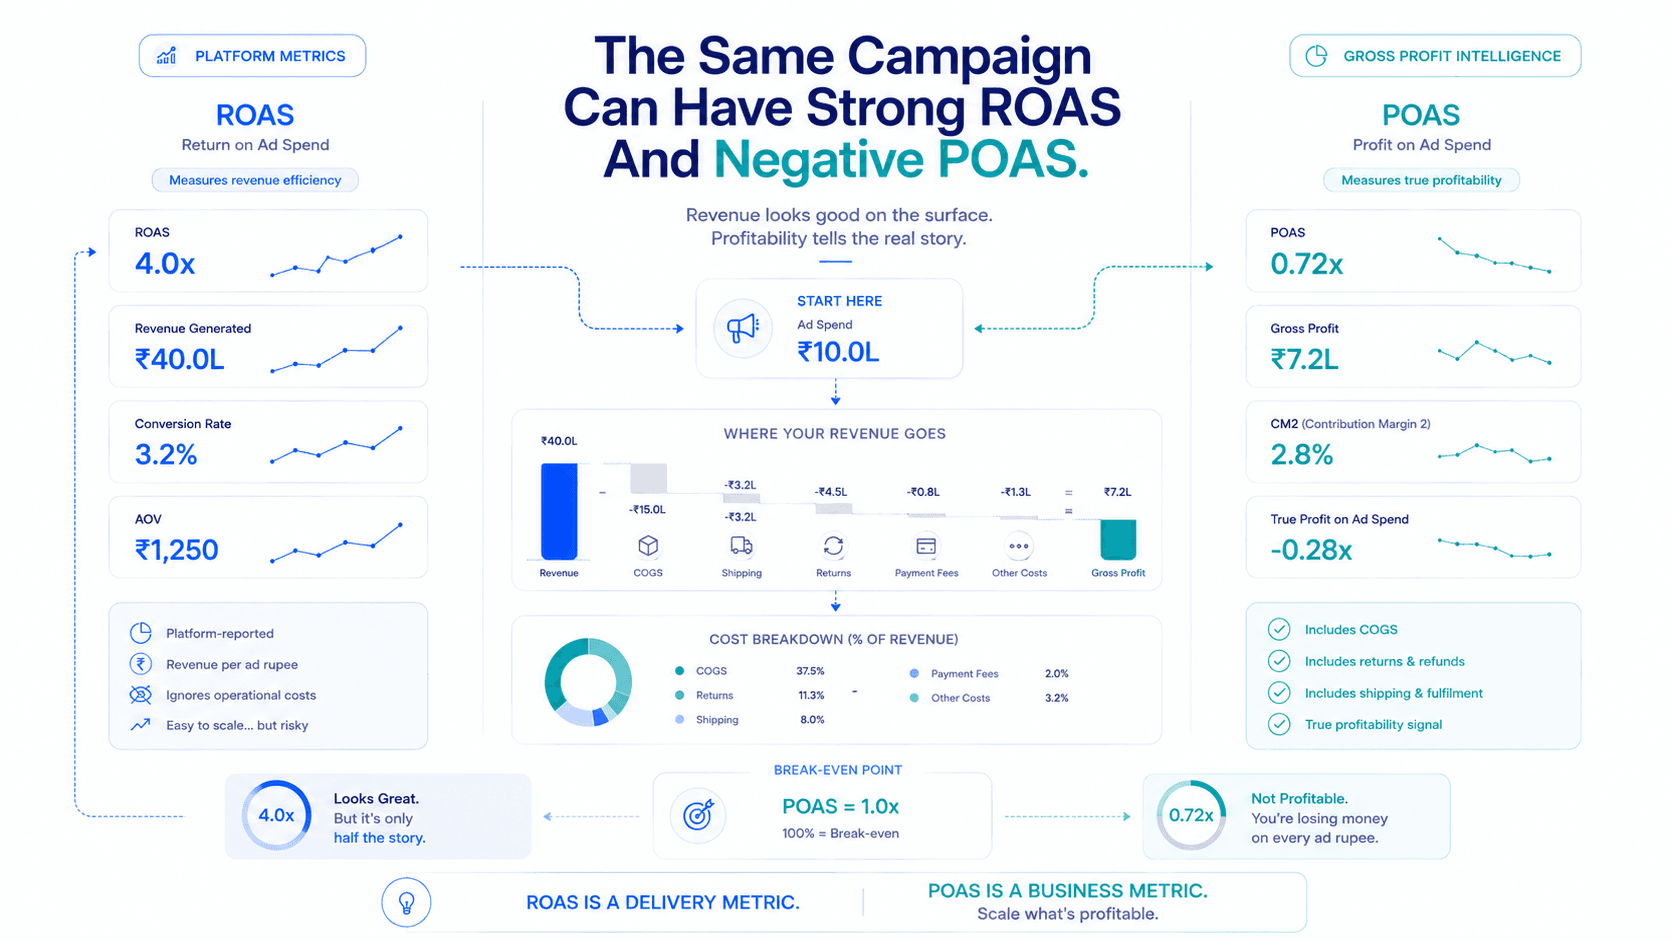
A real example that plays out every day: You spend ₹10L on Meta. You generate ₹40L in revenue. ROAS = 4x. Looks great. Now the full picture: Your product costs ₹15L to manufacture and ship. You process ₹5L in returns. Payment processing costs ₹80K. You actually spent ₹31L to earn ₹35L in net revenue. Profit: ₹4L. Not the "4x return" ROAS suggested. And that's before accounting for your fixed costs.
POAS — Profit on Ad Spend — measures the gross profit gained from every ad rupee spent, not just the revenue.
The POAS formula: POAS = (Revenue − COGS − Shipping − Returns − Payment Fees) ÷ Ad Spend × 100%
The break-even point is POAS = 1.0 (or 100%). Everything below 1.0 means you are advertising at a loss.
| Measures | ROAS | POAS |
|---|---|---|
| Metric | Revenue per ad rupee | Gross profit per ad rupee |
| Includes COGS | ❌ No | ✅ Yes |
| Includes returns | ❌ No | ✅ Yes |
| Includes shipping | ❌ No | ✅ Yes |
| Break-even point | Depends on margin | 1.0 (100%) — universal |
| Reported by platforms | ✅ Yes — automatically | ❌ No — requires calculation |
| Useful for | Campaign delivery diagnosis | Profitability decisions |
| Risk of over-scaling | High, ignores real costs | Low, anchored to actual profit |
The most dangerous thing about ROAS is not that it's wrong it's that it's right enough to feel trustworthy. It measures something real. It just doesn't measure what you need to make scaling decisions.
The insight: Beauty appears to underperform on ROAS relative to other categories. But because margins are high, brands can be very profitable at ROAS levels that would be loss-making in electronics.
The insight: Apparel has the highest ROAS in most benchmarks. But it also has the highest return rates. A fashion brand at 4x ROAS with a 22% return rate may have a POAS below 1.0 once returns, shipping both ways, and COGS are accounted for. Fashion brands are the category most at risk of confusing strong ROAS with actual profitability.
The insight: Electronics is the category where ROAS is most misleading. High AOV creates impressive revenue numbers. Low margins and high return rates make profitability extremely difficult at scale on paid channels.
A fashion brand is spending ₹15L/month on Meta. ROAS is 3.8x. The agency recommends scaling to ₹25L/month.
Before scaling, they run the POAS calculation:
ROAS was 3.8x. POAS was 0.87. The business was losing money on every scaling rupee — and the ROAS number said everything was fine. This is not a hypothetical. This is the daily reality for fashion brands running on ROAS targets without POAS visibility.
When you shift your primary optimisation metric from ROAS to POAS, three decisions change immediately:
POAS requires: ad spend, revenue, COGS, return data, and shipping costs. Done manually, this is hours of work per campaign. This is exactly what Flable AI is built to calculate — automatically, in real time. Your POAS, the number that actually tells you whether to scale live on your dashboard every morning.
Frequently Asked Questions
POAS (Profit on Ad Spend) measures gross profit generated per rupee of ad spend. Formula: (Revenue − COGS − Shipping − Returns − Payment Fees) ÷ Ad Spend × 100%. A POAS of 1.0 (100%) means you broke even after all variable costs. Anything above 1.0 is profitable; anything below is a loss regardless of ROAS.
ROAS measures revenue divided by ad spend it does not account for COGS, returns, or shipping. POAS measures gross profit divided by ad spend it accounts for all variable costs. The same campaign can show 4x ROAS and 0.87x POAS simultaneously, which means the campaign is generating strong revenue but destroying margin.
A POAS above 1.0 means you're profitable on variable costs. Most D2C brands should target POAS of 1.2–1.5x before scaling ad spend. Category targets vary: Beauty/Supplements aim for 1.3–1.8x; Apparel 1.2–1.6x; Electronics 1.0–1.2x (very tight margins make this category challenging on paid alone).
Apparel/Fashion is most at risk high ROAS benchmarks combined with high return rates mean POAS is frequently below breakeven for brands using ROAS as their primary signal. Electronics is second low margins make ROAS deeply misleading. Food & Beverage third thin margins mean POAS on first-order acquisition is often negative even at acceptable ROAS levels.
Flable connects your ad data (Meta, Google) with Shopify revenue, product COGS, return portal data, and shipping costs to calculate real-time POAS per campaign. No spreadsheet required. You see actual gross profit per campaign and channel, not just platform-reported ROAS.
Gross profit per campaign, adjusted for returns, COGS, and shipping.
See Your Real Profitability →