Deep Dive
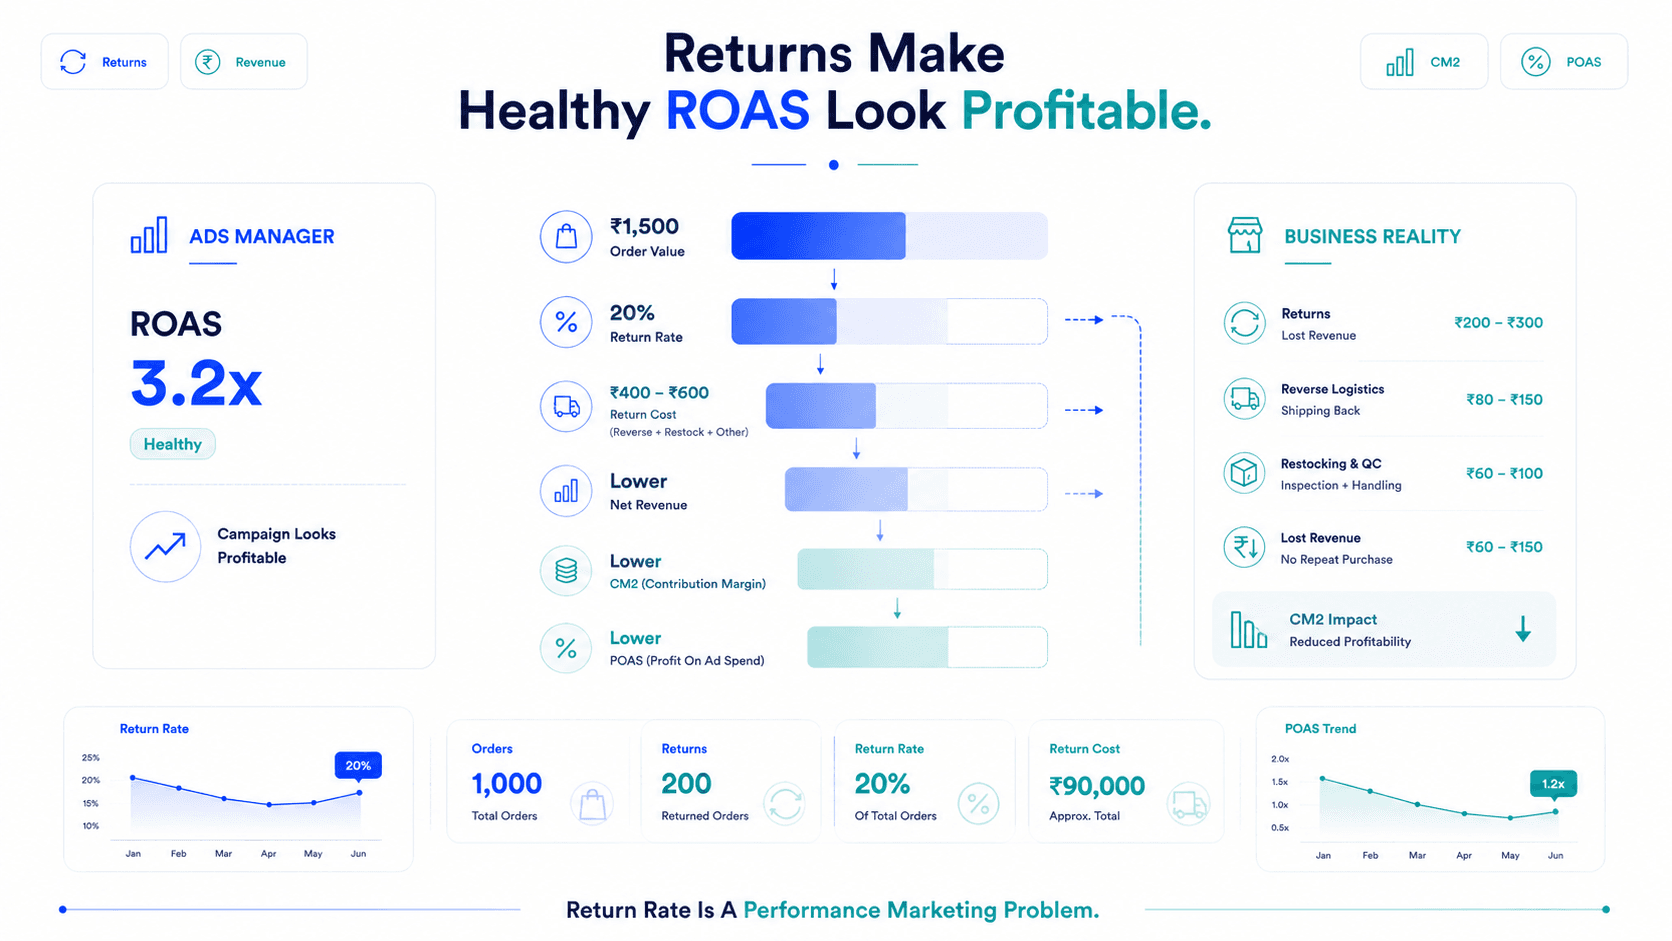
Every returned order costs you more than the product. Forward shipping you already paid. Reverse logistics to bring it back. Restocking and quality inspection. And the revenue that's gone.
₹400 – 600
27–40% of order value
15% – 30%
Resolved without physical return
2 – 3 Wks
Pause high-return UTMs
For a ₹1,500 D2C order with a 20% return rate, the blended cost per return often runs ₹400–600. That's 27–40% of the order value consumed by returns before a single rupee of profit is counted.
More importantly: your ad platforms don't see any of this. Your Ads Manager ROAS stays exactly what it was. The campaign keeps looking healthy. The budget keeps flowing.
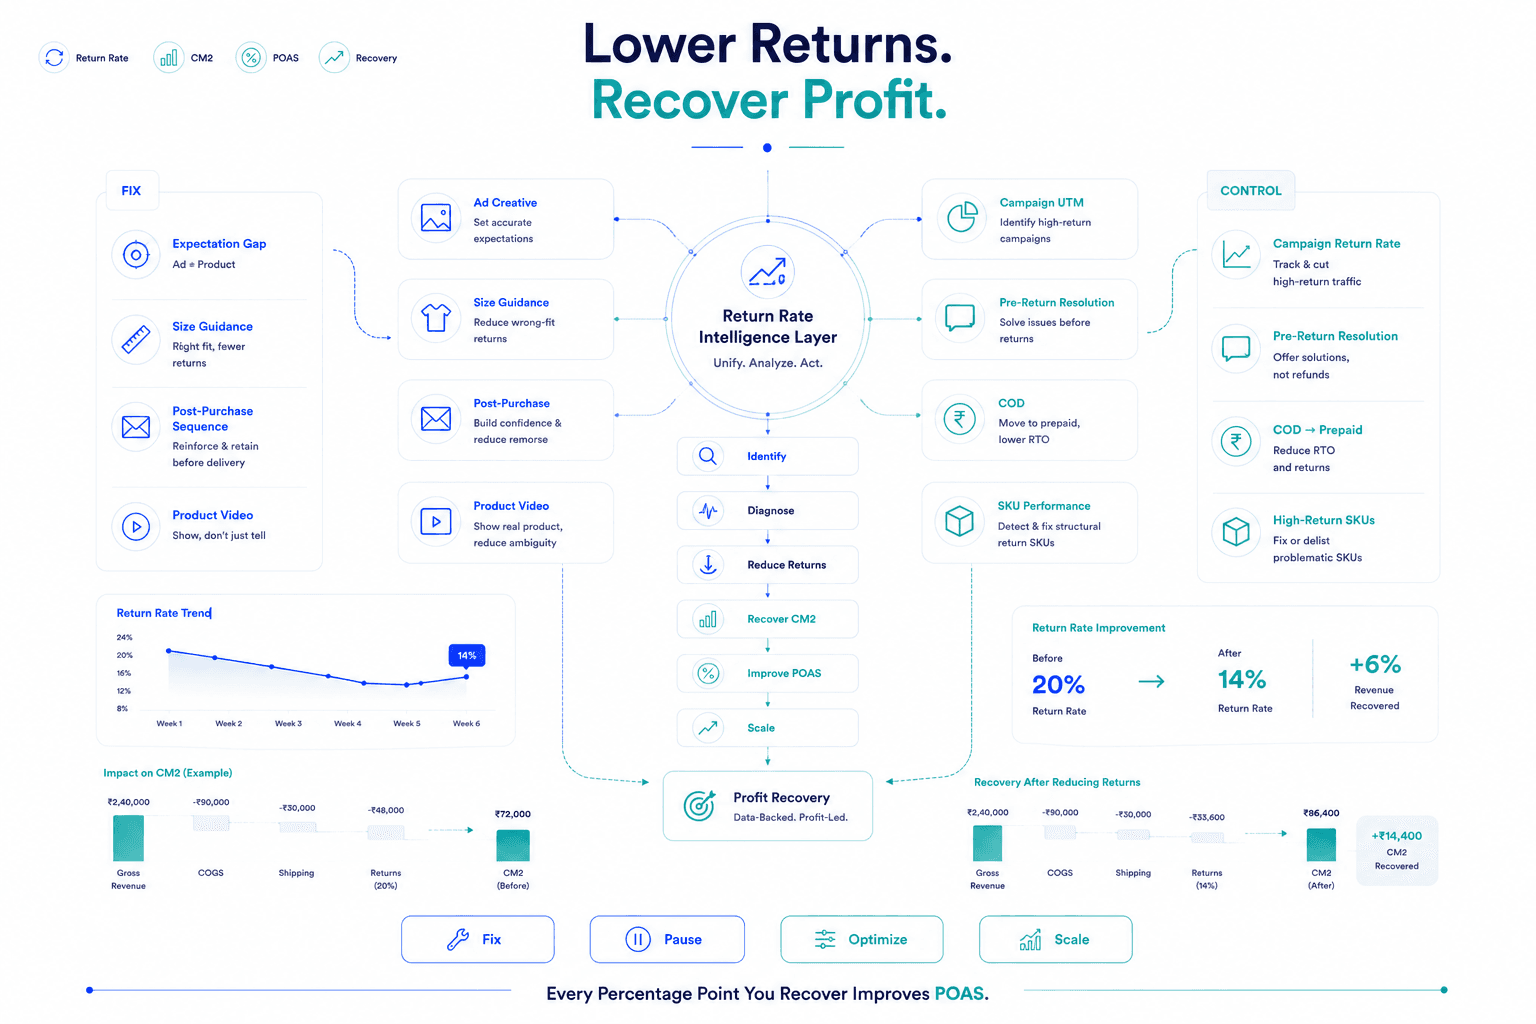
Return rate is one of the most direct levers on POAS and CM2, and it's one of the most fixable problems in D2C. These 8 tactics are the ones that actually move the number.
Fix the expectation. Fill the delivery window. Identify the culprit campaigns. The margin that returns is the most efficient revenue you'll ever recover.
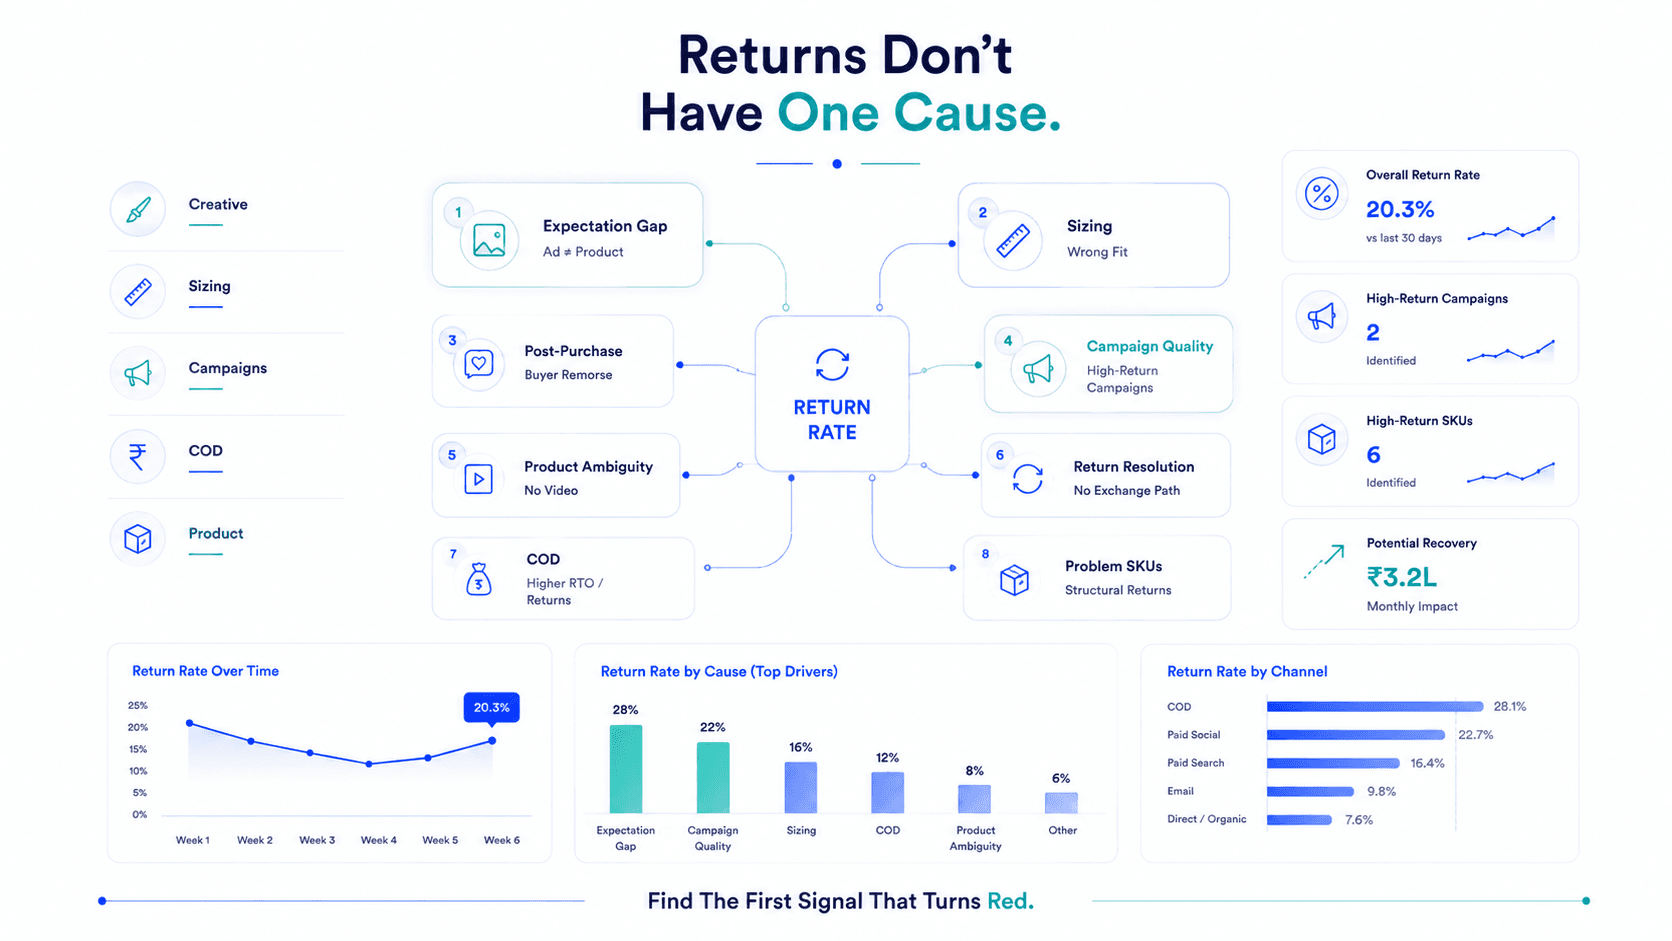
The most common cause of D2C returns is a mismatch between what the ad showed and what the customer received.
Over-lit studio photography. AI-enhanced colours that don't match the physical product. Models styled and posed in ways the product alone can't replicate. Aspirational claims the product can't substantiate for every buyer.
When the customer opens the package and thinks “this isn't what I expected”, that expectation was set by your ad, not by the product.
The fix:
Test realistic creative alongside aspirational creative and track return rates per creative type using UTM data. Most D2C brands find that UGC-style creative (less polished, more authentic) drives lower return rates than studio photography, because it sets accurate expectations.
For fashion: show the product on multiple body types, in natural lighting, in actual use. The customer who buys knowing exactly what they're getting returns far less often than the customer who bought the aspirational version of the product.
For fashion, footwear, and home furnishings, sizing is the primary return driver. Customers guess wrong. The product doesn't fit. It comes back.
The solution isn't a size chart buried in the product page footer. It's making size guidance the most prominent element of the purchase decision.
What works:
Brands that implement comprehensive size guidance consistently see 15–25% reductions in size-related returns within 60 days.
Returns are not decided at the delivery moment. They're decided in the window between purchase and delivery, when buyer's remorse sets in, when a partner questions the spend, when the customer sees a competitor's lower price.
A post-purchase reinforcement sequence fills that window with reasons to keep the product before it even arrives.
Order confirmation (immediate): Excitement reinforcement
“Great choice, here's what to expect.”
Day 2: Usage guide
“What to do when it arrives” content. Gives the customer a plan for the product, not just possession of it.
Day 5 (or day of delivery): Social proof
Reviews from customers who had similar concerns before buying. “People who worried about X loved Y.”
Brands implementing this three-message sequence typically see 8–15% return rate reduction within the first 45 days, without changing the product, the pricing, or the creative.
Not all campaigns have the same return rate. Discount-driven campaigns have higher return rates than full-price campaigns. Broad prospecting campaigns have higher return rates than brand-search campaigns. COD campaigns have higher return rates than prepaid.
Most brands apply a blended return rate to all campaigns, which means they can't see that Campaign A has a 9% return rate while Campaign B has a 26% return rate. And they can't act on what they can't see.
The fix:
Tag every order with its acquisition campaign UTM source. Pull return data from Shopify filtered by UTM source. Calculate return rate per campaign. This analysis almost always reveals that 2–3 campaigns are responsible for a disproportionate share of all returns.
Pausing or restructuring high-return campaigns, even if their ROAS looks acceptable, often improves overall POAS significantly because the return economics are so destructive.
Text descriptions and static images create ambiguity. Customers fill ambiguity with best-case assumptions. When reality doesn't match, they return.
A short product video (30–60 seconds) showing the product in actual use, real texture, real scale, real colour, real movement for apparel, removes most of the ambiguity that drives returns.
For fashion
A 30-second walk-around video of the garment being worn, with fabric texture visible and movement shown, consistently reduces return rates by 12–20% for specific products.
For home goods
Scale demonstration (product next to a familiar object for size reference) and texture close-ups address the two most common return triggers.
Production cost: ₹2,000–8,000 per product with a smartphone and a ring light. Return rate reduction payback on a high-volume SKU is typically 2–4 weeks.
Before a customer can submit a return, require them to engage with a resolution attempt.
This isn't gatekeeping, it's an opportunity to solve the problem that's making them return.
A simple pre-return flow:
Brands implementing pre-return resolution flows see 15–30% of initiated return requests resolved without a return occurring, through exchanges, store credit acceptance, or problem-solving that addresses the underlying issue.
COD is a conversion accelerator in India, it removes payment friction and drives orders from customers who don't trust prepaid checkout. But COD customers have significantly higher return and RTO (Return to Origin) rates than prepaid customers across almost every D2C category.
The solution isn't eliminating COD, it's selectively incentivising prepaid.
Offer at checkout:
Converting 20% of COD orders to prepaid typically reduces overall return/RTO rate by 4–8 percentage points, a significant improvement in POAS without touching the campaigns that acquired those customers.
Some products have structural return problems, sizing that's consistently inconsistent, quality that doesn't hold up to initial inspection, or a price-value proposition that looks good in the ad and disappoints in person.
The data will tell you which ones. Pull return rate by SKU from your Shopify returns data. Sort descending. The top 10–15% of SKUs by return rate are almost certainly responsible for 40–50% of all returns.
For these products: fix the underlying problem (quality, sizing, expectation setting) or remove them from paid advertising. A product that consistently returns at 35% should not be supported by ad spend regardless of its ROAS, because its real contribution margin is probably negative.
| Tactic | Time to See Impact |
|---|---|
| Pause high-return campaigns | 2–3 weeks (immediate spend reduction, return data lags) |
| Add product video | 3–4 weeks |
| Deploy post-purchase sequence | 3–6 weeks |
| Pre-return resolution flow | 4–6 weeks |
| Fix ad creative expectation gaps | 4–8 weeks |
| Improve size guidance | 4–8 weeks |
| COD-to-prepaid incentive | 4–6 weeks |
| Sunset high-return SKUs from ads | Immediate CM2 improvement |
Start with the tactics that show impact fastest, pausing high-return campaigns and implementing the post-purchase sequence, while building the longer-term fixes in parallel.
Every percentage point reduction in return rate improves your POAS directly and permanently. A brand at 20% return rate that moves to 14% effectively recovers 6% of gross revenue that was previously lost, with no increase in ad spend.
Return rate is not a customer service problem. It's a performance marketing problem. It lives in your CM2 calculation, it damages your POAS, and it makes campaigns look profitable when they aren't.
Fix the expectation. Fill the delivery window. Identify the culprit campaigns. The margin that returns is the most efficient revenue you'll ever recover.
Varies by category: Fashion 15–25%, Electronics 10–20%, Beauty 8–15%, Supplements 5–10%, Food 3–8%. Rates above these benchmarks indicate structural problems: expectation gaps, sizing inconsistency, COD audience quality, or campaign-level targeting issues.
Identifying and pausing high-return campaigns (using UTM-tracked return data) shows the fastest CM2 improvement, typically within 2–3 weeks. It doesn't fix the underlying return problem but immediately improves POAS by removing the worst offenders from active spend.
Returns reduce net revenue without reducing ad spend. A campaign with 20% returns has approximately 20% less revenue than the platform reports, while all variable costs (shipping, COGS on returned units, reverse logistics) remain or increase. A 20% return rate on a campaign can shift POAS from 1.3x to 0.9x — from profitable to loss-making.
A step before the full return form where customers are offered alternatives: size exchanges, store credit, photo-based support for 'not as expected' returns, or a direct replacement for defective products. Brands implementing this resolve 15–30% of return requests without the product being physically returned.
Flable connects Shopify return data to campaign performance, showing return-adjusted POAS and CM2 per campaign in real time. This makes it immediately visible which campaigns are losing money due to high return rates, even when their platform-reported ROAS looks acceptable.
Connect Shopify return and refund data directly to campaign-level POAS and CM2. See exactly which ads acquire high-return buyers in real time.