Understanding and Utilizing Attribution Models in Flable
Your attribution model can tell you exactly which channel closed the sale. It cannot tell you if that sale made you any money. Here's how to read all five models Flable supports and why the read changes completely once contribution margin enters the picture.
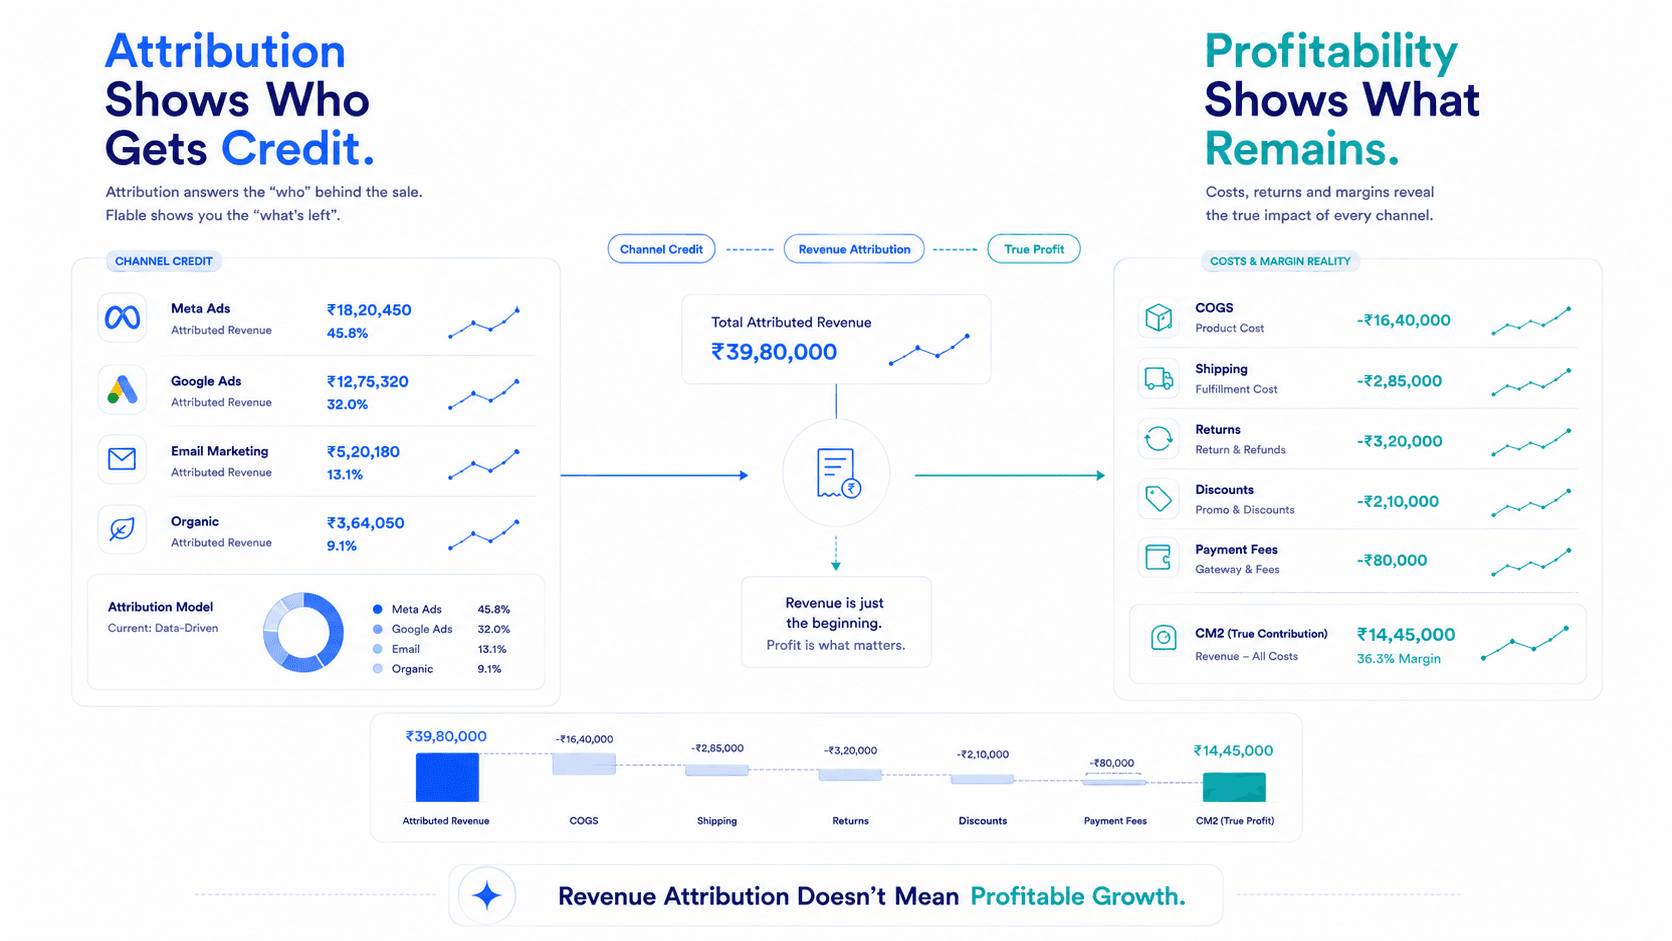
Why Attribution Alone Isn't the Full Answer
Every D2C brand eventually asks the same question: which channel actually deserves the credit for a sale? Attribution models exist to answer that by tracing the customer's path across ads, emails, and organic touchpoints and assigning credit along the way.
The problem is that even a perfect attribution model only measures revenue. It can tell you, with full confidence, that Meta drove ₹18 lakh in attributed sales last month. What it cannot tell you is what those sales cost you, the COGS on that specific product mix, the shipping and fulfillment per order, the return rate on that channel's customers, or the discount codes stacking on top. That's a different question entirely, and it's the one Flable is built to answer.
THE PROFIT BLIND SPOTFlable supports six attribution models First Touch, Last Touch, Linear, Time Decay, Position-Based, and Data-Driven so you can choose the lens that fits the decision in front of you. But every model in Flable is reconciled against real contribution margin (CM1/CM2/CM3), so 'which channel gets the credit' and 'which channel actually made you money' stop being two separate spreadsheets.
The Six Attribution Models in Flable
Single-touch models (First Touch, Last Touch) are best for fast, directional reads. Linear, Time Decay, and Position-Based each spread credit across the whole path with different weighting logic. Data-Driven uses your own conversion data to assign credit algorithmically, with no fixed rule at all.
First Touch
First Touch gives 100% of the attribution credit to the very first touchpoint in a customer's recorded journey — the ad, post, or search that started it all, regardless of what happened afterward.
- You want to know which channels are genuinely expanding your funnel, not just harvesting demand someone else created.
- You're evaluating top-of-funnel or awareness campaigns that aren't expected to convert directly.
- Surfaces channels that quietly do the hard work of introducing new customers to the brand.
- Protects upper-funnel spend from being written off just because it doesn't show up on a Last Touch report.
- Ignores every touchpoint after the first one, so it says nothing about what actually closed the sale.
- Says nothing about whether the customer it credits was profitable to acquire in the first place.
Last Touch
Last Touch gives 100% of the credit to the final touchpoint immediately before purchase. It's the most widely used model in performance marketing because it's fast, simple, and matches how most ad platforms report their own numbers.
- You need a quick, day-to-day read on what's converting right now for bid and budget decisions.
- You're running short-cycle campaigns where the path to purchase is only one or two steps.
- The easiest model to explain to a founder or a client on a reporting call.
- Matches Meta and Google's own in-platform reporting closely, which makes cross-checking simple.
- Systematically over-credits bottom-funnel, demand-capture channels like Search and Retargeting.
- Is the model most likely to tell you to 'scale' a channel right before contribution margin data shows it's barely breaking even, or losing money once returns and COGS are factored in.
Linear
Linear splits credit equally across every touchpoint in the journey, from the first interaction to the last, regardless of position.
- You want an unbiased baseline view of your full channel mix before layering in any other logic.
- You're auditing a channel portfolio and don't want any single touchpoint over- or under-valued by default.
- Simple, transparent logic, no single channel is artificially favored for being first or last.
- Useful as a sanity check against models that over-weight one end of the journey.
- Dilutes credit evenly even when common sense says one touchpoint clearly mattered more than another.
- Has no concept of cost, so a ₹40 CAC touchpoint and a ₹600 CAC touchpoint get treated identically.
Time Decay
Time Decay assigns more credit to touchpoints that happened closer to the purchase, and progressively less to touchpoints further back in the journey.
- Your category has a longer consideration window apparel, consumer electronics, or higher-AOV products where customers browse over days or weeks.
- You want more nuance than Last Touch without going fully equal-weighted like Linear.
- Reflects the reality that a touchpoint from three weeks ago usually mattered less than one from yesterday.
- Smooths out some of Last Touch's tendency to hand everything to the final click.
- Still built entirely on revenue and recency it has no visibility into margin, returns, or COGS.
- Can still over-reward a channel that happens to sit late in the journey without actually driving the decision.
Position-Based
Position-Based attribution sometimes called U-shaped gives 40% of the credit to the first touchpoint, 40% to the last touchpoint, and splits the remaining 20% evenly across whatever happened in between. It's a deliberate compromise between First Touch and Last Touch, built on the idea that the channel that created the demand and the channel that closed it both deserve the biggest share of the credit.
- You want to credit both the discovery moment and the closing moment without ignoring the middle of the journey entirely, the way First Touch and Last Touch each do.
- You're evaluating a funnel with a clear top-of-funnel awareness channel and a clear bottom-of-funnel closing channel, and want both recognized.
- Balances the two extremes of First Touch and Last Touch in a single model, so neither the opening nor the closing touchpoint gets ignored.
- Still acknowledges the middle of the journey, unlike First Touch or Last Touch, which drop it completely.
- The 40/40/20 split is a fixed assumption, not something learned from your data it can just as easily overstate the ends of a journey as it can accurately reflect them.
- A high-effort middle touchpoint, like a multi-step retargeting sequence or a WhatsApp nurture flow, can still be under-credited relative to the actual influence it had.
Data-Driven
Data-Driven attribution uses your actual historical conversion data to algorithmically determine how much credit each touchpoint deserves, based on real patterns rather than a fixed rule like 'first,' 'last,' or 'equal.'
- You have enough order and conversion volume for the model to find genuine patterns this model needs data to learn from.
- You want the least biased read available across your full channel mix, without picking a fixed rule yourself.
- Adapts to how your specific customers actually behave, instead of forcing every journey through the same fixed logic.
- Generally the most statistically defensible of the five models when volume supports it.
- Needs meaningful order volume and clean tracking to produce a stable, trustworthy read thin data can produce a model with no real pattern to learn from.
- Still a revenue-attribution answer at its core the most honest version of 'which channel gets credit,' not an answer to 'which channel is profitable.'
How Direct Traffic Behaves Across Models
Direct is one of the most misread sources in any attribution stack, it captures customers who typed your URL directly, opened a saved bookmark, or arrived through a channel that stripped referrer data. How much credit it gets depends entirely on which model you're using.
| Model | How Direct Behaves |
|---|---|
| First Touch | Gets full credit only if it's genuinely the first recorded interaction no prior ad click, no prior visit. |
| Last Touch | Frequently over-credited here. A customer who saw three ads and then typed the URL directly still hands 100% of the credit to Direct. |
| Linear | Gets an equal, undifferentiated share alongside every other touchpoint in the path. |
| Time Decay | Gets weighted heavily when it's the final step, for the same reason Last Touch over-credits it recency wins. |
| Position-Based | Gets a guaranteed 40% share whenever it lands as the first or last touchpoint, and only a small slice of the remaining 20% otherwise regardless of how little it actually influenced the decision. |
| Data-Driven | Gets whatever share the model's pattern-matching actually supports usually the most honest read of the five, but only as good as your tracking coverage. |
Note: If Direct looks unusually high on a Last Touch or Time Decay report, check UTM tagging on recent campaigns before concluding that word-of-mouth or brand recall is driving the spike.
From Attribution to Profit: Where Flable Goes Further
Pick any of the five models above and you'll get a defensible answer to 'which channel deserves the credit.' None of them, on their own, can answer the question that actually determines whether you should scale a channel: was the revenue worth generating?
CM2 — The Reality Check for ROAS
That's the layer Flable adds on top of every model. Once attribution assigns credit, Flable reconciles that credit against real contribution margin, subtracting COGS, shipping and fulfillment, return rates, coupon stacking, and payment processing from the attributed revenue.
The result is Profit on Ad Spend (POAS) and CM1/CM2/CM3 by channel, campaign, and SKU, not just ROAS.
This is the gap that trips up most D2C teams: a channel can win the most credit under any attribution model, sit at a strong ROAS, and still be quietly losing money once returns and backend costs are counted. Attribution tells you what happened. Contribution margin tells you whether it was worth it.
How to Action This Data
- •Awareness and funnel-building decisions: read First Touch.
- •Day-to-day bid and budget calls: read Last Touch, but confirm with CM2 before scaling.
- •A neutral baseline across your whole mix: read Linear.
- •Longer consideration-cycle categories: read Time Decay.
- •Crediting both the discovery channel and the closing channel: read Position-Based.
- •The least biased, volume-supported read: use Data-Driven where you have enough order history.
- •Before you scale any of the above: check POAS and CM2, not just ROAS.
Frequently Asked Questions
Which attribution model should I use as my default?
There's no single right answer it depends on the decision you're making. Last Touch is the fastest for daily optimization; Position-Based is a good middle ground if you want both the discovery and closing channel recognized; Data-Driven is generally the most statistically honest if you have the order volume to support it. Most Flable brands use Last Touch, Position-Based, or Data-Driven day-to-day, then check the same channel's CM2 before committing more budget.
How is Position-Based different from Time Decay?
Time Decay spreads credit gradually across every touchpoint, weighting recent ones more heavily. Position-Based makes a fixed assumption instead: 40% to the first touchpoint, 40% to the last, and just 20% split across everything in the middle regardless of how many touchpoints that middle contains or how recent they were.
Why does my Direct traffic look inflated?
This is almost always a Last Touch or Time Decay artifact combined with incomplete UTM tagging. A customer who saw three ads and then typed your URL directly hands all the credit to Direct under those models. Check campaign tagging first.
Can a channel look great on attribution and still be unprofitable?
Yes, and it's one of the most common blind spots in D2C marketing. A channel can win the most credit under any of the five models, show a strong ROAS, and still generate negative CM2 once COGS, shipping, returns, and discounts are factored in. That's exactly the gap Flable is built to close.
Does switching attribution models change my contribution margin numbers?
It changes how credit for a given order is distributed across channels, not the actual margin on that order. Flable applies your chosen attribution model to distribute CM1/CM2/CM3 the same way it distributes revenue, so the profit picture stays consistent underneath whichever lens you're using.
Your attribution model says a channel deserves the credit. Does it deserve the budget?
Book a Flable walkthrough with your own data. We'll show you CM1/CM2/CM3 and POAS behind your best-performing channels under whichever attribution model you already trust.
See Your Real Channel Profitability →