Deep Dive
You check Meta. ROAS: 3.9x. Strong.
You check Google. ROAS: 4.6x. Even better.
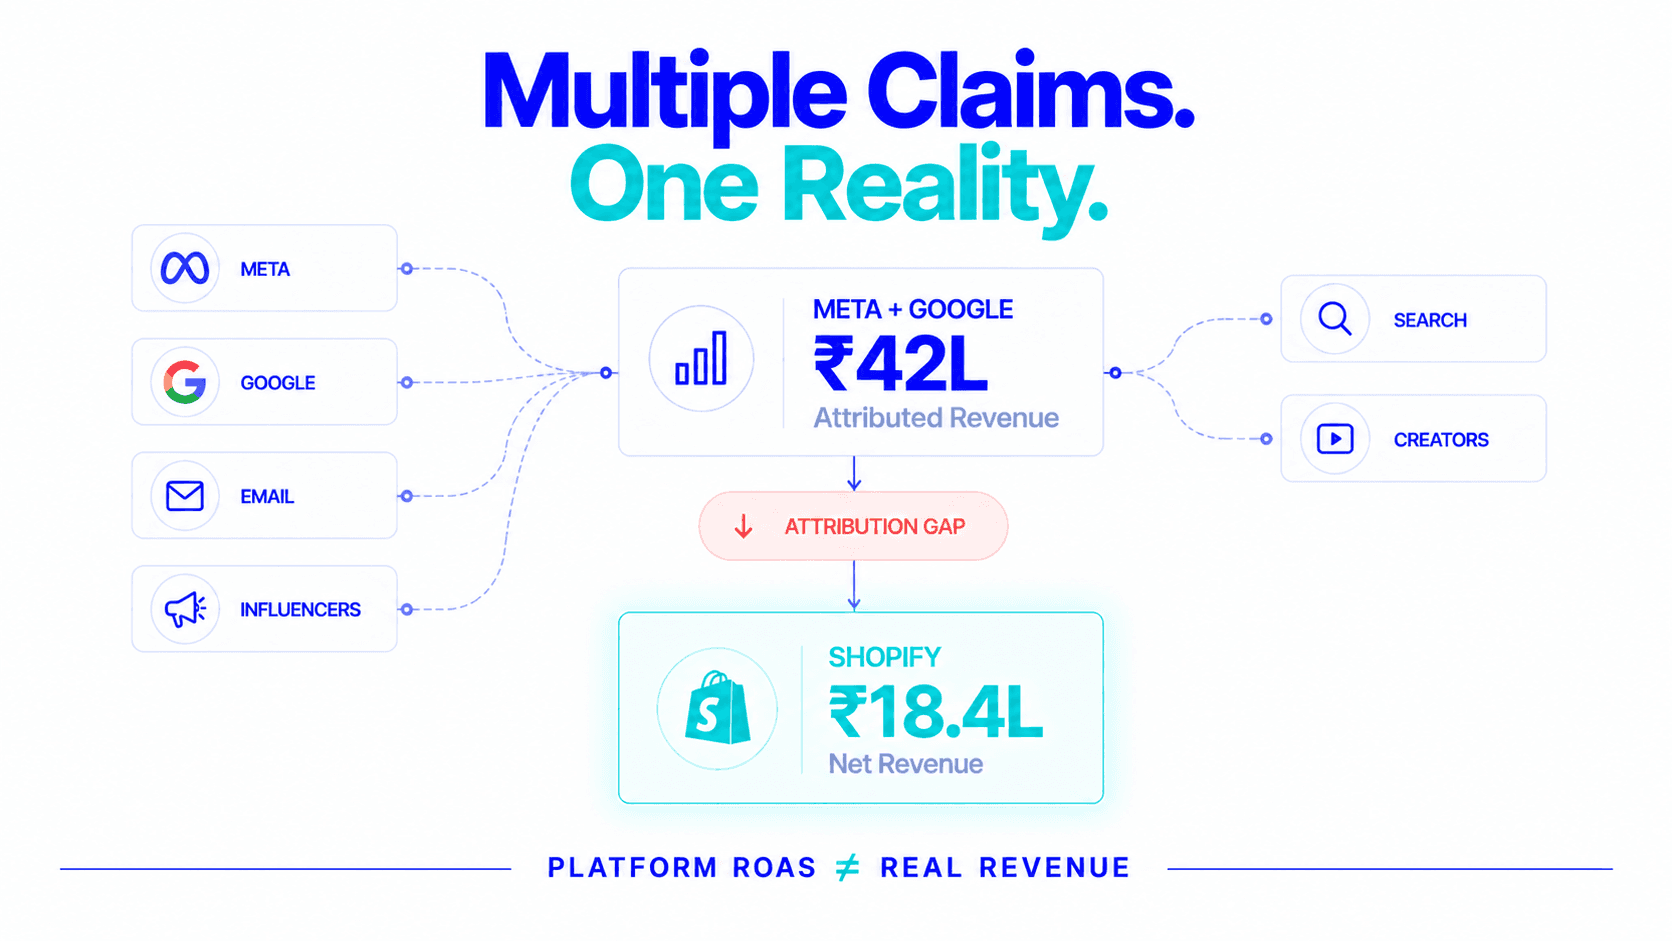
You open Shopify. Net revenue last week: ₹18,40,000.
You add up your combined platform-attributed revenue. ₹42,00,000.
That gap isn’t a glitch. It’s the attribution inflation that’s been distorting every ROAS number you’ve looked at, and the reason why Marketing Efficiency Ratio (MER) exists.
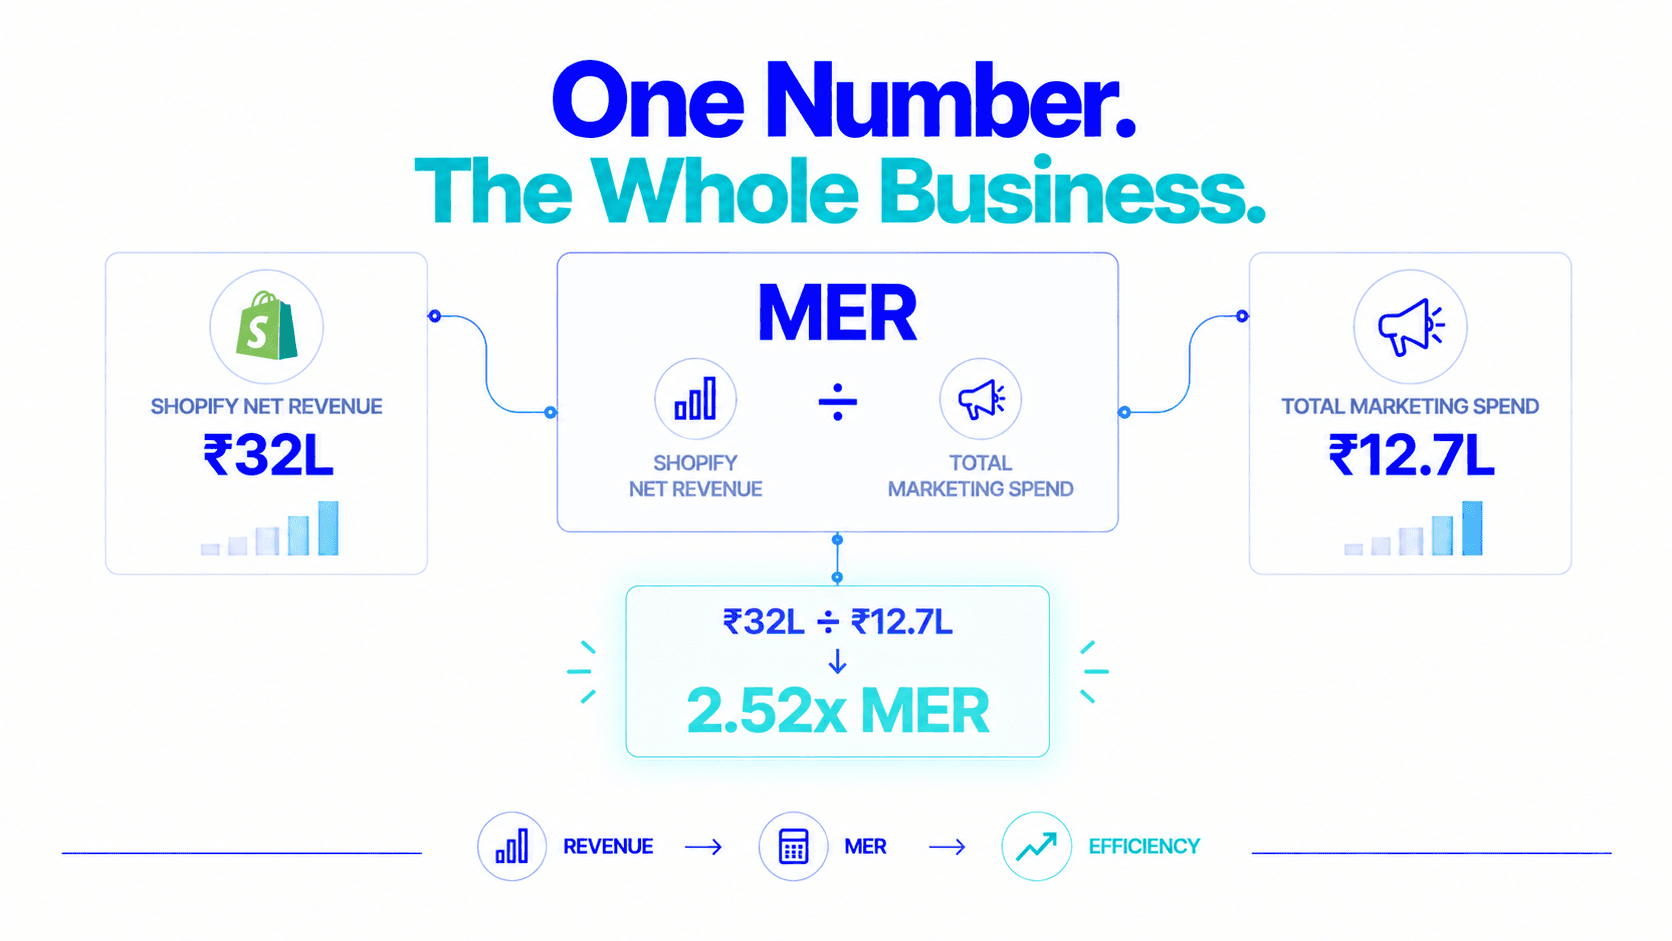
MER = Total Net Revenue (Shopify) ÷ Total Marketing Spend (All Channels)
MER is the ratio of your real Shopify net revenue, after returns, after refunds, after discounts, to everything you spent on marketing across all channels.
Not platform-attributed revenue. Not Meta’s claimed figure. Not Google’s claimed figure.
Shopify net revenue. The money that actually came in.
This single distinction makes MER the most attribution-proof marketing metric available to D2C brands. It doesn’t care which platform claims what. It just measures the aggregate relationship between total marketing investment and total real revenue.
When a brand runs Meta and Google simultaneously, attribution overlap is structural.
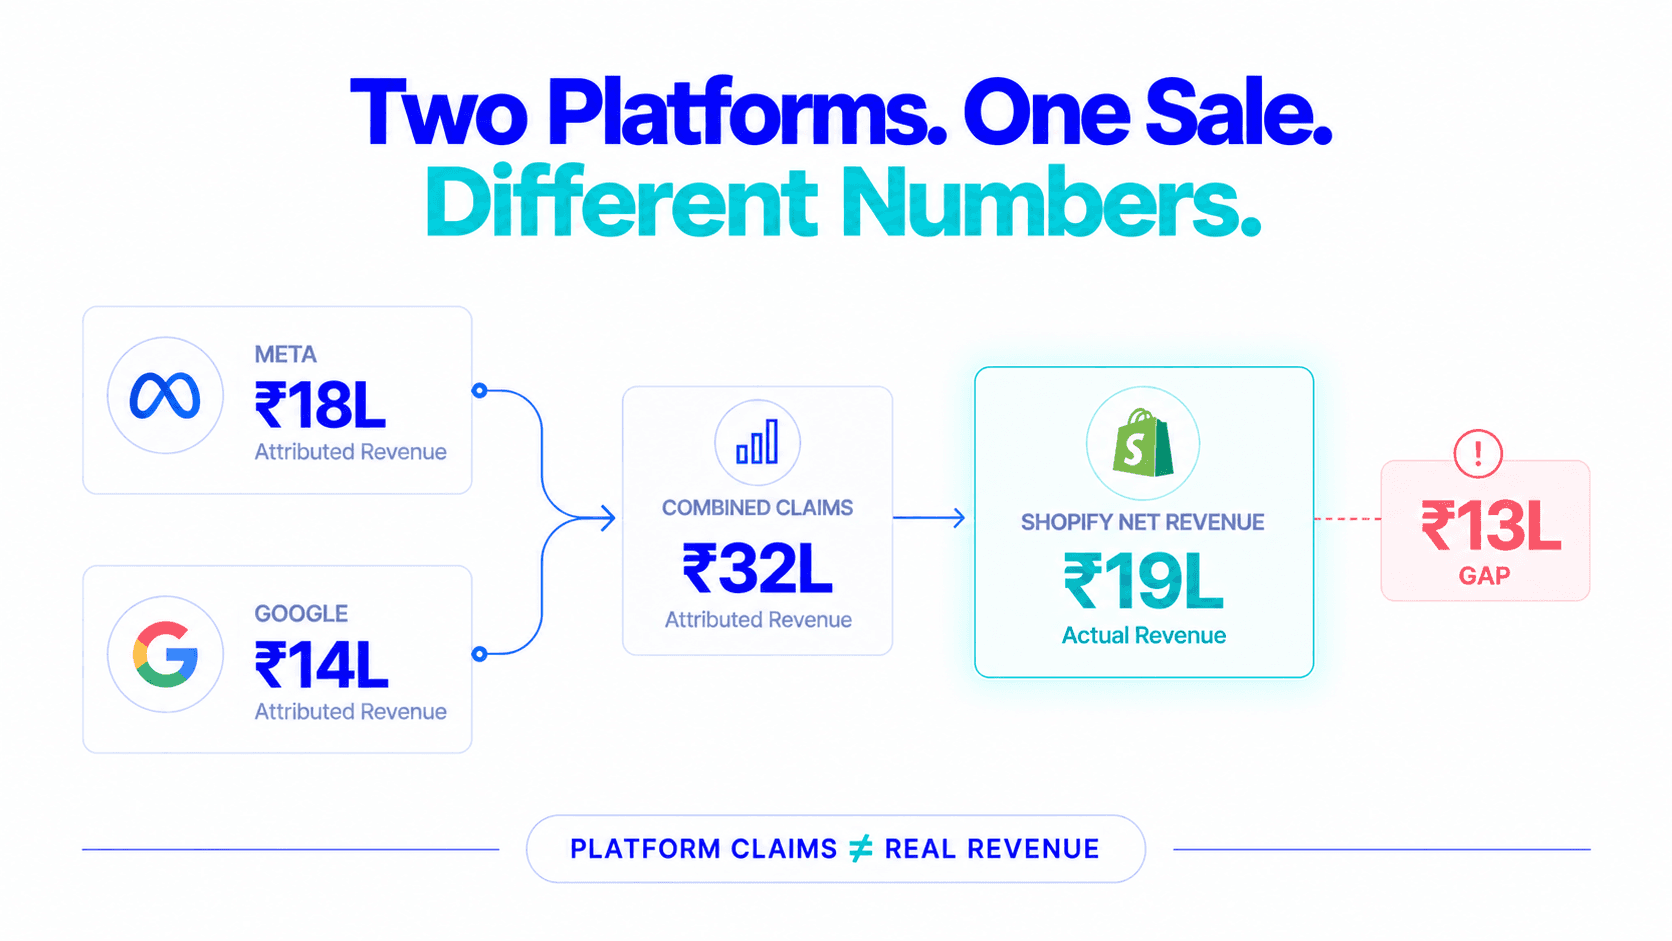
A customer sees your Meta ad on Monday, searches your brand on Google on Wednesday, and purchases through a Google Shopping click on Thursday. Meta records this as a view-through conversion. Google records this as a click conversion. Shopify records one sale.
Both platforms are correct by their own rules. Combined, they’ve claimed one sale twice.
For brands running Meta + Google + email + influencer, combined platform-attributed revenue typically runs 40–80% above actual Shopify net revenue. Individual channel ROAS numbers become effectively meaningless for cross-channel comparison, you’re comparing self-reported numbers from platforms that each have every incentive to claim as much credit as possible.
MER cuts through this entirely. By using Shopify net revenue as the numerator and all marketing spend as the denominator, it produces a single honest efficiency ratio that no platform can inflate.
Pull Shopify net revenue for the period.
Go to Shopify Analytics → Sales → select the date range. Use Net Sales (excludes refunds and returns). This is your numerator.
Sum all marketing spend for the same period.
Include:
This is your denominator.
Divide.
MER = Shopify Net Revenue ÷ Total Marketing Spend
Example: last 30 days
For every rupee spent on marketing, ₹2.52 came back as real Shopify revenue.
| MER | ROAS | |
|---|---|---|
| Revenue source | Shopify net revenue (real) | Platform-attributed revenue (claimed) |
| Attribution | None, uses single source of truth | Platform’s own attribution model |
| Cross-channel comparison | Works, uses one denominator | Unreliable, different models per platform |
| Per-campaign visibility | Aggregate only | Per campaign and ad set |
| Accounts for returns | Yes (net revenue is post-returns) | No (attributed revenue not adjusted) |
| Immune to platform inflation | Yes | No |
| Right for scaling decisions | Aggregate signal only | Incomplete (misses COGS/returns) |
Use MER for
Weekly trend monitoring, cross-channel efficiency, agency accountability, investor conversations.
Use ROAS for
In-platform creative testing, bid strategy setting, campaign-level delivery diagnosis.
Use POAS for
All scaling and killing decisions at the campaign level.
MER naturally declines as a brand grows, because larger brands invest more in upper-funnel brand building (influencers, awareness campaigns) with longer payback periods that don’t show up in short-window attribution.
| Stage | Revenue range | Target MER |
|---|---|---|
| Early | Under ₹1Cr MRR | 3.5–5.0x |
| Growth | ₹1–5Cr MRR | 2.8–4.0x |
| Scaling | ₹5–15Cr MRR | 2.2–3.5x |
| Established | ₹15Cr+ MRR | 1.8–3.0x |
A declining MER is not automatically bad, if LTV is improving simultaneously (customers acquired this year are worth more than customers acquired last year), the declining MER reflects a deliberate investment in longer-payback demand creation.
A declining MER with flat or declining LTV is the warning signal. It means marketing is becoming genuinely less efficient, not just harder to measure in short attribution windows.
MER’s power isn’t in any single week’s number, it’s in the trend. Track it weekly. Watch the direction:
Stable or improving
Total marketing efficiency is holding. Individual channel shifts may be noise rather than signal.
Declining 2+ weeks
Work through the four possible causes below.
CPM inflation across channels
Reach is becoming more expensive. Fix: improve creative quality, which reduces CPM through better engagement rates.
Rising return rates
Net revenue shrinking without changes in gross revenue or ad spend. Fix: identify high-return campaigns and restructure.
Declining customer quality
Recent cohorts showing lower 90-day repeat rates. Fix: tighten acquisition targeting, reduce discount depth on prospecting campaigns.
Channel mix shift toward low-incrementality spend
You’ve added Google Brand Search or scaled email retargeting that’s capturing organic demand rather than creating new demand. Fix: run incrementality test, reallocate toward higher-incrementality channels.
Most agencies report ROAS. It’s the metric native to their tools and optimisation context.
Introducing MER into your agency relationship shifts the accountability to business outcomes rather than platform metrics.
“Our Meta ROAS was 3.8x and our Google ROAS was 4.3x this week. Our combined platform-attributed revenue was ₹38L. Our Shopify net revenue was ₹21L. Our MER was 2.4x. Why is the gap widening and is that attribution overlap or is our real efficiency declining?”
An agency that can answer this question confidently is measuring the right things. An agency that deflects to individual campaign ROAS is not.
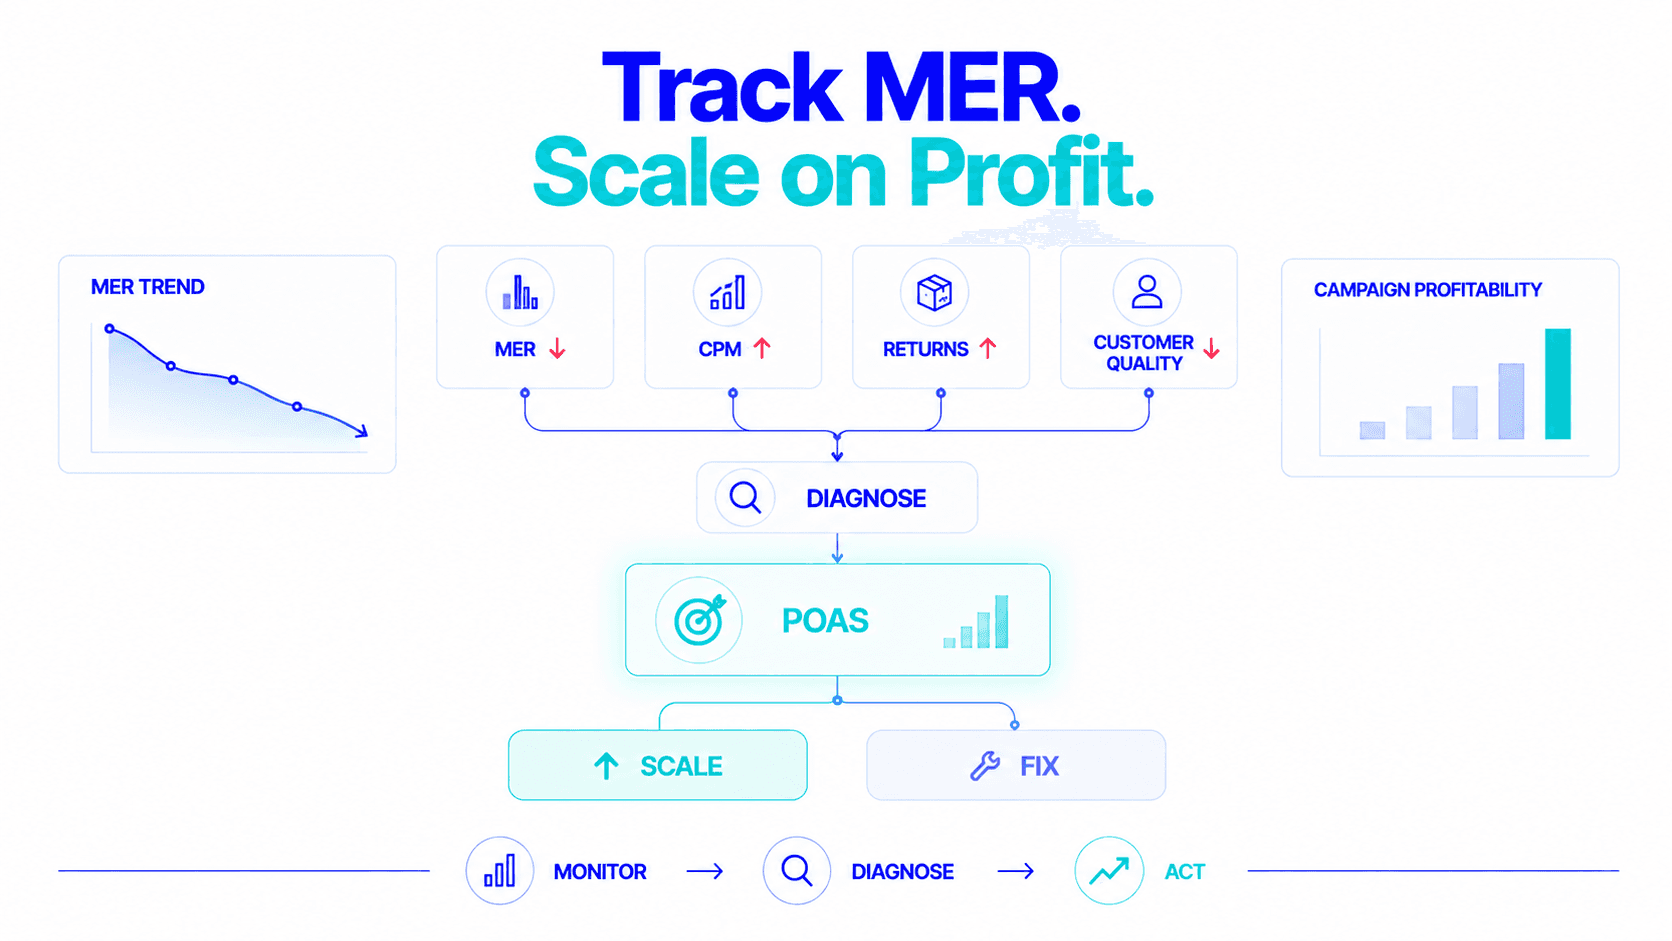
MER gives you the macro view. POAS gives you the campaign-level view. Together they give you the complete picture.
Weekly
Is aggregate marketing efficiency improving or declining? If declining, investigate.
Also weekly
Which campaigns are above your profitability threshold? Which are below? Scale above. Kill below.
MER looks fine but several campaigns have negative POAS: it usually means you have a few highly profitable campaigns subsidising several loss-making ones. The aggregate MER hides the campaign-level inefficiency.
The solution: cut the loss-making campaigns. MER will likely improve because you’re removing spend that wasn’t generating real net revenue proportionally.
Most D2C brands track MER manually, pulling Shopify revenue weekly and dividing by manually totalled spend. This is accurate but time-intensive and slightly stale by the time it’s calculated.
Flable AI connects your Shopify net revenue, Meta spend, Google spend, and returns data to calculate MER automatically, updated in real time alongside CM2 and POAS per campaign.
You see the macro picture (MER) and the campaign-level picture (POAS) in the same place, at the same time, without a spreadsheet session.
When MER declines, Flable’s per-campaign POAS data shows you exactly which campaigns are driving it. Not an hour of analysis. Immediate.
MER is not a replacement for ROAS. It’s the metric that tells you whether ROAS is lying to you.
When your platforms claim ₹42L in attributed revenue and Shopify net revenue is ₹18L, MER reflects the ₹18L. ROAS reflects the ₹42L.
MER is the honest number. Build your weekly review around it. Track the trend, not just the level. And use it alongside per-campaign POAS to understand both the aggregate picture and the specific campaigns driving it.
One number that can’t be gamed. One trend that always tells you something real. That’s what MER is.
MER = Total Shopify Net Revenue ÷ Total Marketing Spend. It measures the real revenue returned per rupee of total marketing investment, using Shopify's actual net revenue (post-returns) as the source, not platform-attributed figures. It's immune to cross-channel attribution overlap and platform self-reporting bias.
Depends on stage. Early-stage brands should target 3.5–5.0x. Growth-stage 2.8–4.0x. Scaling 2.2–3.5x. MER naturally declines with scale as brands invest in upper-funnel channels with longer payback windows.
ROAS uses platform-attributed revenue subject to attribution overlap and platform self-reporting bias. MER uses Shopify net revenue, a single source of truth unaffected by how platforms assign credit. For brands running multiple channels, MER is the reliable cross-channel efficiency metric; ROAS is useful for in-platform campaign diagnosis only.
Four common causes: CPM inflation (reach getting more expensive), rising return rates (net revenue shrinking without gross revenue changes), declining customer quality (recent cohorts showing weaker LTV), or channel mix shift toward low-incrementality spend. Diagnose which is primary before changing campaign strategy.
Flable AI calculates MER automatically alongside CM2 and POAS per campaign, so when MER drops you see which campaigns are driving it.