Financial Metrics
Here’s a story I hear more than I should.
D2C brand. 18 months old. Revenue growing 30% month-on-month.
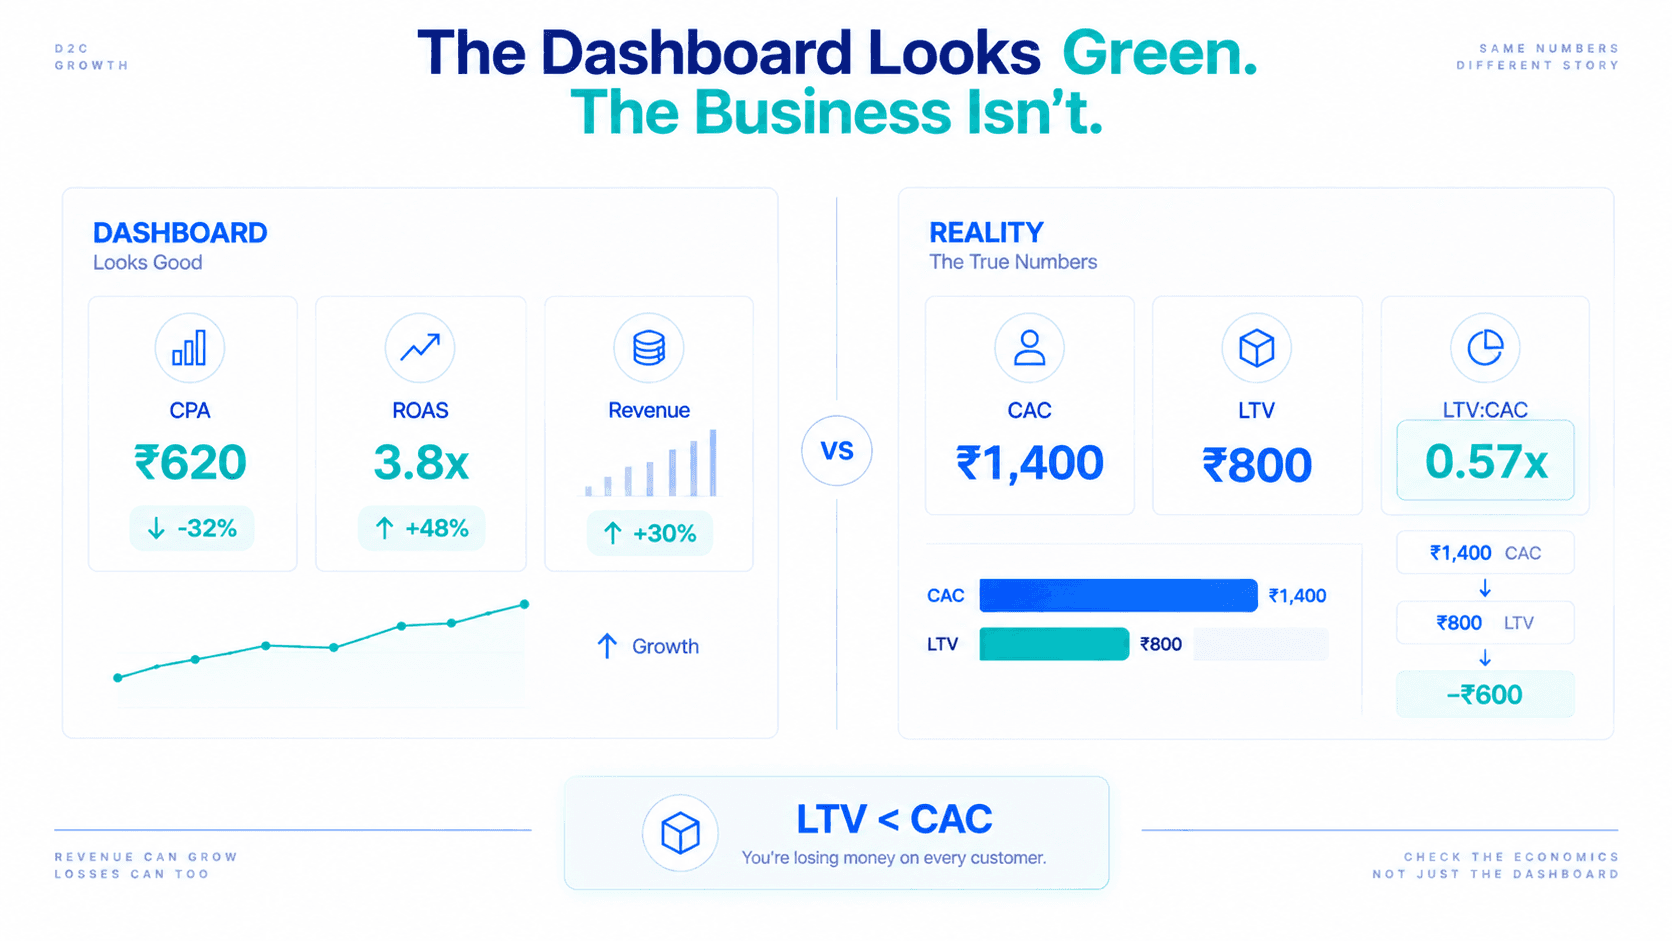
The founder is proud, rightly so. It’s not easy to build that kind of growth.
Then we run the numbers.
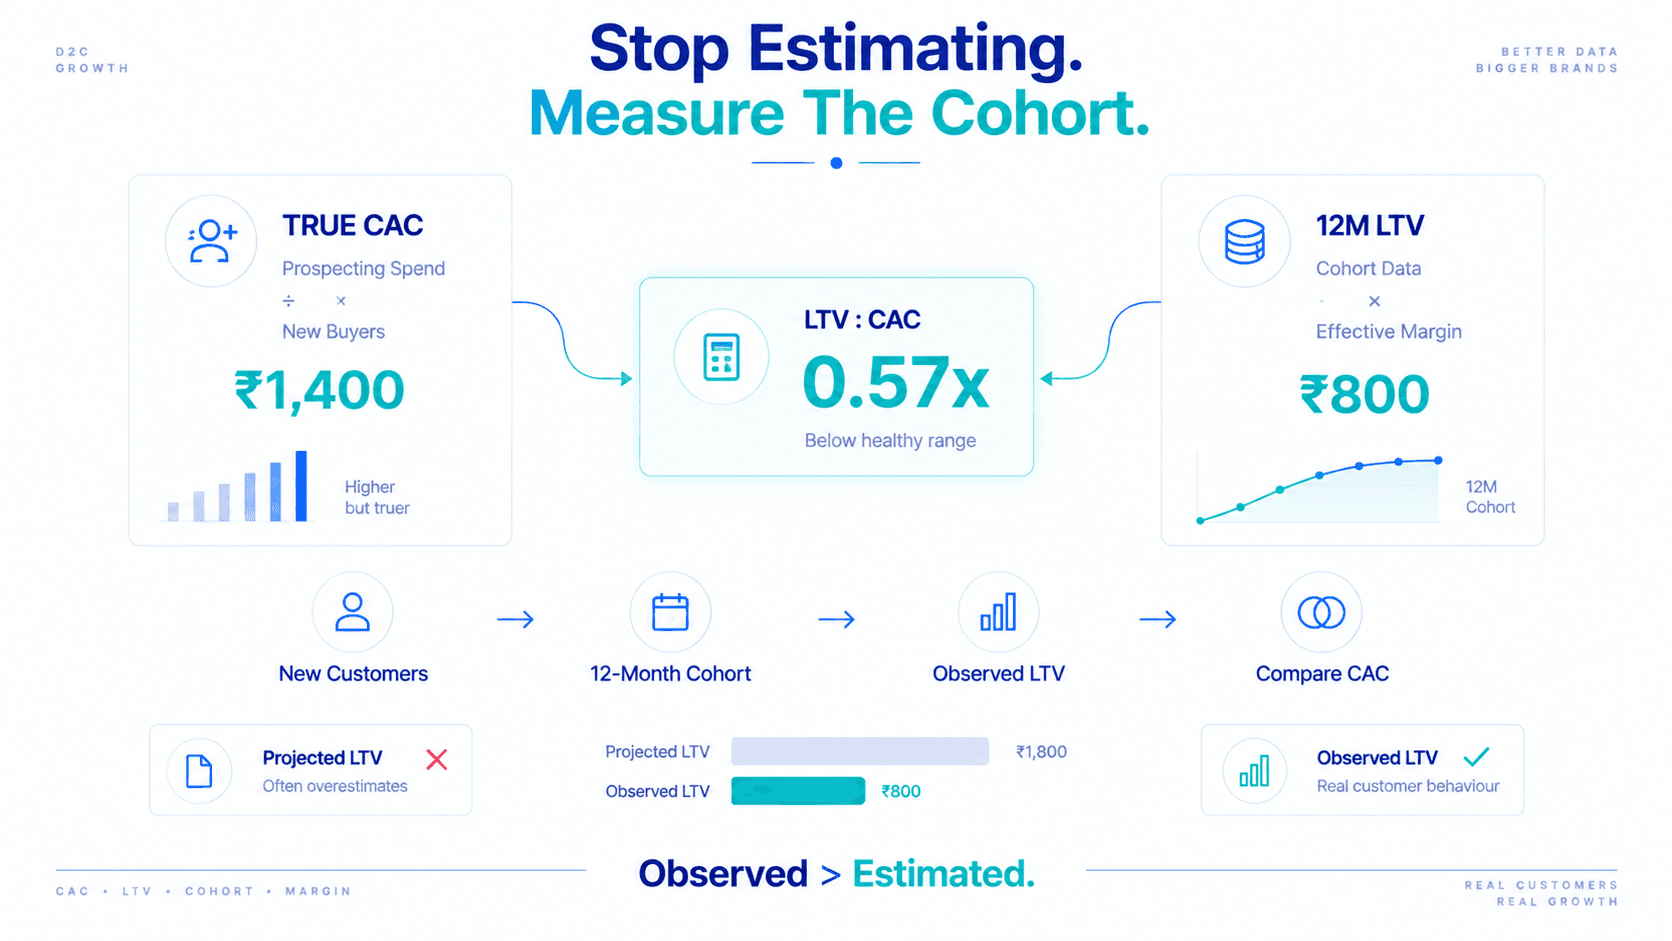
₹1,400
Return-adjusted, prospecting spend only
₹800
From cohort data, margin-adjusted
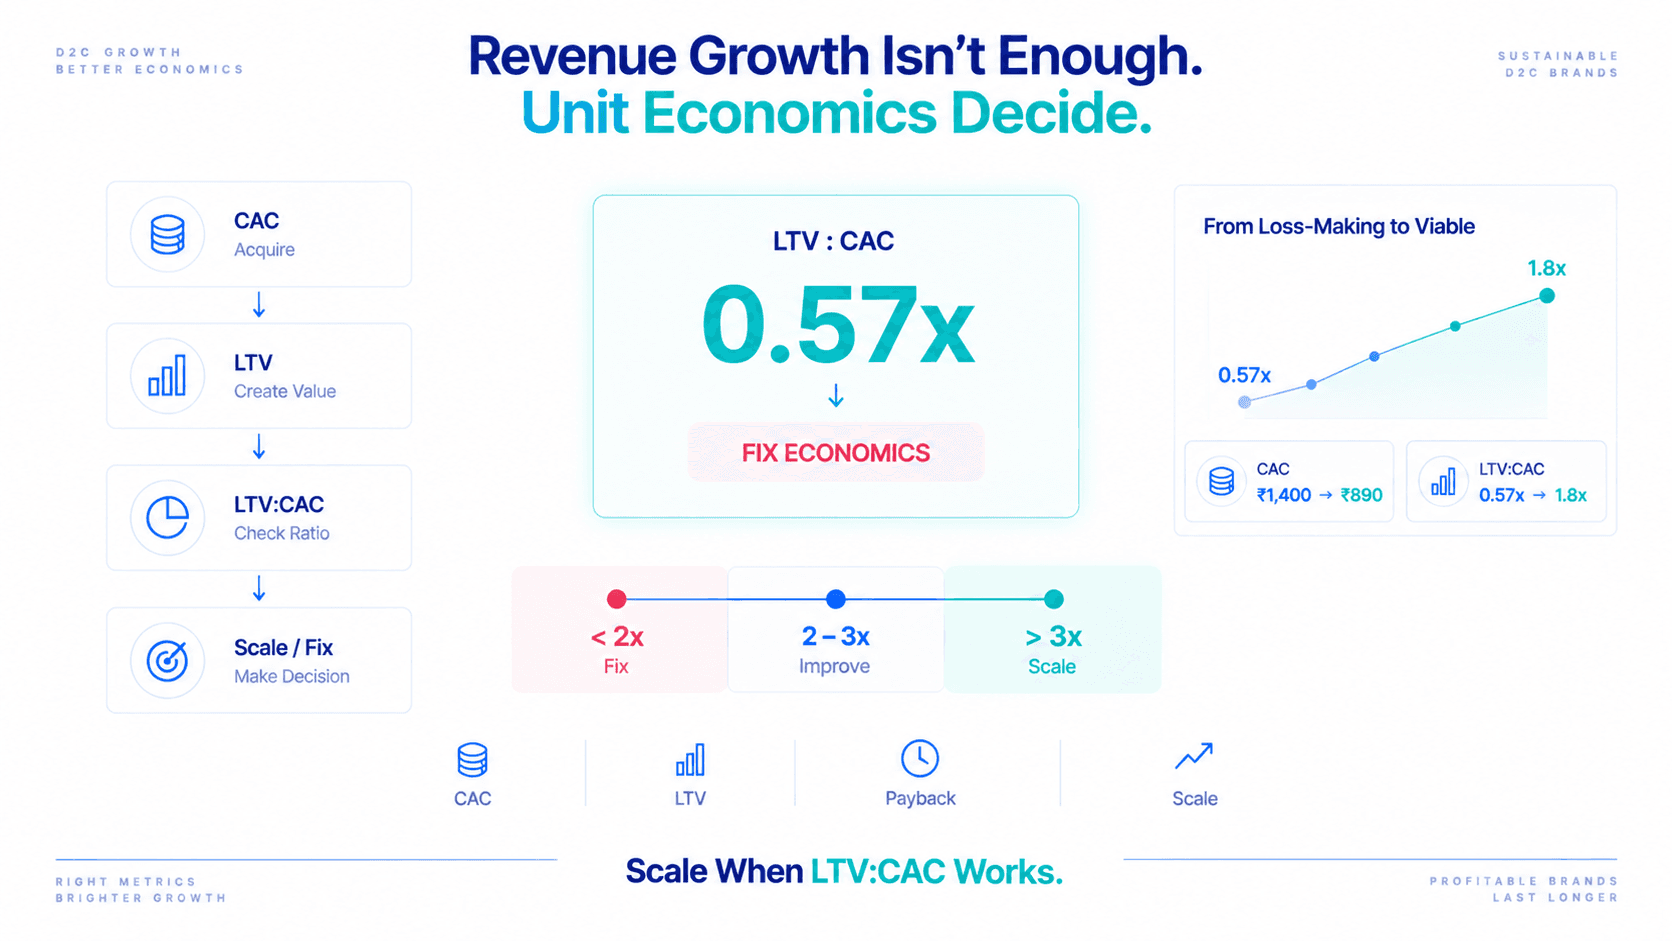
0.57x
−₹600 on every new customer
The brand is spending ₹1,400 to acquire a customer who will contribute ₹800 in gross profit over 12 months.
Every new customer costs them ₹600 more than they’ll ever contribute. Revenue grows. Cash disappears. The business is structurally loss-making, and has been for months.
No one told them. Because no one was measuring the right things.
It’s not carelessness. It’s what happens when you measure the wrong CAC and the wrong LTV.
How most brands calculate CAC
Total marketing spend ÷ Total orders
This blends new and returning customers. Returning customers convert at a fraction of the cost of new ones: they already know you, they’re already warm.
When you blend them together, your CAC looks lower than it is.
Take it further: “total orders” includes returns. Customers who returned their product were never acquired. But they’re in the denominator.
True new customer CAC
Prospecting spend only ÷ (Net new first-time buyers × (1 − return rate))
How most brands calculate LTV
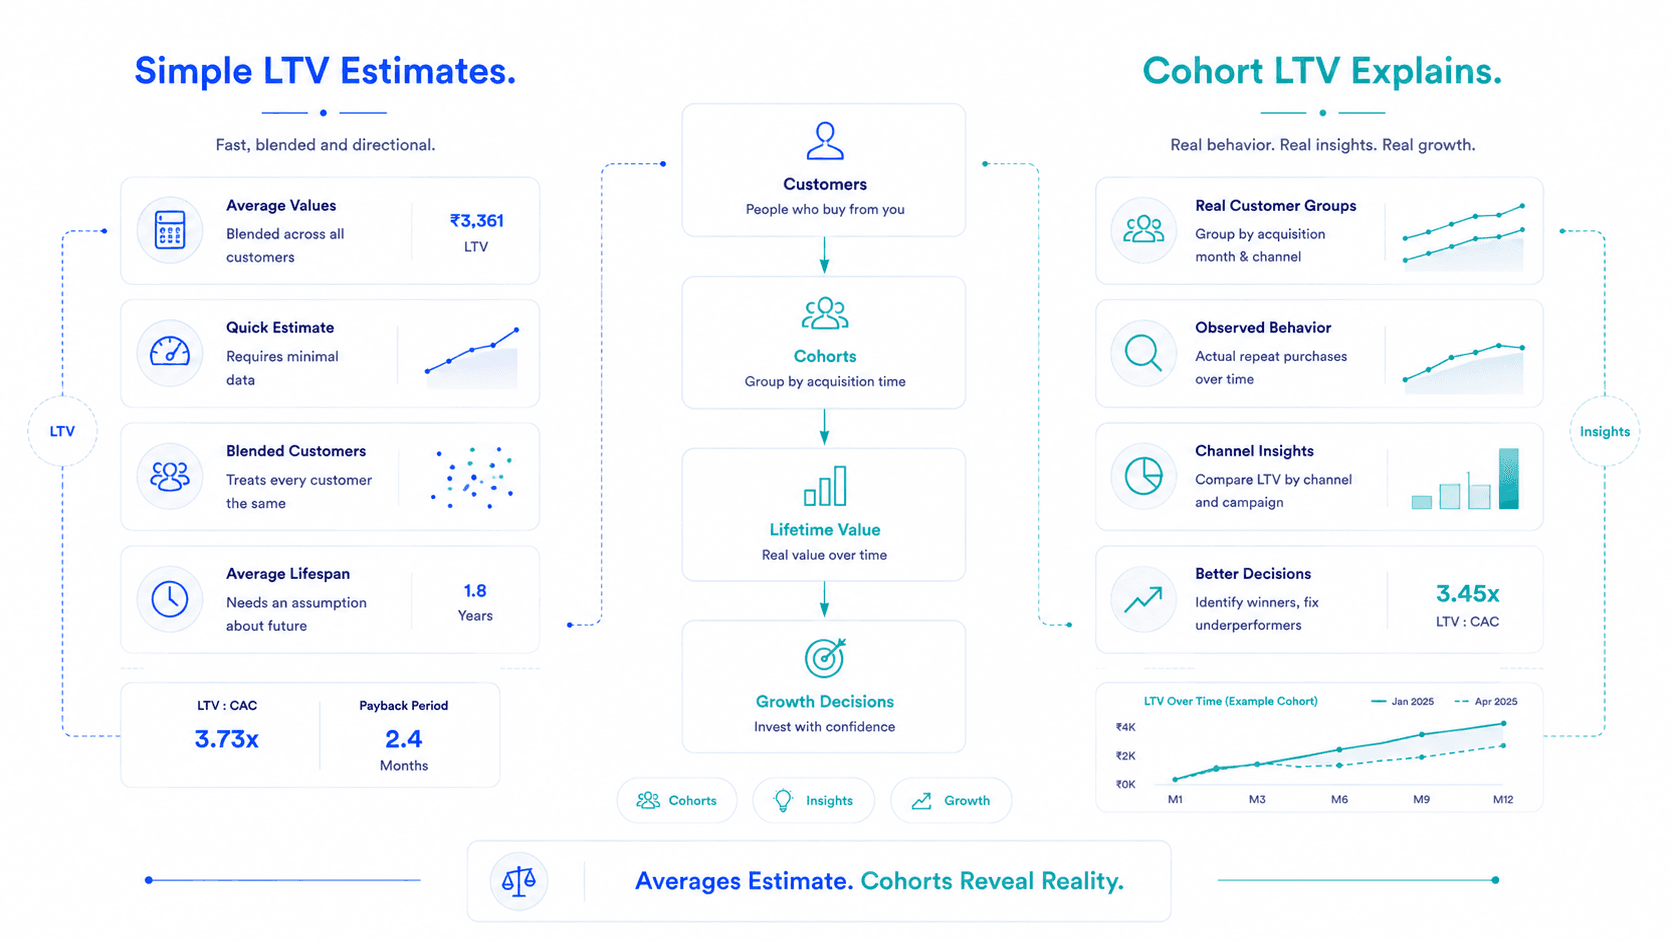
AOV × Purchase Frequency × Gross Margin × Lifespan
Three problems:
| LTV method | Result |
|---|---|
| Standard formula | ₹1,800 |
| Cohort data (observed purchase behaviour, 12 months) | ₹800 |
The brand in our story: the formula was off by 2.25x.
Pull your cohort data from Shopify.
Specifically: take every customer who made their first purchase exactly 12 months ago. Calculate their total gross margin contribution since then (all orders × effective margin %).
That number is your 12-month observed LTV.
Not projected. Not modelled. Observed.
Compare it to your true new customer CAC.
LTV < CAC
Your business model doesn’t work at current scale. Revenue growth is accelerating the problem, not solving it.
Below 2 : 1
LTV is above true CAC but your payback period may be creating a working capital problem.
Above 3 : 1
You have healthy unit economics. Scale aggressively.
Green arrows.
The standard performance report
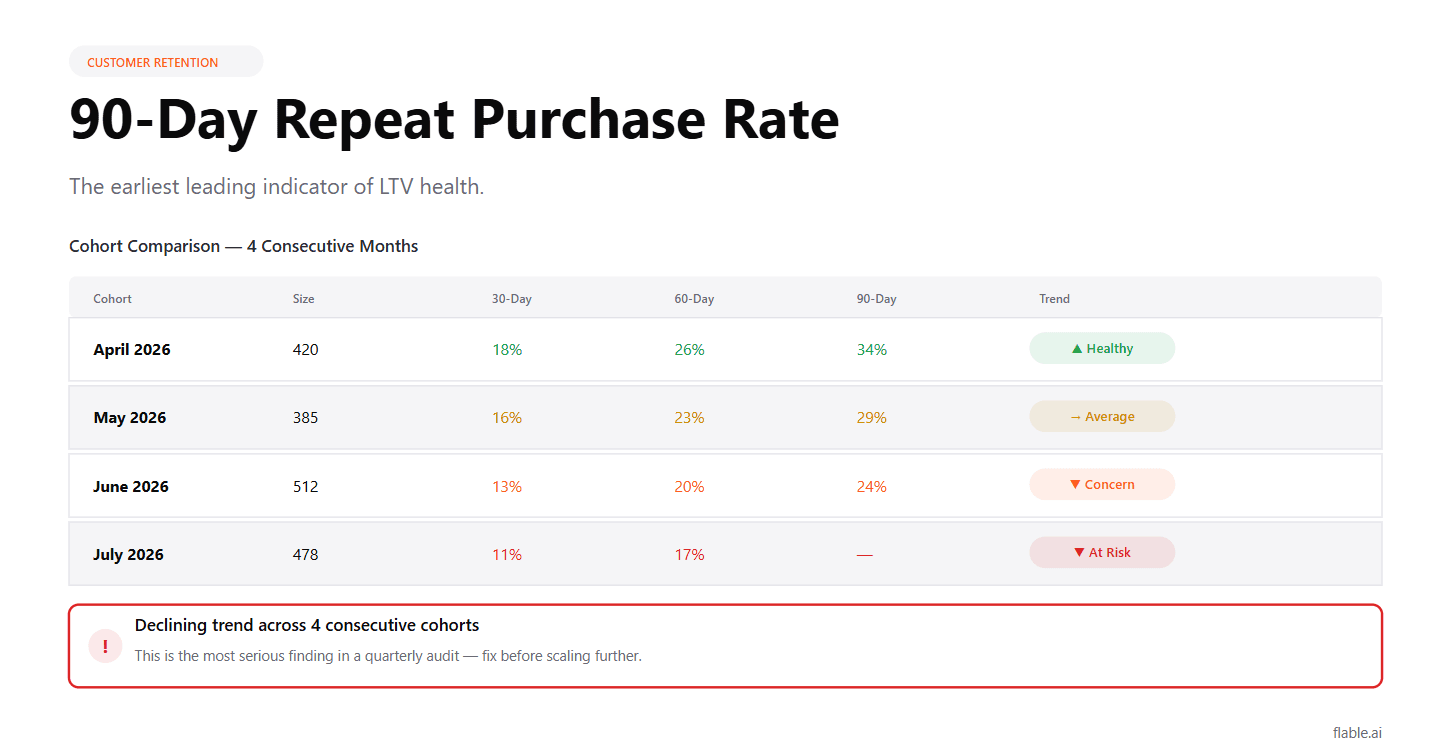
Nothing in standard performance reporting shows that the LTV:CAC ratio is 0.57x.
Because the standard performance reporting doesn’t calculate LTV. It doesn’t calculate true new customer CAC. It doesn’t separate prospecting from retargeting. It doesn’t adjust for returns.
The dashboard is built to show campaign performance. Not business health. And those are different things.
True New Customer CAC
Prospecting spend ÷ return-adjusted new first-time buyers
Calculate monthly. Track the trend. If it’s rising, either your prospecting is becoming less efficient or your new customer return rate is climbing.
Observed 12-Month LTV (Margin-Adjusted)
Pull from Shopify cohort data. Calculate at 3, 6, and 12 months. Use effective margin (gross margin minus shipping, returns, payment fees) not gross margin.
LTV:CAC Ratio and Payback Period
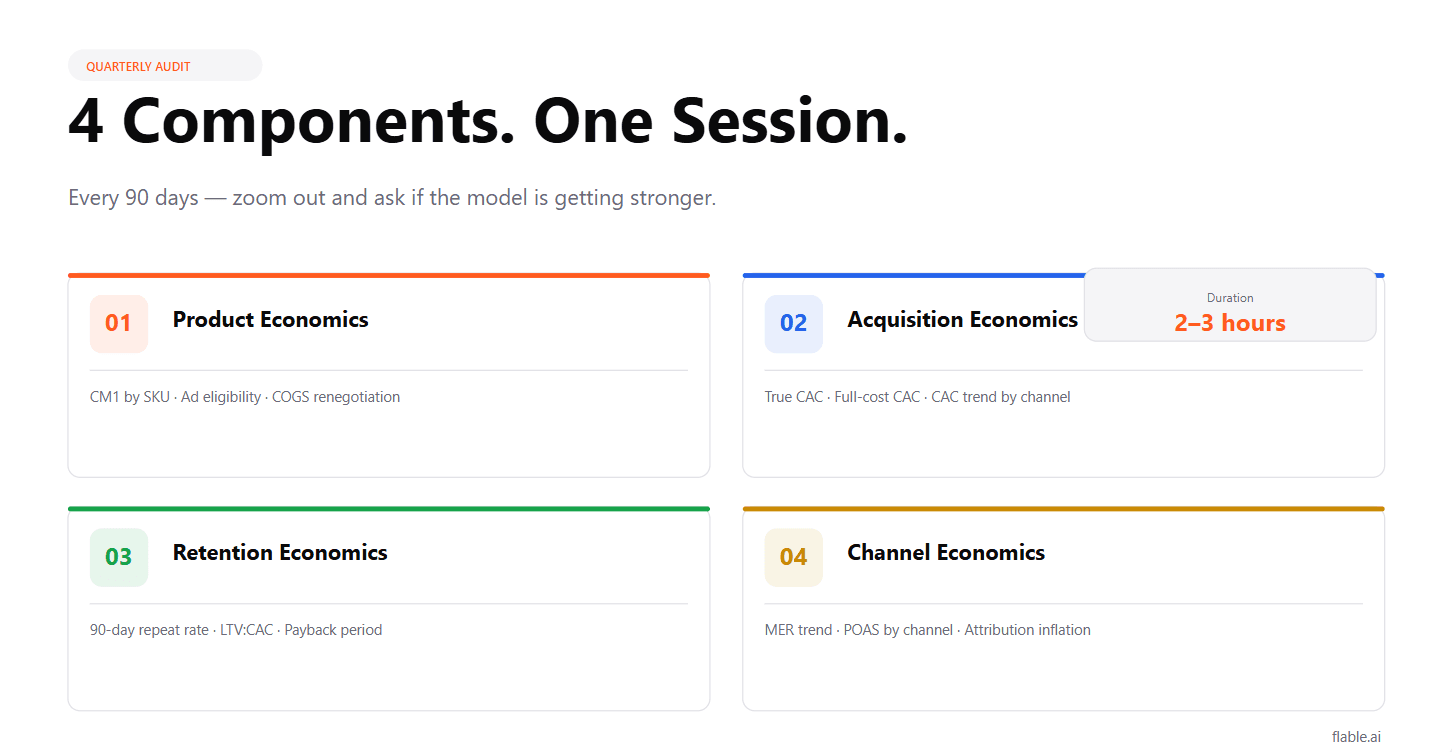
LTV ÷ True New Customer CAC = sustainability ratio (target above 3:1).
True New Customer CAC ÷ Monthly Gross Profit per Customer = payback period (target below 6 months for most D2C categories).
These three numbers together tell you whether the business model works. Nothing else does.
We found the problem. That’s the good news.
We restructured their campaigns, separating prospecting from retargeting, removing high-return campaigns, focusing prospecting spend on the audience segments that were generating the highest 90-day repeat purchase rates.
Over 90 days:
| Metric | Before | After 90 days |
|---|---|---|
| True new customer CAC | ₹1,400 | ₹890 |
| 90-day repeat purchase rate | 12% | 21% |
| 12-month LTV | ₹800 | Tracking toward ₹1,600 (projected) |
| LTV : CAC | 0.57x | Approaching 1.8x |
LTV:CAC ratio went from 0.57x to approaching 1.8x, still below the 3:1 target but no longer structurally loss-making.
Revenue growth slowed slightly. The business became structurally viable.
That’s the trade. And it’s always worth making.
Take your true new customer CAC
Prospecting spend ÷ return-adjusted new buyers.
Take your 12-month observed LTV from cohort data
Not the formula, the actual numbers from 12 months ago.
Divide LTV by CAC.
Above 3
The economics support growth.
Below 2
No amount of campaign optimisation will fix it. Fix the economics first.
Revenue doesn’t lie. But revenue without LTV:CAC context is just an incomplete sentence.
Prospecting spend only ÷ (net new first-time buyers × (1 − return rate)). It excludes returning customers and customers who returned the product. In practice it is typically 50–100% higher than the CPA most brands report.
AOV × Purchase Frequency × Gross Margin × Lifespan usually measures frequency on the full customer base (inflated by loyalists), uses gross margin instead of effective margin (ignoring shipping, returns and payment fees), and estimates lifespan optimistically. In the example the formula said ₹1,800 while cohort data showed ₹800.
Take every customer who made their first purchase exactly 12 months ago and calculate their total gross margin contribution since then: all orders × effective margin %. That is observed, not projected or modelled.
Above 3:1 means healthy unit economics. Between 1:1 and 2:1 you're technically positive but payback may create a working capital problem. Below 1:1 the business model doesn't work at current scale.
Separate prospecting from retargeting, remove high-return campaigns and focus prospecting spend on segments with the highest 90-day repeat purchase rates. In this case true CAC fell from ₹1,400 to ₹890 and 90-day repeat rate rose from 12% to 21% within 90 days.
Flable AI calculates true new customer CAC per channel, return-adjusted and prospecting-only, so you always know what growth really costs.