Unit Economics
Weekly reviews catch campaign problems. Monthly reviews catch business health problems. Quarterly audits catch model problems.
The distinction matters. A model problem isn’t a campaign that’s underperforming or a return rate that’s spiking. It’s a structural issue with how the business generates value, something baked into the unit economics that weekly and monthly reviews are too zoomed-in to see clearly.
The quarterly unit economics audit is the one session every 90 days where you zoom out, look at the full picture, and ask the question that weekly data can’t answer:
Is this business model getting stronger or weaker as it scales?
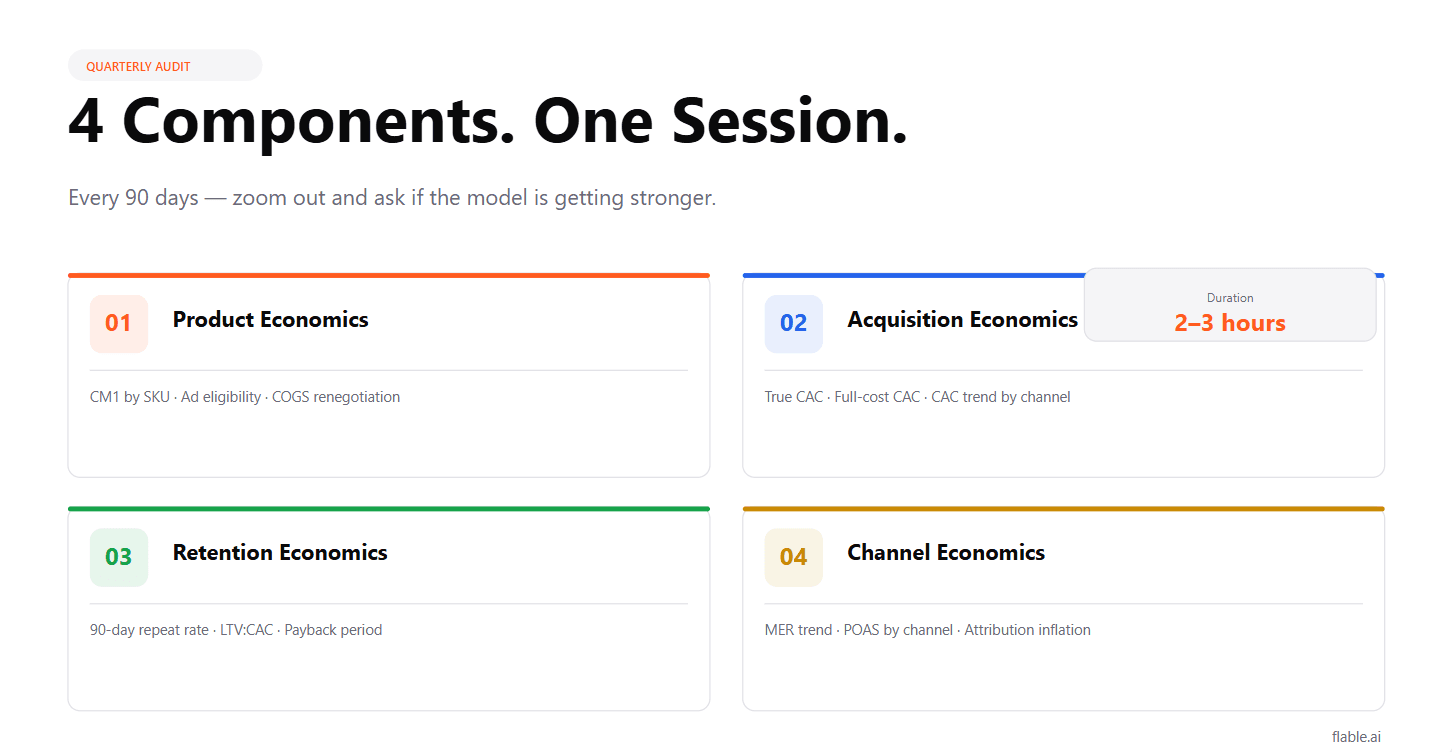
The audit has four components, each building on the previous:
1
Are your margins healthy and improving?
2
Is CAC sustainable relative to LTV?
3
Are the customers you’re acquiring worth what you paid?
4
Which channels are building the business vs consuming it?
Each component requires specific data, specific calculations, and specific decisions. The full audit takes 2–3 hours. The decisions it produces are worth months of weekly optimisation.
Component 1
Data needed
Calculations
CM1 per SKU = Net Selling Price − COGS
Effective Margin per SKU = CM1 % − Shipping % − Returns Cost % − Payment %
Break-Even ROAS per SKU = 1 ÷ Effective Margin %
Are any SKUs below minimum viable CM1 (30% for most categories)?
SKUs below this threshold cannot support profitable paid advertising regardless of campaign efficiency. Decision: fix COGS through manufacturing renegotiation, increase price, or move to organic-only.
Has CM1 changed since the last audit for any key SKU?
Declining CM1 means either rising COGS (manufacturing cost increase, packaging change, input cost inflation) or declining net selling price (increased discount depth). Identify the cause. A 5-point CM1 decline over two quarters is a significant margin compression that compounds quickly at scale.
Which SKUs are you advertising that shouldn’t be?
Cross-reference your active Meta and Google campaigns with your SKU effective margin data. Any campaign featuring a SKU with effective margin below 12% is almost certainly running at negative POAS. Decision: remove from paid campaigns immediately.
Updated SKU advertising eligibility list. Products clearly categorised as: Advertise aggressively / Advertise conservatively / Remove from paid / Bundle only / Organic only.
Component 2
Data needed
Calculations
True New Customer CAC per channel: Prospecting spend ÷ (New first-time buyers × (1 − first-order return rate))
Full-cost New Customer CAC: (Prospecting spend + proportional agency/tool/creative costs) ÷ Return-adjusted new customers
CAC trend: Compare this quarter’s true new customer CAC against last quarter and the quarter before. Is CAC rising, flat, or falling?
Is CAC rising faster than LTV?
If CAC has risen 20% over two quarters and 90-day LTV has grown 8%, the gap is compressing. At some point, the ratio crosses below 2:1 and the model breaks. Catch this trend early.
Which channel has the lowest true new customer CAC?
Not platform CPA, true new customer CAC accounting for return rates. The channel with the lowest true CAC is where the next marginal acquisition budget should go.
What is your full-cost CAC vs your ad-spend-only CAC?
Most brands report ad-spend-only CAC. Full-cost CAC (including agency, tools, creative) is typically 30–50% higher. If full-cost CAC:LTV ratio is below 2.5:1, profitability is under pressure even if the ad-spend-only ratio looks fine.
True new customer CAC by channel for the quarter. CAC trend chart (last 4 quarters). Channel-level acquisition efficiency ranking.
Component 3
Data needed
Calculations
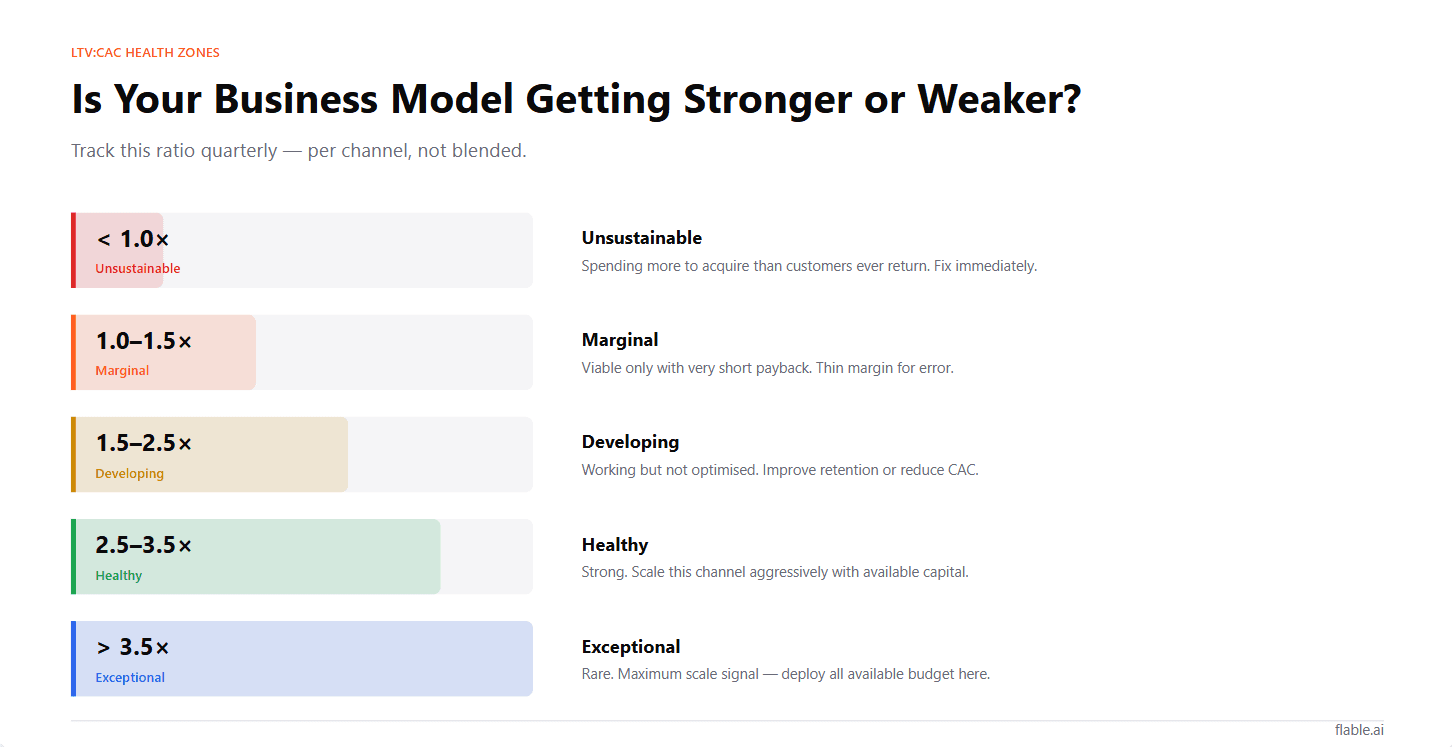
LTV:CAC ratio per channel: 12-month observed LTV (gross margin, not revenue) ÷ True new customer CAC
CAC payback period: True new customer CAC ÷ (Average Monthly Revenue per Customer × Effective Margin %)
Repeat rate trend: 90-day repeat rate across last 4 acquisition cohorts, is it improving, stable, or declining?
Is the LTV:CAC ratio above 3:1 per channel?
Below 2:1 is unsustainable. Between 2:1 and 3:1 is marginal, viable only with a short payback period. Above 3:1 is healthy. Above 5:1 is the signal to scale that channel aggressively.
Is the payback period within acceptable range for your category?
Supplements/food: under 4 months. Beauty: under 6 months. Fashion: under 9 months. Home: under 12 months. If payback is above these ranges, working capital accumulates faster than it returns. Cash flow problem incoming.
Is the 90-day repeat rate trend positive or negative?
A declining trend across 4 consecutive cohorts is the most serious single finding in a quarterly audit. It means customer quality is systematically worsening, and the business model is weakening at its foundation even as revenue appears healthy. (How to track and improve 90-day repeat rate.)
Is subscription rate growing?
Subscription converts passive repurchase into active recurring revenue. A rising subscription rate improves CAC payback period and LTV predictability simultaneously. Track it quarterly.
LTV:CAC ratio per channel (last 4 quarters). Payback period trend. 90-day repeat rate trend chart. Subscription growth rate.
Component 4
Data needed
Calculations
MER trend: Q3 2025 MER vs Q4 2025 vs Q1 2026 vs Q2 2026. Is aggregate marketing efficiency improving, stable, or declining?
POAS per channel comparison: Which channel generates the most gross profit per ad rupee, after COGS and returns? Rank channels by POAS. This is your budget allocation priority list.
Attribution inflation ratio: How much are platforms collectively over-claiming relative to Shopify? Rising ratio means either more channels have been added (creating more overlap) or channels are taking more credit for organic demand (incrementality is declining).
Is MER improving or declining quarter over quarter?
Declining MER with flat or declining LTV is the clearest signal that scaling has made your marketing less efficient. Identify the cause (CPM inflation, customer quality decline, channel mix shift) and address it before the next quarter’s audit.
Which channel has the highest POAS?
This channel gets the next incremental budget rupee. Not the channel with the highest ROAS, the channel with the highest return-adjusted, COGS-adjusted POAS.
Is attribution inflation growing?
Rising inflation ratio means cross-channel overlap is increasing. Individual channel ROAS numbers are becoming less reliable. MER becomes more important as the primary efficiency metric.
Do any channels need an incrementality test this quarter?
Any channel with ROAS significantly above your MER, particularly Google Brand Search or email, is a candidate for an incrementality holdout test. Schedule one this quarter.
MER trend chart. POAS ranking by channel. Attribution inflation ratio. Incrementality test schedule for next quarter.
A good quarterly audit produces exactly three types of decisions:
Structural
Remove low-margin SKUs from paid advertising. Renegotiate COGS on declining-margin products. Implement subscription mechanic for high-repurchase products. Restructure agency relationship based on full-cost CAC reality.
Allocation
Shift budget toward highest-POAS channel. Reduce spend on channel with declining incrementality. Increase investment in retention (email, WhatsApp) relative to acquisition if CAC payback is extending.
Investigation
Run incrementality test on Google Brand Search. Investigate why May cohort’s 90-day repeat rate is below April’s. Build SKU-level margin dashboard. Add CAC payback tracking to monthly dashboard.
Three types. Not fifteen action items. Three meaningful decisions that change the trajectory of the business, not the campaigns.
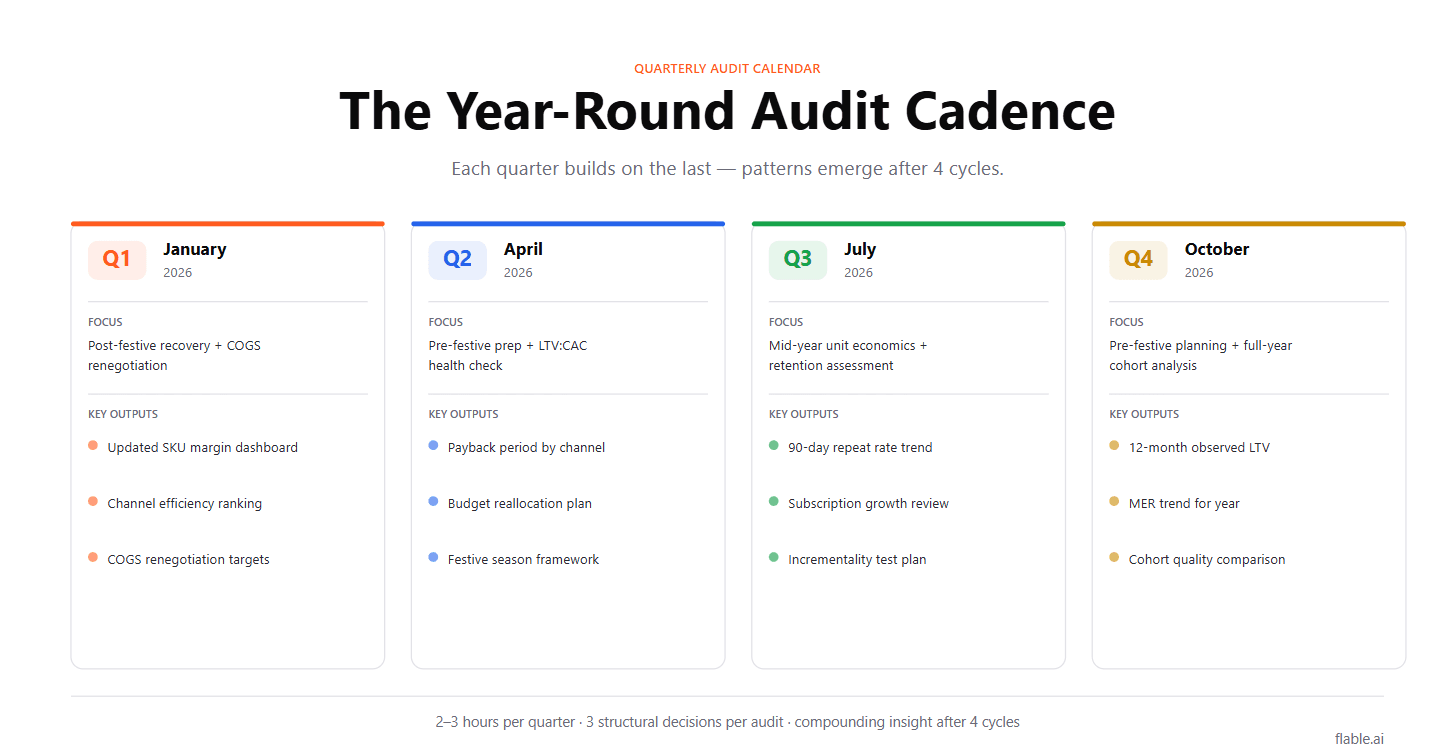
| Quarter | Audit focus | Key output |
|---|---|---|
| Q1 (Jan) | Post-festive recovery + COGS renegotiation readiness | Updated SKU margin dashboard, channel efficiency ranking |
| Q2 (Apr) | Pre-festive preparation + LTV:CAC health check | Payback period by channel, budget reallocation plan |
| Q3 (Jul) | Mid-year unit economics health + retention assessment | 90-day repeat rate trend, subscription growth review |
| Q4 (Oct) | Pre-festive budget planning + full-year cohort analysis | 12-month observed LTV, MER trend for year |
Each audit builds on the previous. By year two, you have four quarters of comparable data, which is when the trends become most actionable.
Weekly reviews. Monthly reviews. Quarterly audits.
Three different time horizons. Three different questions.
The quarterly audit is where you step back from the campaigns and ask whether the business is getting stronger or weaker at its foundation, in margins, in acquisition efficiency, in customer retention, and in channel mix.
The decisions that come out of a quarterly audit are the ones that change trajectory over 6–12 months. They’re harder to identify from weekly data and impossible to act on without the quarterly view.
Build the habit. The compounding is real.
2–3 hours with prepared data. The preparation (pulling COGS data, Shopify cohort exports, channel spend breakdowns) typically takes 30–60 minutes beforehand. The analysis and decision-making session takes 2 hours. Schedule it as a dedicated quarterly session, not embedded in a regular weekly review.
The 90-day repeat purchase rate trend across 4 consecutive cohorts. A declining trend is the most serious structural signal available, it means the business is acquiring weaker customers over time, regardless of what revenue metrics show. Everything else can be optimised. A systematically declining repeat rate requires structural intervention.
Three types: structural decisions that change how the business operates, allocation decisions that change where budget goes, and investigation priorities for the next 90 days. Not fifteen action items.
Flable provides the CM2 and POAS per channel data that forms the backbone of the channel economics component. It also tracks return-adjusted new customer CAC per campaign, the input for the acquisition economics component. With Flable data, the quarterly audit calculation layer is largely automated.
Flable AI provides CM2 and POAS per channel and return-adjusted new customer CAC per campaign, the backbone of a quarterly audit.