Retention Playbook
The pillar blog lists 90-day repeat purchase rate as a key monthly metric under customer quality.
It’s the right metric. Most D2C brands either don’t track it, relying on a blended “repeat customer rate” that measures something different, or track it incorrectly, producing a number that looks healthy and doesn’t reflect the actual customer retention problem underneath.
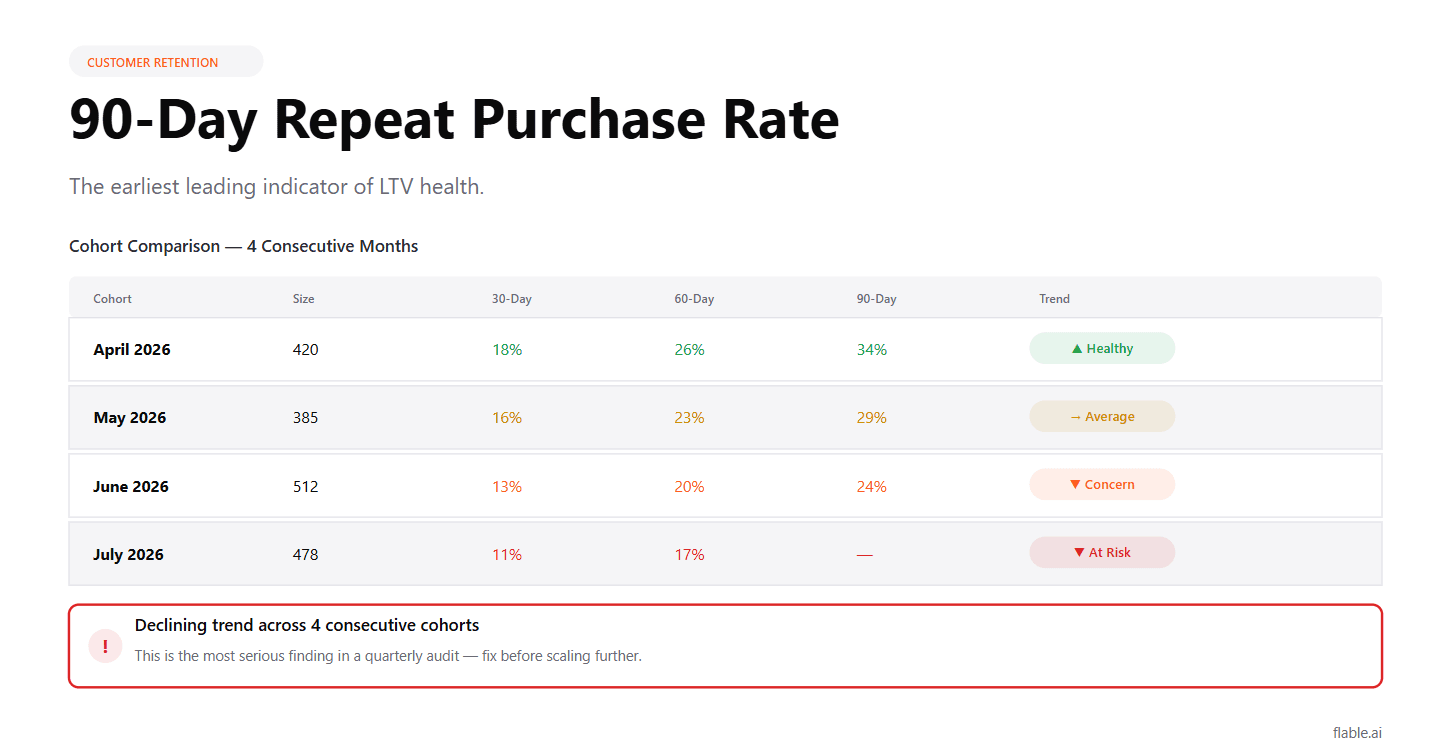
This cluster goes deep: how to calculate 90-day repeat purchase rate correctly, what drives it, what a declining trend is telling you, and the specific tactics that improve it.
Definition: The percentage of new customers acquired in a given month who make a second purchase within 90 days.
Formula
(New customers from Month X who purchased again by Day 90) ÷ (Total new customers from Month X) × 100
Why 90 days specifically
90 days is long enough to capture the natural repurchase window for most D2C consumables (supplements, skincare, food) and short enough to be a leading indicator of LTV, rather than a lagging one. If 90-day repeat rate is healthy, LTV is almost always healthy. If 90-day repeat rate is declining, LTV is declining, and you’ll see it in the cash flow 6–12 months later.
Why NOT “repeat customer rate”
Shopify’s “returning customers” metric shows the percentage of all orders in a period that came from customers with prior purchase history. This blends new and returning customers across different cohorts and time periods, making it impossible to see whether customer quality is improving or declining over time.
Go to Shopify Admin → Customers → export all customers.
Filter to customers whose first order date falls within your target month (e.g., April 2026).
Count total customers in this cohort.
This is your denominator.
Check each customer for a second order dated within 90 days of their first order.
Count customers with a qualifying second order.
This is your numerator.
Divide numerator by denominator × 100.
This is manual and time-consuming for large customer bases. For brands with under 500 new customers/month, it’s workable in a spreadsheet. Above that, Method 2 is more practical.
Method 2
Shopify’s built-in cohort analysis (Analytics → Reports → Customer cohort analysis) shows returning customer rates by cohort month. Filter to “purchased 2+ times” within a 90-day window.
Limitation: Shopify’s cohort report shows revenue retention, not necessarily repeat purchase rate. For precise repeat purchase rate by cohort, a Shopify export or third-party tool (Lifetimely, Retention.com, or Triple Whale) gives cleaner data.
Method 3
Lifetimely and Retention.com are purpose-built for cohort analysis in Shopify. Both calculate repeat purchase rate by cohort automatically, updated in real time as new orders come in.
Cost: ₹2,000–8,000/month depending on order volume. For brands where LTV decisions are driving ₹10L+ in monthly ad spend decisions, the accuracy is worth the cost.
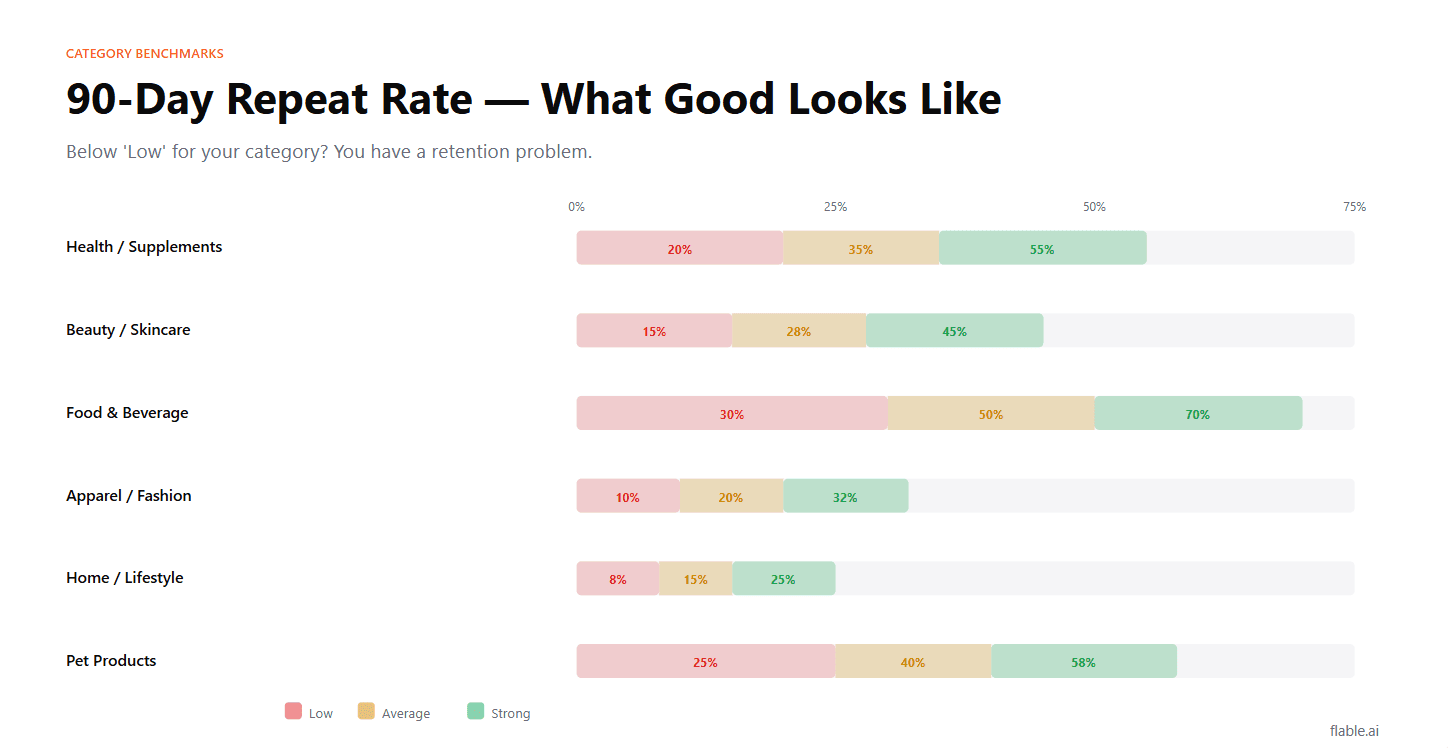
| Category | Low (Concern) | Average | Strong |
|---|---|---|---|
| Health / Supplements | <20% | 20–35% | >35% |
| Beauty / Skincare | <15% | 15–28% | >28% |
| Food & Beverage | <30% | 30–50% | >50% |
| Apparel / Fashion | <10% | 10–20% | >20% |
| Home / Lifestyle | <8% | 8–15% | >15% |
| Pet Products | <25% | 25–40% | >40% |
Fashion has the lowest benchmarks because most purchases are occasion-driven rather than consumption-cycle driven. Food has the highest because consumption is frequent and habit-forming.
If your 90-day repeat rate is consistently below the “Low” benchmark for your category, you have a retention problem. No amount of acquisition spending will compensate if customers don’t come back.
A declining trend, April cohort at 28%, May at 24%, June at 19%, is one of the earliest available signals that something fundamental is changing in your business. The cause is usually one of four things:
Cause 1
The customers you’re acquiring through paid channels are becoming lower quality, less brand-loyal, more discount-driven, less likely to repurchase at full price.
This often happens when scaling pushes prospecting into broader, lower-intent audiences. The algorithm finds conversions in progressively weaker buyer pools. They buy once (especially with a discount) but don’t return.
How to confirm: Compare 90-day repeat rate by acquisition channel. If Meta prospecting cohorts have declining repeat rates while email-acquired cohorts hold steady, the problem is specific to how you’re acquiring customers through paid, not the product itself.
Fix: Tighten prospecting audiences. Reduce discount depth on acquisition campaigns. Use your highest-LTV customers as the seed for lookalike audiences rather than your full customer base.
Cause 2
Customers tried the product, weren’t impressed enough to reorder.
How to confirm: Look at review sentiment over the same period the repeat rate declined. Are newer reviews more negative than older ones? Has a formulation, packaging, or quality change coincided with the decline?
Fix: Customer survey to the non-repeating cohort. “What would make you order from us again?” The answers almost always reveal specific product feedback that review platforms don’t surface clearly.
Cause 3
Customers didn’t receive adequate onboarding, no usage guidance, no check-in, no reason to engage between first purchase and potential second order. The product sat in a drawer. They forgot about it.
How to confirm: Check email open rates and engagement for the non-repeating cohort. Were post-purchase emails sent? Were they opened? If open rates are below 15%, the post-purchase communication isn’t landing.
Fix: Improve the post-purchase email sequence (see the email marketing flows blog in this series). Add WhatsApp communication if not already active. A Day 2 usage guide email and a Day 21 repurchase nudge together typically improve 90-day repeat rate by 8–15%.
Cause 4
Customers tried a competitor during the 90-day window and preferred it. Common in beauty, supplements, and food where competitive new entrants regularly appear with aggressive acquisition offers.
How to confirm: Monitor competitor activity during the period of decline. Did a competitor run a strong acquisition campaign (visible in their Ad Library activity) that coincided with your cohort’s non-repurchase period?
Fix: Strengthen the retention communication sequence to close the competitor consideration window. The first 30 days post-purchase are the highest-risk period, competitors are also running retargeting on customers who visited your site. Win the repeat before the competitor does.
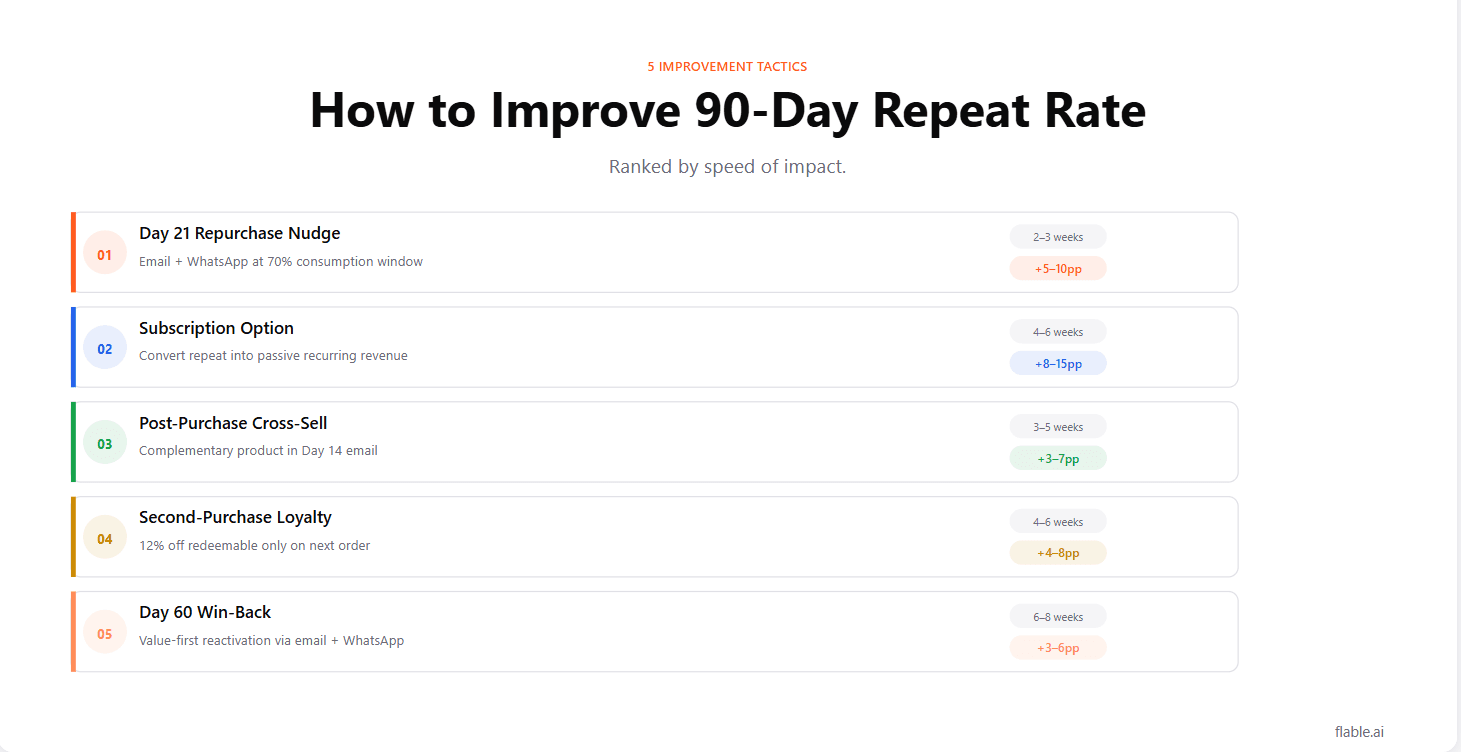
Launch a Day 21 Repurchase Nudge (Email + WhatsApp)
Timed to hit at approximately 70% of the consumption window for your product category. The message: gentle reminder that they might be running low, with a modest reorder incentive.
This single tactic is responsible for the largest repeat rate improvements across D2C brands that implement it consistently. Expected impact: 5–10 percentage point improvement in 90-day repeat rate within 60 days.
Introduce a Subscription Option
Subscription converts repeat purchase from an active decision (customer has to remember to reorder) to a passive one (order arrives automatically). Even a low subscription attach rate (15–20% of buyers) significantly improves 90-day repeat rate for the cohort overall because subscribed customers repurchase at nearly 100% within 90 days.
Cross-Sell in the Post-Purchase Sequence
Introduce a complementary product in the Day 14 email, something that pairs naturally with what they bought. Customers who add a second product to their consideration set have significantly higher 90-day repeat rates because they’re exploring the brand more broadly, not just evaluating a single product.
Build a Loyalty Incentive for the Second Purchase
Offer a specific incentive redeemable only on the second order (not applicable to the first). “Your reward: 12% off your next order, valid for 45 days.”
This creates both urgency (expires) and specificity (next order only), two conditions that drive second purchase conversion without training customers to expect discounts on every order.
Win-Back Campaign at Day 60
For customers who haven’t repurchased by Day 60, proactive win-back via email and WhatsApp. Not a discount first. A value-first message: new product, improved formulation, relevant content. Discount only if the first message doesn’t convert within 7 days.
Track these three numbers every month in your Layer 3 review:
1
This month’s report shows the 90-day outcome for customers acquired 3 months ago. The 3-month lag is unavoidable, you need 90 days of observation.
2
Are recent cohorts improving, holding, or declining? The trend matters more than any single number.
3
Meta prospecting vs Google Shopping vs email vs organic. Which channels acquire customers who return? Which acquire one-time buyers?
90-day repeat purchase rate is the earliest reliable signal of LTV health available to D2C brands.
Track it correctly, by cohort, not blended. Compare it to category benchmarks. Monitor the trend across 6 months. Diagnose what’s driving a decline before it compounds into a cash flow problem.
And implement the five tactics systematically, repurchase nudge, subscription, cross-sell, loyalty incentive, win-back. Each one moves the number measurably within a single cohort cycle.
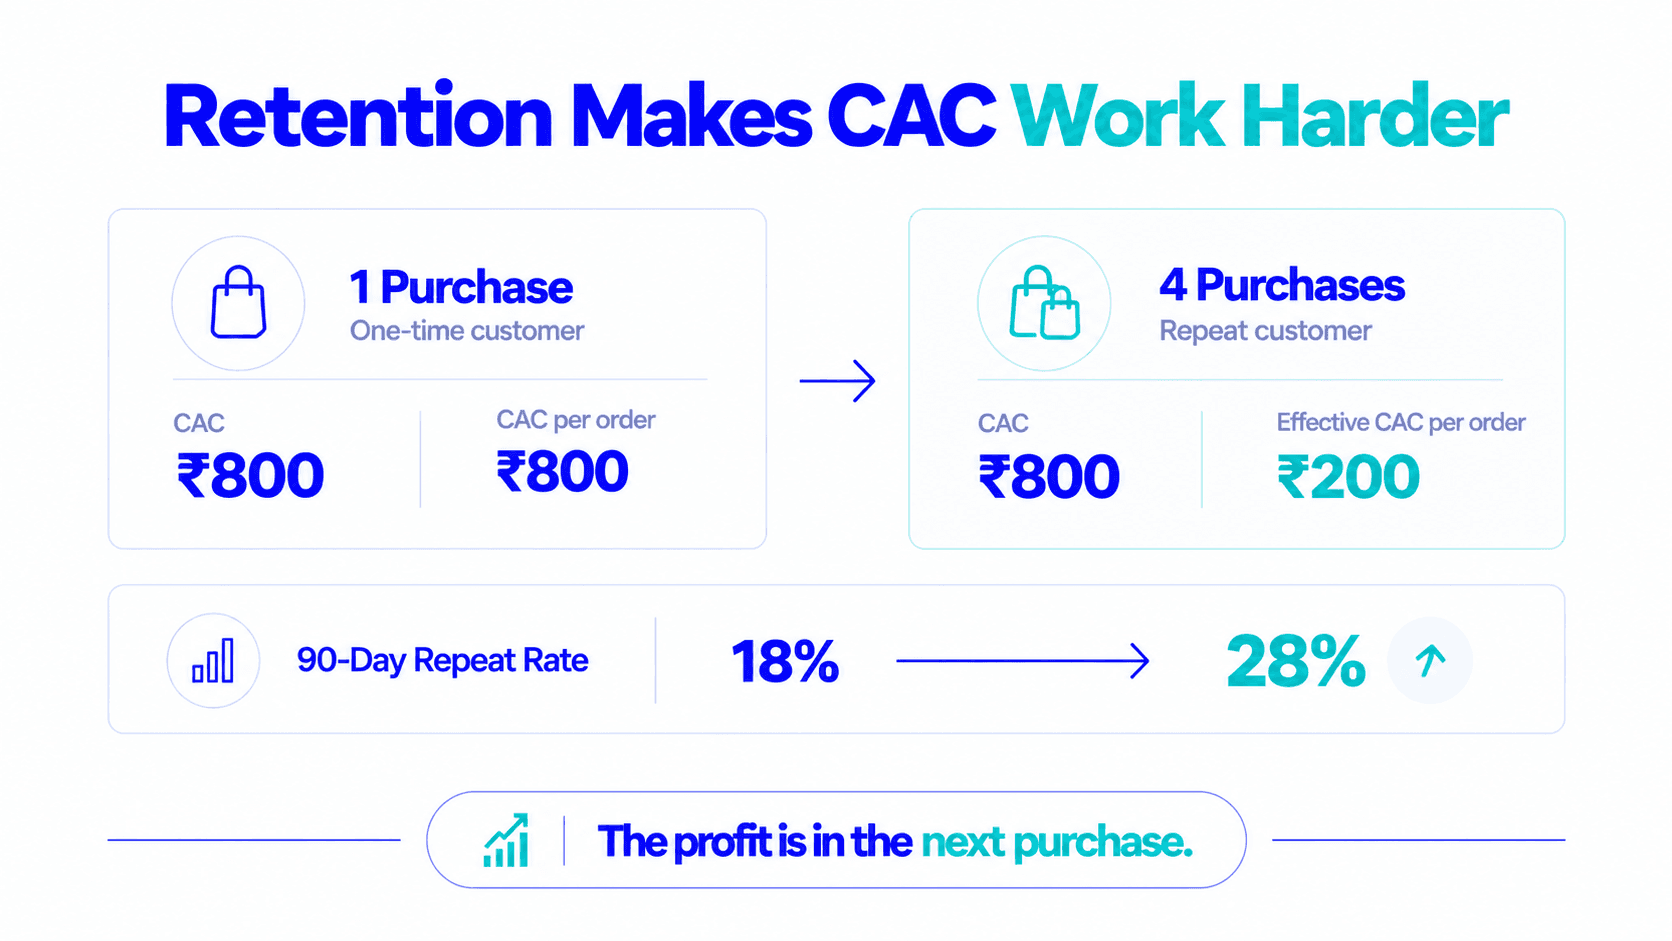
A 10-point improvement in 90-day repeat rate is worth more than a 20% reduction in new customer CAC. Fix retention first.
90-day repeat purchase rate tracks what percentage of a specific new-customer cohort made a second purchase within 90 days, a leading LTV indicator. Returning customer rate (Shopify's default) shows what percentage of all orders in a period came from customers who had previously purchased, a blended metric that mixes different cohorts and doesn't reveal whether recent customer quality is improving or declining.
The fastest single impact: launch a Day 21 repurchase nudge (email + WhatsApp, timed to 70% of your product's consumption window). Most brands see a 5–10 percentage point improvement within one cohort cycle (60–90 days) from this single tactic.
It depends on category. Strong is above 35% for health and supplements, above 28% for beauty and skincare, above 50% for food and beverage, above 20% for apparel, above 15% for home and lifestyle and above 40% for pet products.
Flable shows CM2 and POAS per acquisition channel, so when you see your 90-day repeat rate declining for Meta prospecting cohorts, Flable confirms whether those customers are also less profitable on their first order. Channel-level customer quality is visible in both the acquisition and retention data simultaneously.
Flable AI shows CM2 and POAS per acquisition channel, so declining repeat rates and first-order profitability show up side by side.