Retention Metrics
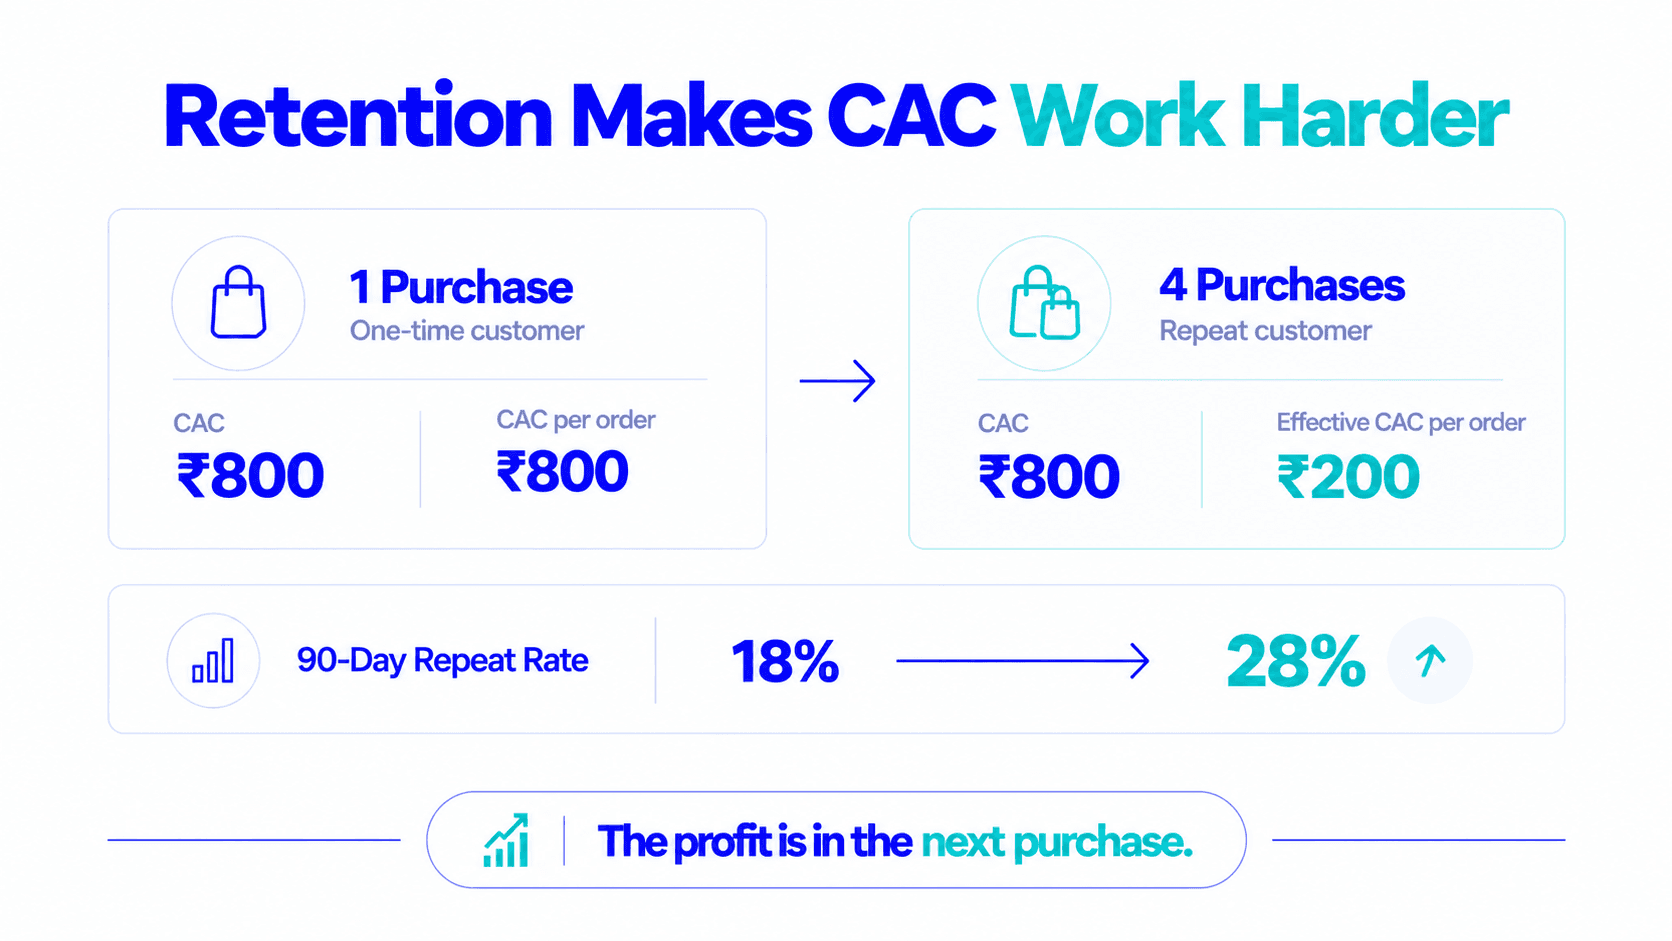
The most expensive part of D2C growth is acquiring a new customer. The opportunity with subscriptions is not to reduce the CAC required to acquire that customer, but to recover that acquisition cost more effectively through repeat purchases.
For D2C brands selling consumable products, such as supplements, beauty, food, personal care, pet products and cleaning products, a subscription model can improve revenue visibility, retention and customer lifetime economics when the underlying contribution margin is healthy.
The key is to build subscriptions around actual consumption behaviour and then measure whether subscribers generate enough incremental contribution to justify the acquisition cost.
A simplified CAC payback calculation
CAC Payback Period = New Customer CAC ÷ Monthly Contribution per Customer
Example
A subscription does not change the ₹900 CAC itself. What it can change is the customer’s purchase frequency and the predictability of the contribution generated after acquisition.
Without a subscription, a customer who purchases 0.4 times per month may generate repeat revenue at irregular intervals. With a subscription, the brand has a scheduled replenishment cycle. However, actual revenue still depends on cancellations, pauses, failed payments, returns and changes in customer behaviour.
This makes cohort-level tracking important: instead of assuming that every subscriber stays for a fixed period, brands should measure cumulative contribution and CAC recovery over time.
Choose your model
Model 1
Customers opt into recurring delivery at a chosen cadence in exchange for a discount. Common starting discounts are often in the 10–15% range, but the right level depends on category, margins, customer behaviour and retention.
Best for: products with natural consumption cycles, such as supplements, skincare, coffee, pet food and cleaning products.
The economics: the discount reduces contribution on each order, so the additional margin from repeat purchases must compensate for that discount and the costs of fulfilment, shipping, returns and subscription management.
Implementation: Shopify offers a first-party Shopify Subscriptions app, while third-party platforms such as Recharge provide additional subscription functionality. Setup effort depends on the store, integrations and subscription requirements.
Model 2
A curated selection of products is delivered at a fixed cadence. Customers receive a bundle rather than choosing every individual item.
Best for: beauty discovery, food sampling, baby products and lifestyle brands with broad catalogues.
The economics: curation can increase perceived value and engagement, but retention depends on product relevance, pricing, fulfilment quality and the customer’s perceived value of each box.
The challenge: curation requires careful inventory planning. Overbuying slow-moving products can increase inventory risk and reduce contribution margins.
Model 3
Customers pay a fixed monthly or annual fee for benefits such as exclusive pricing, priority shipping, early product access or member-only content.
Best for: brands with loyal communities, premium positioning or high purchase frequency.
The economics: membership fees can have attractive margins when the cost of delivering member benefits is low. However, brands should account for discounts, shipping, customer service, technology and other benefit-related costs.
CAC Payback
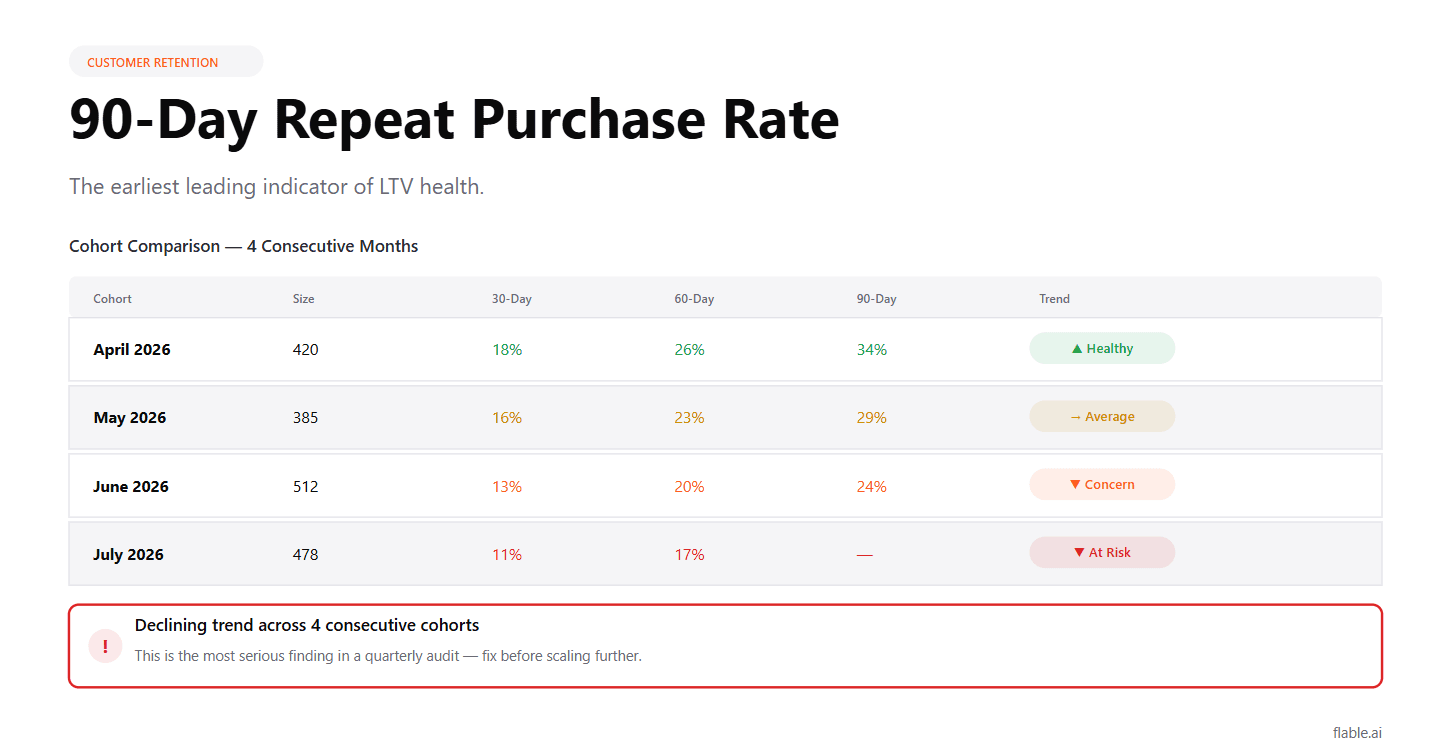
Subscriptions can improve CAC payback when repeat contribution is generated without requiring a comparable amount of new acquisition spend. The effect should be measured using actual subscriber cohorts rather than assumed retention.
Return Rate
Subscription behaviour may correlate with stronger product adoption in some categories, but the impact on returns should be validated using the brand’s own cohort data rather than assumed. Track return and refund rates separately for subscribers and one-time purchasers.
MER
As the subscriber base grows, recurring revenue can increase without a proportional increase in new-customer acquisition spend. This can potentially improve MER, provided retention remains healthy and subscription contribution margins are positive.
LTV
Subscriptions can increase customer lifetime value by increasing purchase frequency and extending the customer relationship.
Subscriber
Non-subscriber
For a fair comparison, a non-subscriber should also be evaluated on contribution rather than revenue alone. The difference between these figures should then be considered alongside acquisition cost, retention and other variable costs.
The important point is that recurring revenue should not automatically be treated as profitable revenue. Contribution margin, retention and fulfilment economics still matter.
The Right First Experience
The first order sets the foundation for a subscription relationship. A strong product experience, clear usage guidance, effective onboarding and useful post-purchase communication can encourage customers to reorder.
Instead of relying on a generic conversion benchmark, brands should measure subscription conversion by first-order cohort and identify which acquisition channels, products and customer segments produce the strongest subscriber behaviour.
Transparent Cancellation
Make cancellation easy to understand and easy to complete. Customers who know they can leave without friction may be more comfortable starting a subscription in the first place.
A transparent cancellation experience can also provide better retention quality: customers who remain are choosing to continue rather than being retained through unnecessary friction.
The Right Cadence Options
Consumption cycles vary by customer. A daily-use face wash may suit a 30-day cycle, while a weekly treatment may suit a longer cycle.
Offer cadence options that match realistic product consumption, such as 30, 45, 60 or 90 days, where operationally practical. Then measure whether each cadence improves retention and reduces skipped or unwanted deliveries.
Pause Over Cancel
A pause or skip option can help customers who have too much product but do not want to leave the brand permanently.
Rather than assuming a universal save rate, measure the percentage of cancellation-intent customers who choose to pause, and track how many of those customers eventually resume.
Start with your products that have the clearest repeat-purchase behaviour. Test a simple subscribe-and-save offer and measure the impact before expanding the programme.
The offer
Product page
Near the Add to Cart section.
Cart page
As a clear subscription option.
Post-purchase
Invite customers to subscribe after they have experienced the product.
Measure subscription conversion, 30/60/90-day retention, contribution per subscriber, cancellation and pause rates, and cumulative contribution against CAC. Use the results to determine whether the subscription offer is actually improving customer economics.
There is no single metric that captures subscription health. Track subscription revenue share alongside the metrics that explain whether that revenue is valuable.
For example, a brand doing ₹3Cr per month with 30% of revenue coming from subscriptions has ₹90L of subscription revenue scheduled based on its active subscriber base. That can provide greater revenue visibility than a business with no recurring revenue, but it is not guaranteed revenue: cancellations, pauses and payment failures can change the realised amount.
The goal is not simply to maximise the percentage of subscription revenue. The goal is to build a subscriber base that generates healthy contribution, retains customers and improves the efficiency of acquisition over time.
Recurring revenue is only valuable when the contribution recurs too.
Consumable categories with natural repurchase cycles are usually the most straightforward candidates: supplements, skincare, food, coffee, pet products and cleaning supplies. Products with predictable depletion rates make it easier to match delivery cadence with actual customer usage.
A 10–15% discount can be a useful starting point, but there is no universal optimal discount. Calculate the maximum discount your contribution margin can support while preserving healthy unit economics and test how the discount affects conversion and retention.
No. A subscription does not change the CAC required to acquire a customer. It can change purchase frequency and the predictability of contribution after acquisition, which is what shortens CAC payback when retention and margins are healthy.
Flable connects campaign performance with D2C profitability metrics such as CM2, POAS and customer economics. For subscription-led brands, the important question is not simply whether a campaign generates revenue, but whether the customers acquired through that campaign generate healthy contribution over time. By analysing acquisition performance alongside downstream customer economics, brands can evaluate which campaigns and customer segments are contributing to profitable growth rather than treating recurring revenue as automatically profitable.
Flable AI connects campaign performance with CM2, POAS and customer economics, so recurring revenue is judged on contribution, not assumed to be profit.