Retention Playbook
Email is the highest-ROI channel in D2C.
Not because it drives the most revenue. Because it drives revenue with almost no variable cost.
Your email list is the only audience you own. No platform can change the algorithm and reduce your reach. No CPM increase can make your existing subscribers more expensive to reach. Once built, it generates revenue at a marginal cost of approximately ₹0.02–0.05 per email sent.
The brands that build email seriously, with proper flows, consistent nurture, and measurement that goes beyond open rates, create a retention engine that compounds independently of paid advertising spend.
Here are the 5 flows that do the most work, and how to measure whether each one is actually contributing to your business.
Flow 1
Trigger
A new subscriber joins your list (without making a purchase yet).
Goal
Convert a subscriber into a first buyer within 7 days.
Email 1 · Immediate
Welcome + what makes you different. Not a product dump, a genuine brand introduction. What do you stand for? Why did you build this? What should they know about you that isn’t on your homepage?
Email 2 · Day 2
Social proof and education. Your bestseller with real customer reviews. Not just star ratings, a story from a customer who had the problem your product solves.
Email 3 · Day 4
The offer. A first-purchase incentive (10% off, free shipping, a sample). Make it time-limited (expires in 48 hours) and genuinely worth acting on.
Email 4 · Day 7
Last chance. Reminder that the offer expires tonight. Short, direct, no fluff.
What good looks like
Welcome series conversion rates of 8–15% (subscribers who purchase within 7 days). Below 5% usually indicates either a weak offer or a subscriber acquisition source that’s misaligned with buyer intent.
What to measure
Revenue per subscriber (welcome series attributed revenue ÷ new subscribers entering the flow).
Flow 2
Trigger
A customer completes their first purchase.
Goal
Reduce returns, build product satisfaction, create conditions for the second purchase.
Email 1 · Immediate
Order confirmation + excitement. Yes, Shopify sends an automatic receipt, this is different. It’s a brand communication, not a transaction. “You’re going to love this. Here’s what to expect.”
Email 2 · Day 2
Usage guide. For beauty products: how to use it, how much to use, when to expect results. For supplements: dosing instructions, what to stack with. For fashion: care instructions, styling suggestions. This email exists to reduce return decisions that form before the product arrives.
Email 3 · Day 5 or delivery day
Check-in. “Your order should have arrived. How are you getting on?” Invitation to reply with questions. Social proof from customers who had the same first-week questions.
Email 4 · Day 14
Review request + second-purchase nudge. “If you’re loving [product] so far, you might want to try [complementary product].” Cross-sell based on what they bought, not a generic catalogue dump.
What good looks like
Post-purchase email sequences reduce return rates by 8–15% on average. Track your return rate for cohorts who received the sequence vs cohorts who didn’t (from before you launched it) to measure the impact.
What to measure
Return rate comparison (sequence vs no sequence), second purchase rate within 30 days.
Flow 3
Trigger
Based on consumption window, sent at 70% of the expected time to depletion.
Goal
Generate the repeat order before the customer runs out (and potentially tries a competitor’s product in the gap).
The timing is everything:
| Product supply | Send nudge on |
|---|---|
| 30-day supplement | Day 21 |
| 45-day skincare product | Day 31 |
| 60-day moisturiser | Day 42 |
Email 1 · At 70% consumption
Gentle nudge. “Your [product] might be running low. Reorder now and get free shipping / 10% off / avoid a gap in your routine.”
Email 2 · At 90% consumption, if no purchase
Urgency. “Running on empty? Order today to avoid a break in your routine.” Short, direct, single CTA.
What good looks like
Repurchase nudge emails generate 15–25% conversion rates for customers who received a good onboarding experience. This is your most efficient revenue, near-zero acquisition cost, strong intent, high CM2 per order (no advertising cost).
What to measure
Revenue per email sent, conversion rate per repurchase nudge, average days between first and second purchase for customers who received the nudge vs those who didn’t.
Flow 4
Trigger
A customer who previously purchased hasn’t ordered again in 60–90 days (vary by your typical repurchase window).
Goal
Reactivate lapsed customers before they’re permanently lost.
Email 1 · Day 60/90
Value-first reactivation. Not a discount, a new reason to engage. “We’ve launched [new product].” Or “We’ve improved [existing product] based on customer feedback.” Give them something new to consider, not just a coupon for the thing they already bought and didn’t repurchase.
Email 2 · Day 67/97, if no purchase
Light incentive. “We miss you. Here’s 10% off your next order, just our way of saying welcome back.” Modest discount, clear expiry.
Email 3 · Day 74/104, if still no purchase
Last attempt. “This is the last time we’ll reach out for a while. If the time isn’t right, we understand. Come back whenever you’re ready.” This email often converts more than email 2 because it removes pressure and creates a sense of finality.
What good looks like
Win-back campaigns typically convert 8–18% of lapsed customers. The exact rate depends heavily on how good the initial product experience was, customers who had excellent onboarding win back at higher rates.
What to measure
Win-back conversion rate, revenue per lapsed customer reached, ROI on any discount offered (CM2 on reactivated orders vs discount depth).
Flow 5
Trigger
A subscribed customer visits a product page or adds to cart without purchasing.
Goal
Convert high-intent visitors who didn’t complete the session.
Email 1 · 4 hours after browse
“Still thinking about [product]?” Show the specific product they viewed. Include 2–3 review highlights. Single CTA: shop now.
Email 1 · 1 hour after abandonment
“You left something behind.” Clean, product-focused, single CTA. No discount yet.
Email 2 · 24 hours, if no purchase
Social proof focus. “Others who bought this said...” Real reviews. Gentle urgency.
Email 3 · 72 hours, if still no purchase
Limited offer. “We’re holding your cart. Here’s 8% off if you complete your order in the next 24 hours.” Use discount as a last resort, not a first response.
What good looks like
Cart abandonment sequences convert 12–22% of abandoned carts. Browse abandonment converts lower (4–8%) but the volume is usually higher.
What to measure
Revenue recovered per 100 abandonment events, discount redemption rate (if you’re offering discounts in the sequence), CM2 per recovered order.
| Metric | How to treat it |
|---|---|
| Open rate | Directional only. iOS privacy changes made open rates unreliable, a significant portion of “opens” are server-side pre-fetches, not genuine human reads. |
| Click rate | Meaningful. Customers who click are engaging with the content. |
| Conversion rate | The metric that matters most. Email revenue ÷ emails sent × average order value. |
| Revenue per email sent | The cleanest measure of email flow performance. If your cart abandonment flow generates ₹18 per email sent, you know exactly what scaling your list or improving the flow is worth. |
| CM2 per email-attributed order | Does the email channel acquire profitable customers? If your email sequences use discounts heavily, CM2 per email order may be lower than paid acquisition orders. Measure it. |
Email is not a broadcast channel.
Five flows, welcome, post-purchase, repurchase nudge, win-back, abandonment, each targeting a specific customer behaviour at the right moment.
Build them once. Measure them consistently. Optimise quarterly.
The brands with the strongest email performance are the ones who’ve built the flows and let them run, compounding revenue from customers they’ve already paid to acquire, at a cost per email of ₹0.03.
No CPM increase can touch that economics. No algorithm change can affect it. That’s why email is the most valuable thing you own.
Klaviyo is the most powerful email platform for D2C, with deep Shopify integration, strong segmentation, and built-in flow triggers based on Shopify events. Alternatives: Omnisend (simpler, lower cost), Mailchimp (basic), or Brevo (good for Klaviyo-level features at lower price points).
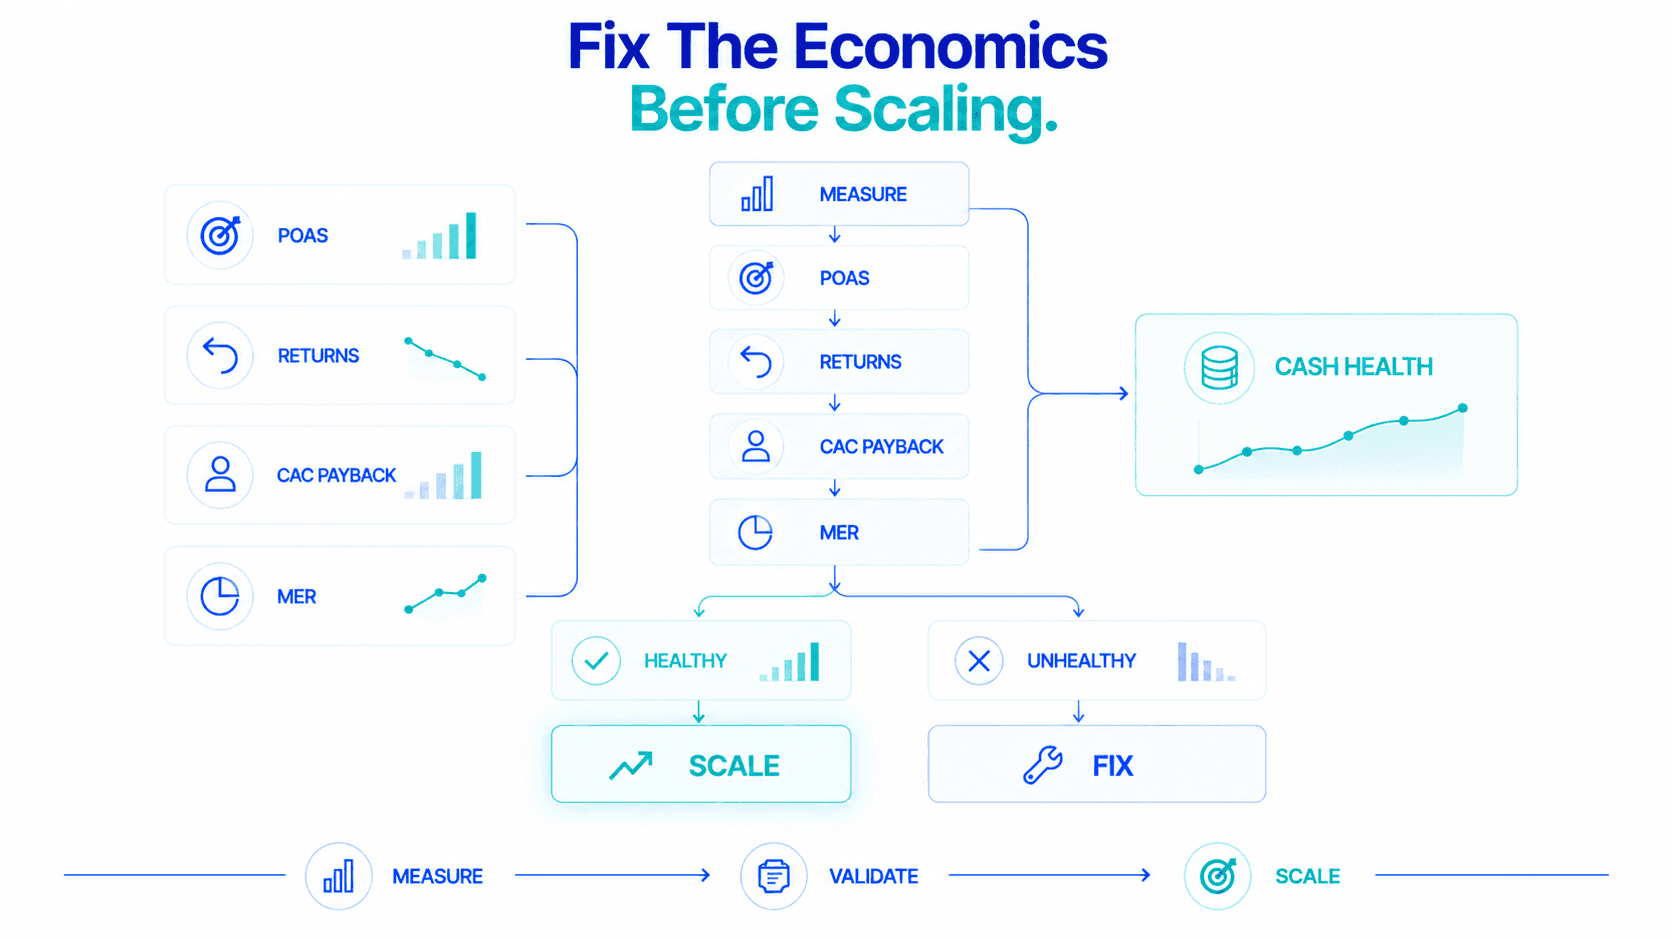
Email generates revenue with near-zero variable cost per send, making CM2 on email-driven orders significantly higher than paid acquisition orders. Measuring email revenue contribution as part of MER (total revenue ÷ total marketing spend, including email platform cost) shows email's true efficiency relative to paid channels.
Only directionally. iOS privacy changes made open rates unreliable because a significant portion of opens are server-side pre-fetches, not genuine human reads. Click rate, conversion rate, revenue per email sent and CM2 per email-attributed order are the metrics to manage.
Flable tracks CM2 per channel, including email when UTM parameters are used. This shows whether email-driven orders are more or less profitable than paid acquisition orders, and whether email flows are improving overall MER by generating revenue without proportional spend.
Flable AI tracks CM2 per channel, including email, so you can see whether your flows lift MER by earning revenue without proportional spend.