Market Research
The pillar blog lists “Gross Margin % by product tier” as a key monthly metric.
Most D2C brands track gross margin at the brand level, one blended number covering everything they sell. It looks clean in the monthly review. It hides everything that matters.
A fashion brand with 10 SKUs might have 3 products at 68% gross margin and 7 products at 22% gross margin. Blended, that’s roughly 35%. The number goes into the monthly report. Everyone nods.
68%
Gross margin
22%
Gross margin
~35%
What the report shows
But the ad campaigns are scaling the 22% margin products (they have better click-through rates and lower apparent CPA). The 68% margin products are getting proportionally less budget. And nobody knows, because the blended number doesn’t show you which SKUs are dragging the average down.
A SKU-level gross margin dashboard fixes this. Here’s how to build it.
Blended gross margin is useful for one thing: financial reporting. It tells you how the business performed in aggregate.
It is useless for two things:
1
Knowing your blended margin doesn’t tell you which products can support paid acquisition and which ones can’t. A product with 20% gross margin that’s absorbing ₹100 in shipping and ₹30 in payment fees has approximately 5% available for ad spend. A product with 65% gross margin has approximately 40% available.
2
Blended margin masks which products are pulling your average down. Without SKU-level visibility, there’s no pressure to fix low-margin products and no data to identify which ones they are.
A SKU-level dashboard surfaces both.
Procurement records (per SKU)
Shopify store (per SKU)
Calculated fields
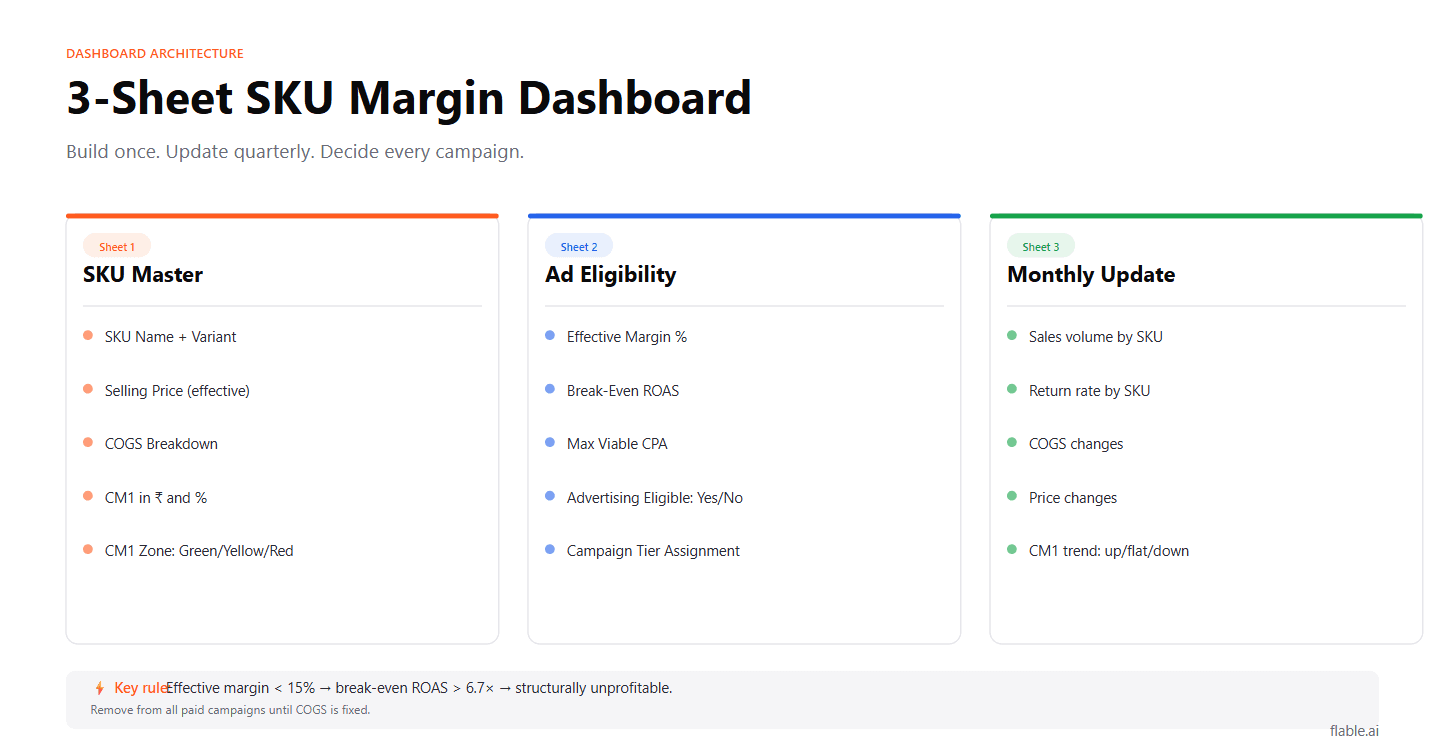
Google Sheet or Airtable · one row per active SKU
| Column | Data |
|---|---|
| SKU Name | Product name + variant |
| Category | Fashion / Beauty / Supplements / etc. |
| Selling Price | Current listed price |
| Avg Effective Price | After typical discount rate |
| Manufacturing Cost | Per unit at current MOQ |
| Packaging Cost | Per unit |
| QC/Compliance | Per unit (annualised) |
| Inbound Freight | Per unit (last shipment) |
| Total COGS | Sum of above |
| CM1 (₹) | Effective Price − Total COGS |
| CM1 (%) | CM1 ÷ Effective Price |
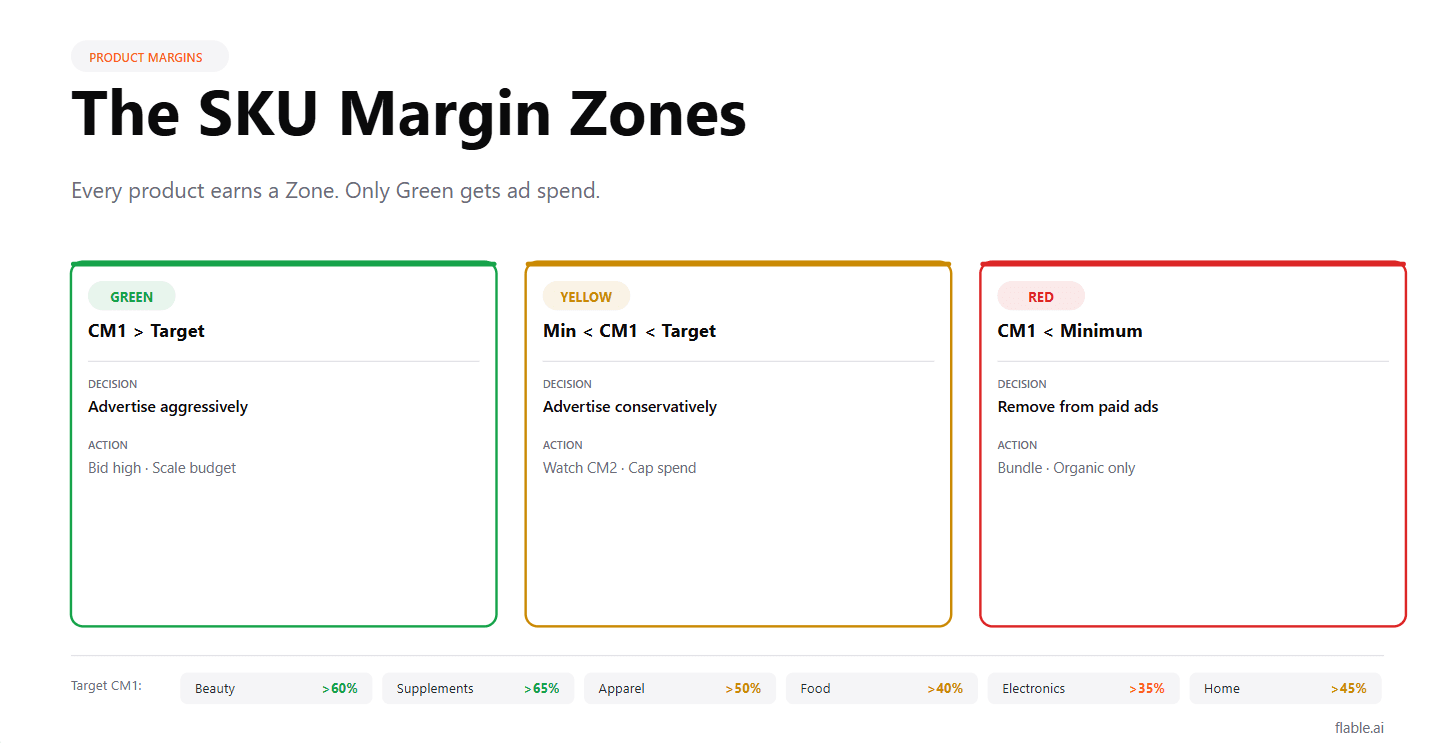
| CM1 Zone | Green/Yellow/Red (formula-based) |
CM1 Zone formula:
Green
Beauty >55%, Fashion >45%, Supplements >60%.
Yellow
CM1 % between minimum viable and target.
Red
CM1 % below minimum viable.
This single table, kept updated quarterly, gives you an instant view of which SKUs have the margin to support advertising and which ones don’t.
Cross-reference CM1 data with advertising costs to determine which SKUs should be in paid campaigns.
| Column | Data |
|---|---|
| SKU Name | From Sheet 1 |
| CM1 % | From Sheet 1 |
| Shipping % of price | Average shipping cost ÷ selling price |
| Return cost % | (Return rate × return processing cost) ÷ selling price |
| Payment fee % | 2.5% typically |
| Effective Margin | CM1 % − Shipping % − Return cost % − Payment % |
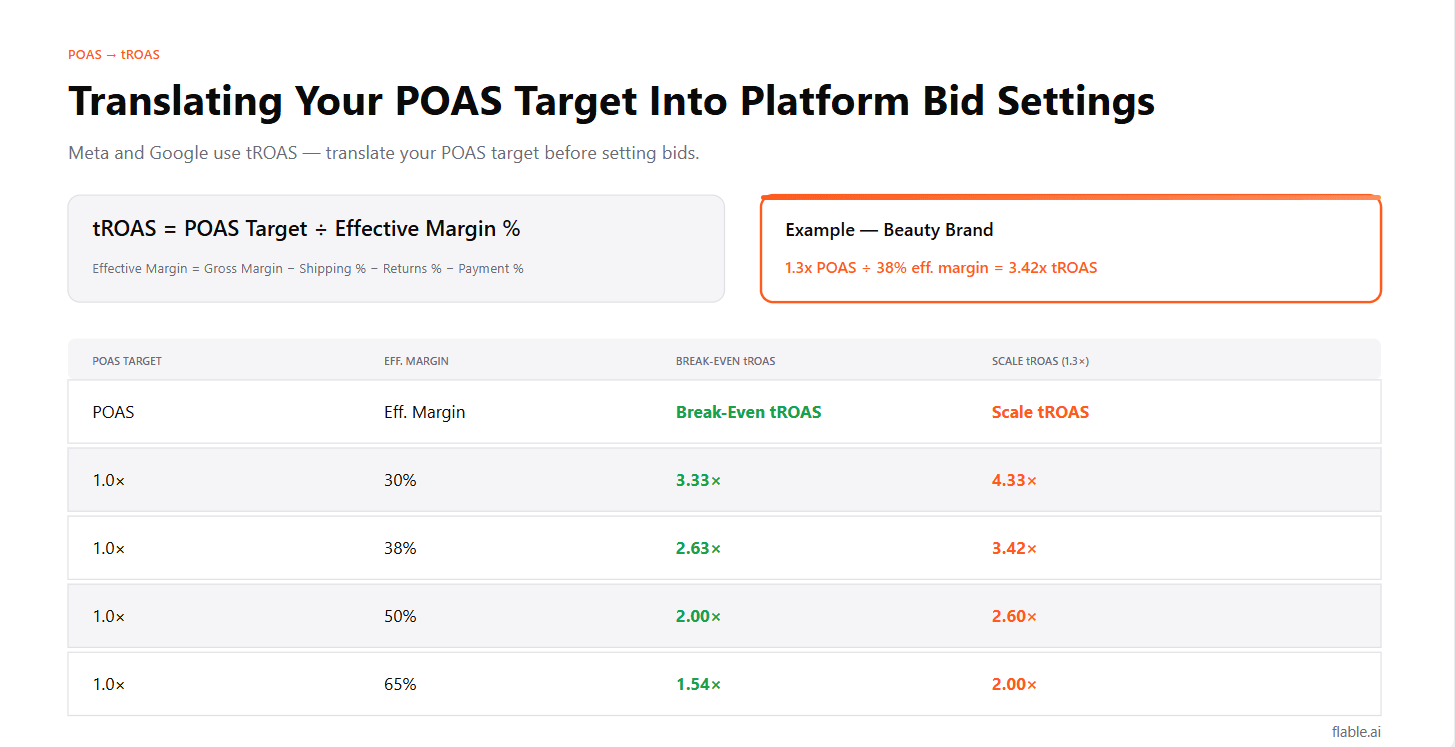
| Break-Even ROAS | 1 ÷ Effective Margin |
| Advertising Eligible? | Yes if Effective Margin > 15%, No if below |
| Max Viable CPA | (Effective Margin × Selling Price) − desired profit per order |
The “Advertising Eligible?” column is the most important output. Any SKU where effective margin is below 15% cannot support paid advertising at any realistic ROAS. Remove it from ad campaigns. Let it sell through organic, bundling, or cross-sell.
Update this monthly with:
Track the trend: is CM1 improving, holding, or declining for each SKU? A SKU with declining CM1 over 3 months is either facing COGS inflation (time to renegotiate with manufacturer) or selling at increasingly deeper discounts (pricing strategy problem).
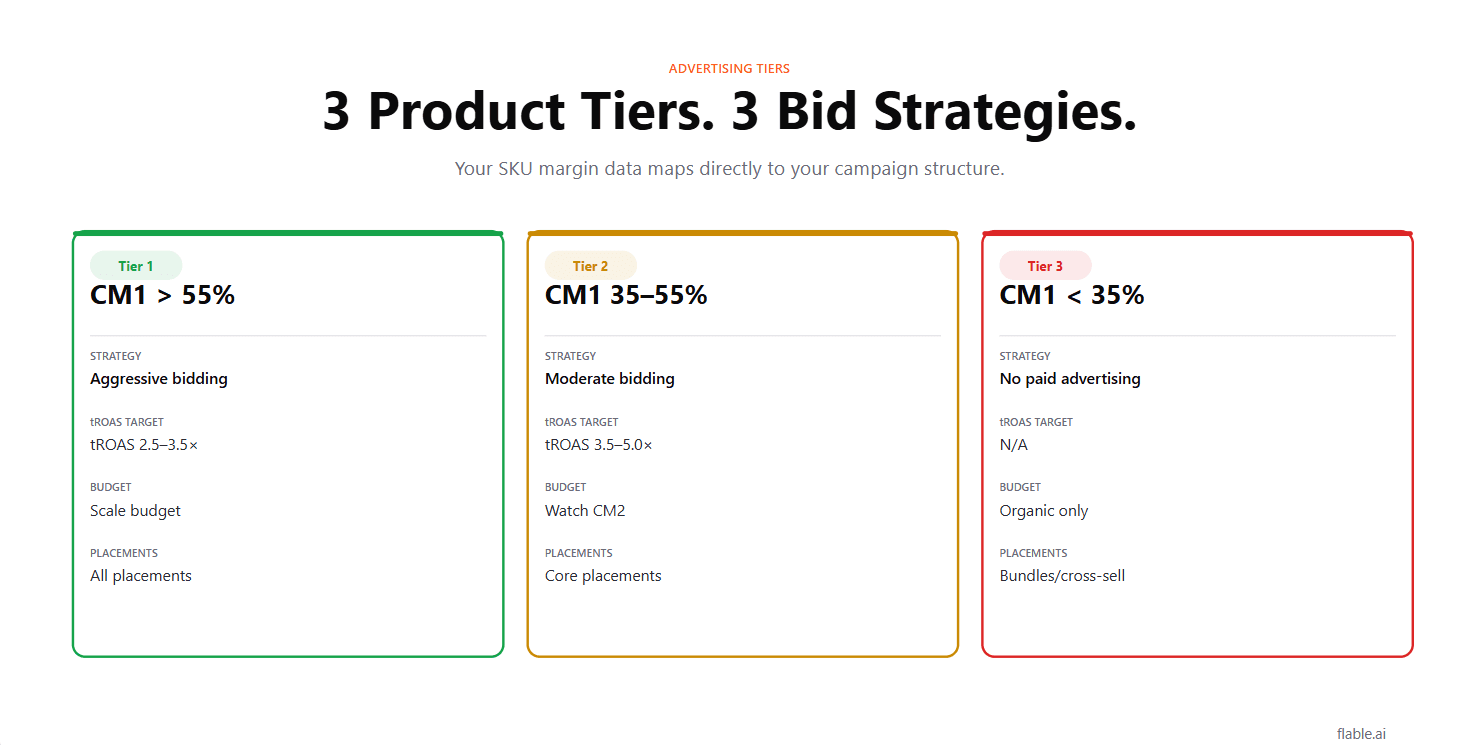
Separate your product catalogue into three advertising tiers:
Tier 1 · CM1 >55%
Aggressive bidding. These SKUs can absorb high ad spend and still generate positive POAS. Scale budget on campaigns featuring these products.
Tier 2 · CM1 35–55%
Moderate bidding. Monitor CM2 closely. Return rate matters most here, a 20% return rate on a 40% margin SKU can push CM2 below break-even.
Tier 3 · CM1 <35%
Defensive or no paid advertising. Use in bundles, cross-sell flows, and organic channels. Do not run standalone paid campaigns.
In Meta, create separate ad sets for each tier with different tROAS targets. Tier 1 can support a lower tROAS (3x) while Tier 3 would need an unachievable tROAS (7x+) to be profitable, which is the signal to remove it from campaigns.
In Google Shopping, use bid modifiers or campaign segmentation to apply different bids to each product tier. High-margin products get higher bids (more competitive placement), low-margin products get floor bids or campaign exclusions.
Your ad creative naturally gravitates toward products that “look good”, photogenic, popular, topical. But the right products to feature are the ones with the strongest CM1.
Before briefing any creative, check: what is the CM1 on the hero product in this ad? If it’s below 35%, brief an alternate product.
The best-looking ad featuring a 20% margin product will always be less profitable than an average ad featuring a 65% margin product, assuming comparable conversion rates.
When planning promotions, the SKU-level margin dashboard immediately shows which products can absorb a discount and which can’t.
| Product | CM1 before | After 20% discount | Verdict |
|---|---|---|---|
| High-margin SKU | 65% | 45% | Plenty of margin for shipping, returns, and ad spend |
| Low-margin SKU | 30% | 10% | Not enough for shipping (typically 8–16% of revenue), returns, and ad spend |
The promotional eligibility is visible at a glance: products in Green Zone → eligible for discounting. Products in Red Zone → never discount, period.
One of the most practical outputs of maintaining a SKU-level margin dashboard: knowing exactly when to renegotiate with your manufacturer.
Any SKU where CM1 % has fallen below its Category Minimum for two consecutive quarters triggers a COGS renegotiation conversation.
Manufacturers typically offer better rates at higher MOQs. Your margin dashboard, showing SKU-level volume trends alongside CM1 trends, tells you exactly which products are generating enough volume to justify a MOQ increase, and which are stuck at high COGS because volume hasn’t scaled enough to unlock better pricing.
Without the dashboard, COGS renegotiation is a periodic activity driven by gut feel. With it, it’s a systematic process driven by margin data.
Blended gross margin tells you how the business did. SKU-level gross margin tells you which products are making it work and which are undermining it.
Build the dashboard. Categorise every SKU by margin zone. Remove Red Zone products from paid campaigns. Focus creative and budget on Green Zone products. Update quarterly.
The shift from blended to SKU-level margin visibility often reveals that 30–40% of a brand’s paid advertising budget is supporting products that can never generate positive POAS at any realistic campaign efficiency.
That budget, redirected to high-margin SKUs, is the highest-ROI marketing decision most D2C brands never make, because they never had the data to make it.
Quarterly at minimum. COGS changes with manufacturing run sizes and supplier negotiations. Update immediately when a major cost change occurs (new packaging supplier, revised manufacturing rate, significant shipping cost change) and always before setting promotional pricing.
Generally above 40% for most categories, given that shipping (8–16% of revenue), returns (5–15%), payment fees (2.5%), and ad spend all need to fit within the margin. Below 30% CM1, profitable paid advertising is structurally very difficult in most D2C categories.
Any SKU whose effective margin (CM1 % minus shipping, return cost and payment fee percentages) is below 15%. It cannot support paid advertising at any realistic ROAS, so sell it through organic channels, bundles and cross-sell flows instead.
When you input COGS by product category into Flable, it calculates CM2 and POAS per campaign with product-level margin accuracy, rather than applying a blended margin rate. This makes campaign profitability assessments significantly more precise, especially for brands with diverse product catalogues.
Flable AI calculates CM2 and POAS per campaign using your COGS by product category, not one blended margin rate.