Pricing Strategy
Most guides explaining “how ecommerce works” describe the general mechanics: customer visits website, adds product to cart, completes checkout, receives delivery.
This guide is for D2C founders and operators who need to understand not just how the transaction works, but how the business model works.
The full unit economics from customer acquisition to contribution margin. The metrics that determine whether a D2C brand is building something durable or just generating revenue that doesn’t sustain itself.
Direct-to-consumer (D2C) ecommerce is a retail model where a brand sells directly to end customers through its own digital channels, primarily its own website, without intermediaries like distributors, wholesalers, or retail chains.
This distinction matters enormously for economics.
Traditional retail
A brand manufactures a product, sells it to a distributor at 40–60% below retail price, and the distributor handles reaching the customer. The brand gives up margin but avoids acquisition costs.
D2C
The brand keeps the retail margin, but owns the customer acquisition cost. Every customer who buys must first be found and convinced to buy, typically through paid advertising on Meta or Google, organic content, or influencer partnerships.
D2C economics only work when the margin kept by cutting out intermediaries exceeds the customer acquisition costs required to replace them.
Five stages
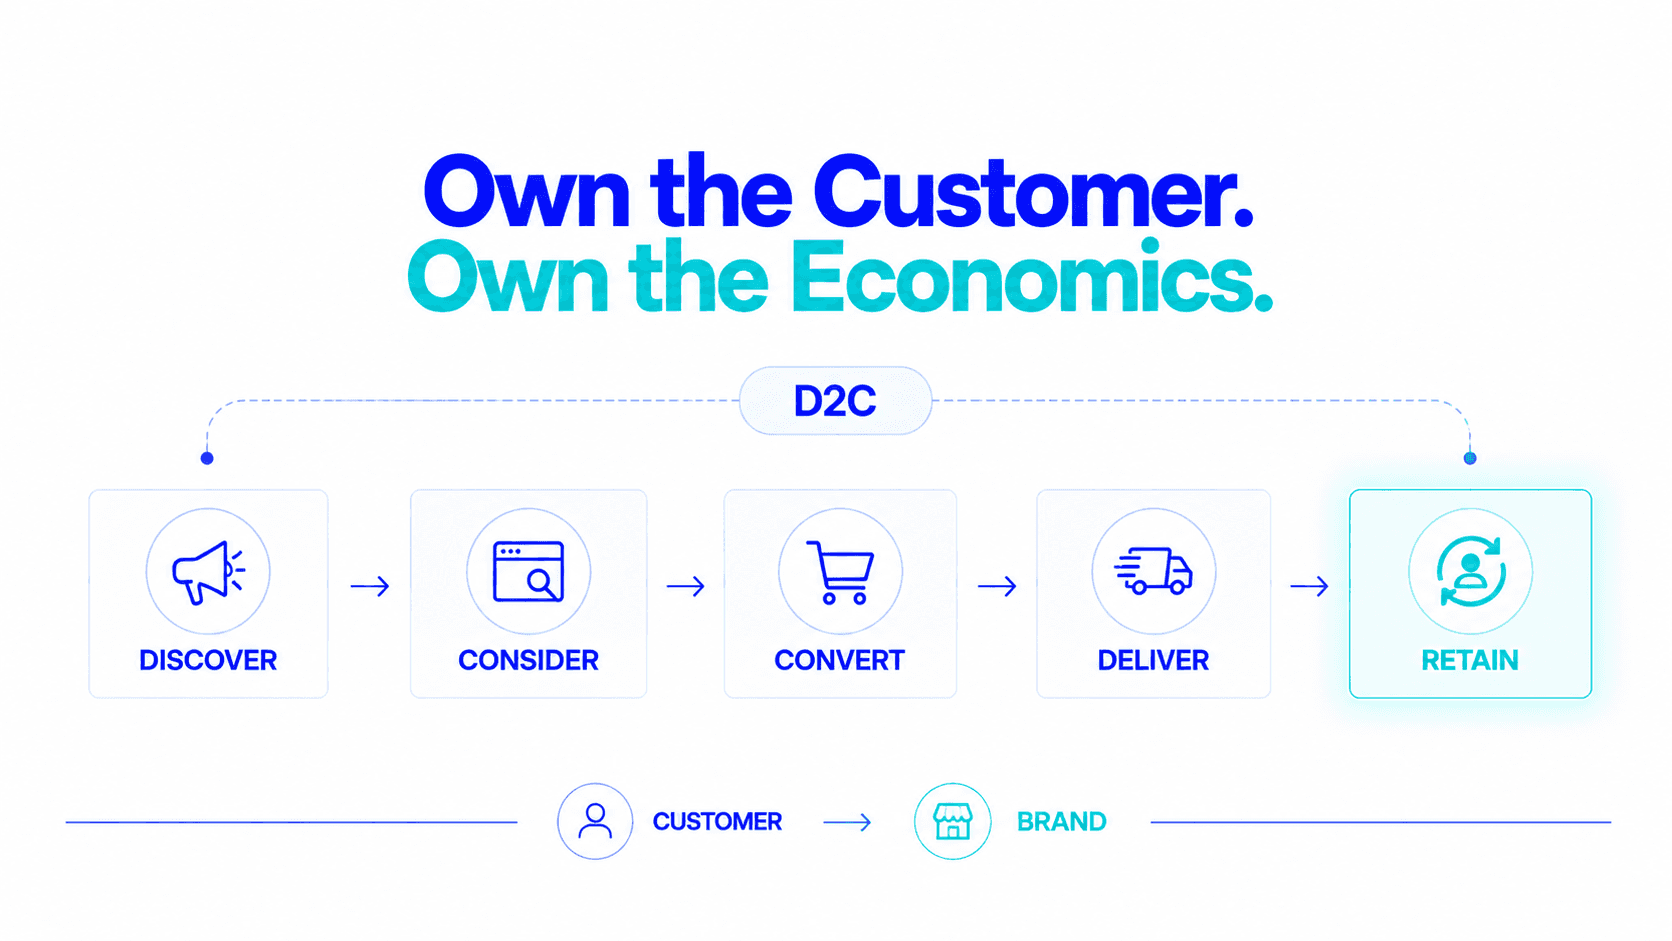
The customer journey in D2C ecommerce has five stages, each with specific drop-off points and economics:
Discovery
The customer sees your brand for the first time. For most D2C brands, this happens through:
Each discovery channel has a different cost. Paid channels have a direct cost per click or cost per thousand impressions. Organic channels have an indirect cost (time, content production) but no direct media spend.
Metric: Cost per Thousand Impressions (CPM) for paid, organic traffic for content.
Consideration
The customer visits your website, views product pages, potentially adds to cart. This is the research and evaluation phase, comparing your product against competitors, reading reviews, checking prices, evaluating whether the value proposition justifies the purchase.
Metric: Session-to-Add-to-Cart rate and Landing Page CVR.
Conversion
The customer completes checkout. For Indian D2C brands, this includes choosing between prepaid and COD (Cash on Delivery) payment.
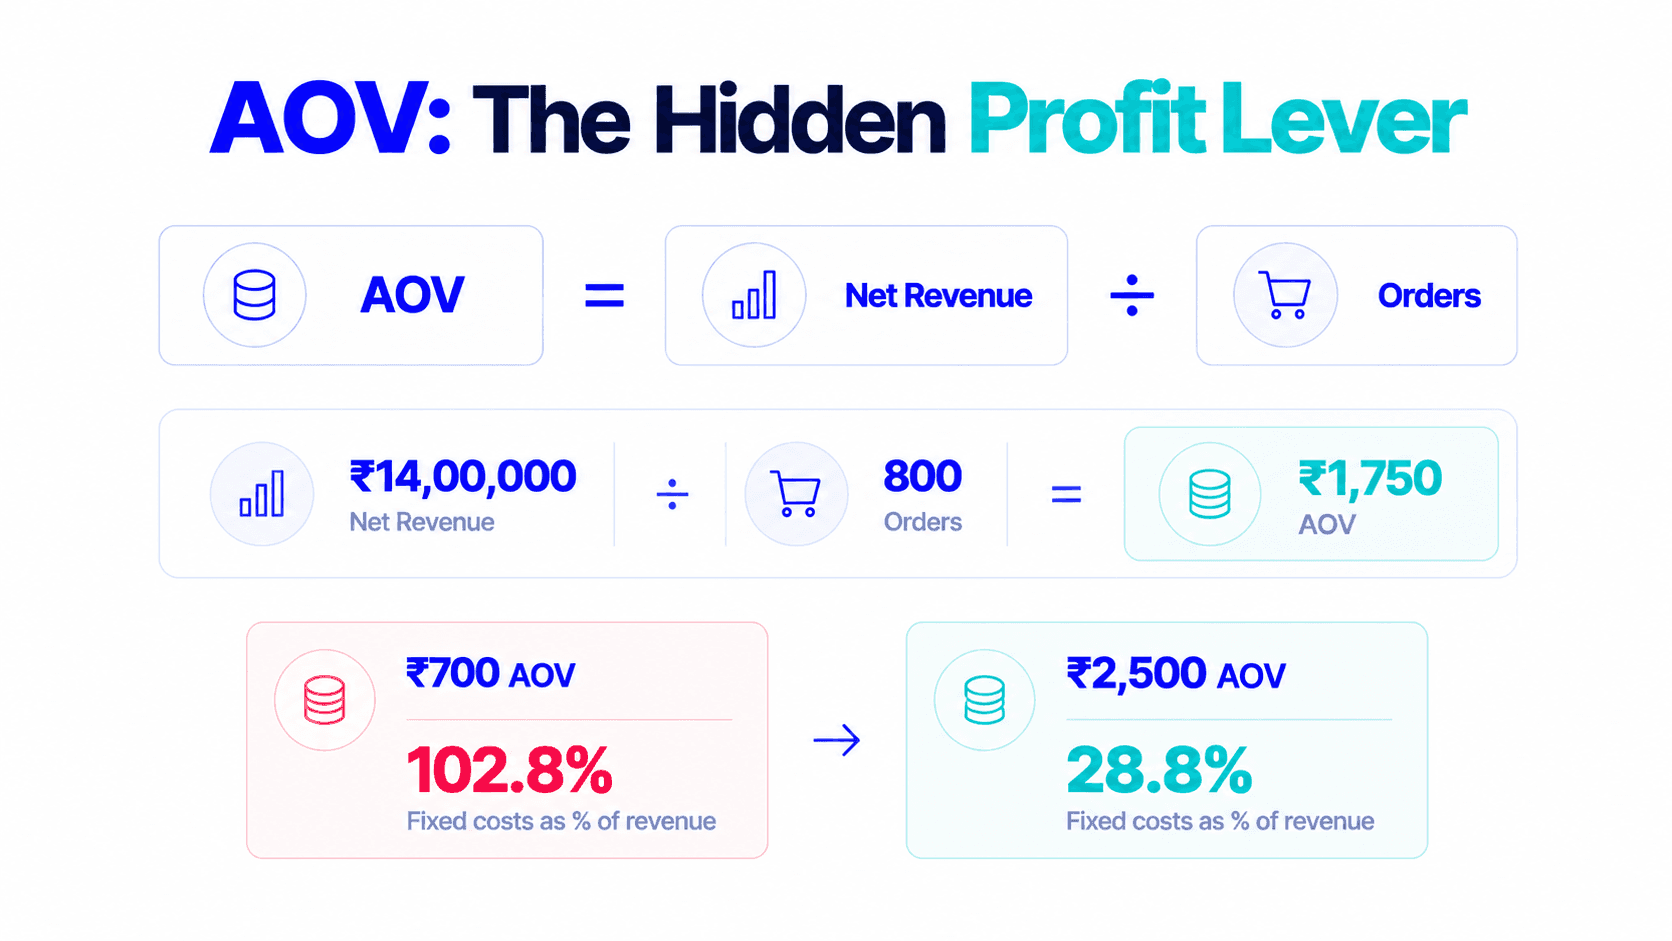
Metrics: Conversion Rate (CVR), CPA (Cost Per Acquisition), Average Order Value (AOV).
Fulfilment
The order is packed, shipped, and delivered. For D2C brands, this stage involves:
The economics: Shipping cost per order, RTO (Return to Origin) rate for COD orders, Order accuracy rate.
Retention
The customer either repurchases or doesn’t. For D2C economics to work, a meaningful percentage of customers must buy more than once. The acquisition cost is absorbed across all orders from that customer, a single purchase rarely produces profitable unit economics at realistic CPA levels.
Metrics: 90-day repeat purchase rate, LTV (Lifetime Value), Subscription rate.
Five levels
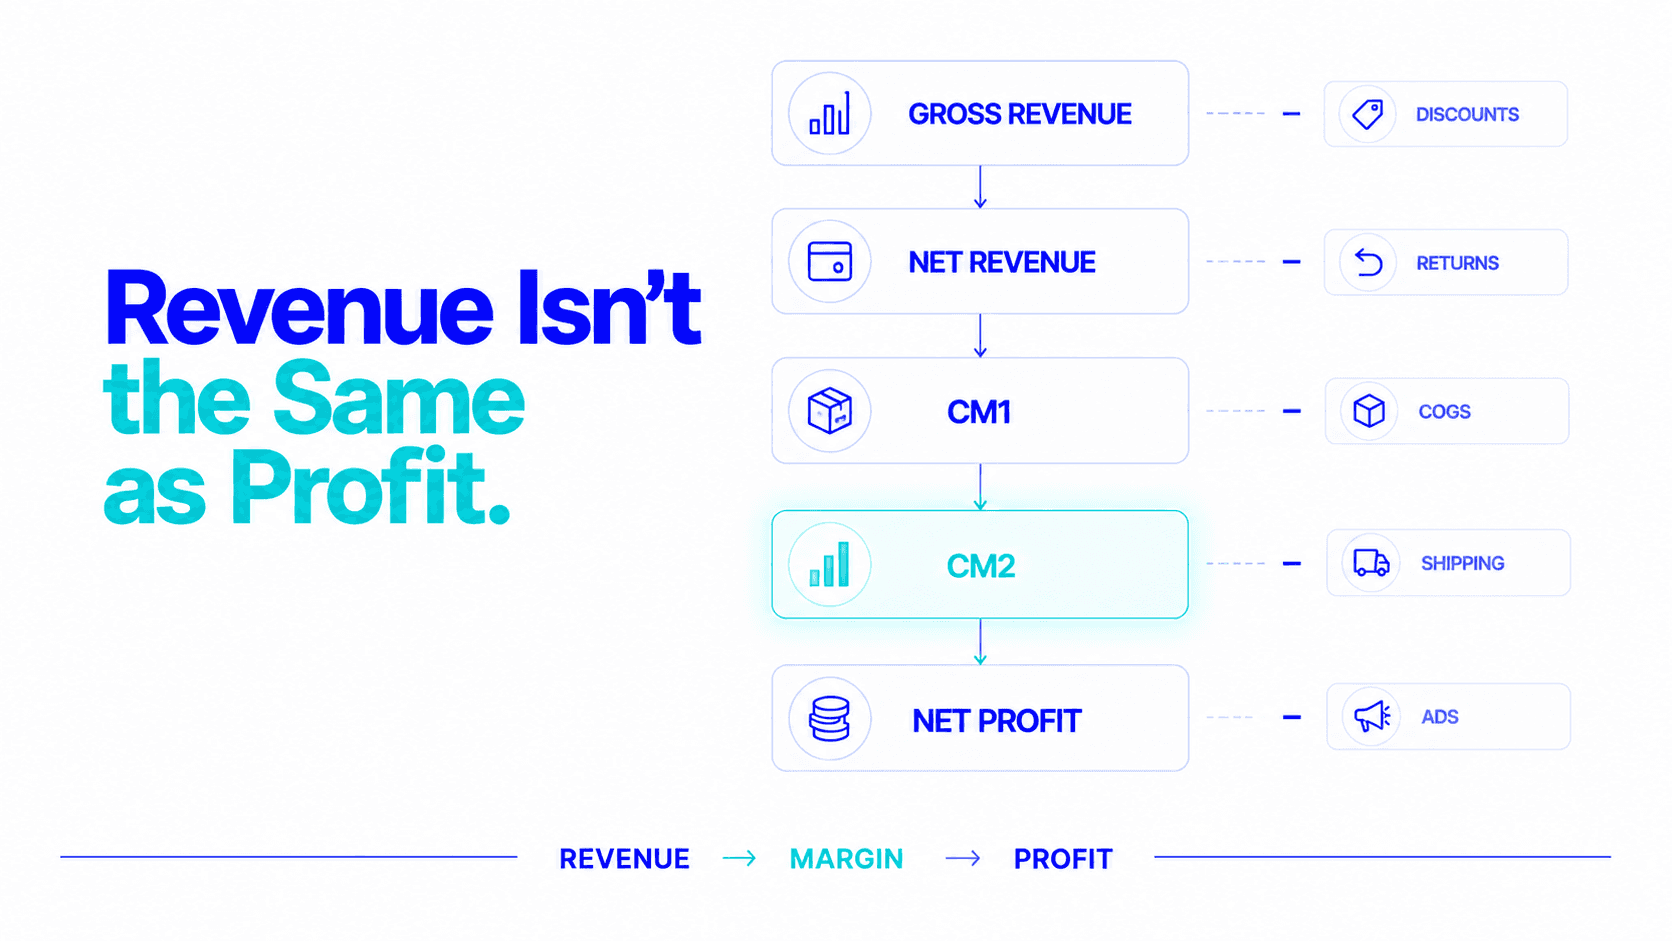
Understanding how ecommerce works means understanding how the numbers flow from customer acquisition to net profit. The framework has five levels:
Level 1
Total sales value at listed price. The most visible number. The least useful for business decisions.
Level 2
Gross Revenue − Discounts − Returns + Shipping Collected
This is the real revenue that entered the business. For Indian D2C brands with 15–25% return rates in fashion, or 20–30% COD refusal rates in Tier 2/3 markets, net revenue can be 20–30% lower than gross revenue.
Net revenue is the foundation of all subsequent calculations. Every metric that matters starts from here.
Level 3
CM1 = Net Revenue − Cost of Goods Sold (COGS)
COGS includes: manufacturing cost, packaging, quality testing, inbound freight from manufacturer to warehouse.
CM1 tells you whether the product itself is economically viable. A product with 20% CM1 has almost no room for advertising, shipping, and overhead. A product with 65% CM1 has significant room.
| Category | Healthy CM1 |
|---|---|
| Beauty / Skincare | 55–70% |
| Supplements | 60–75% |
| Fashion / Apparel | 45–60% |
| Food & Beverage | 35–50% |
| Electronics | 25–40% |
Level 4
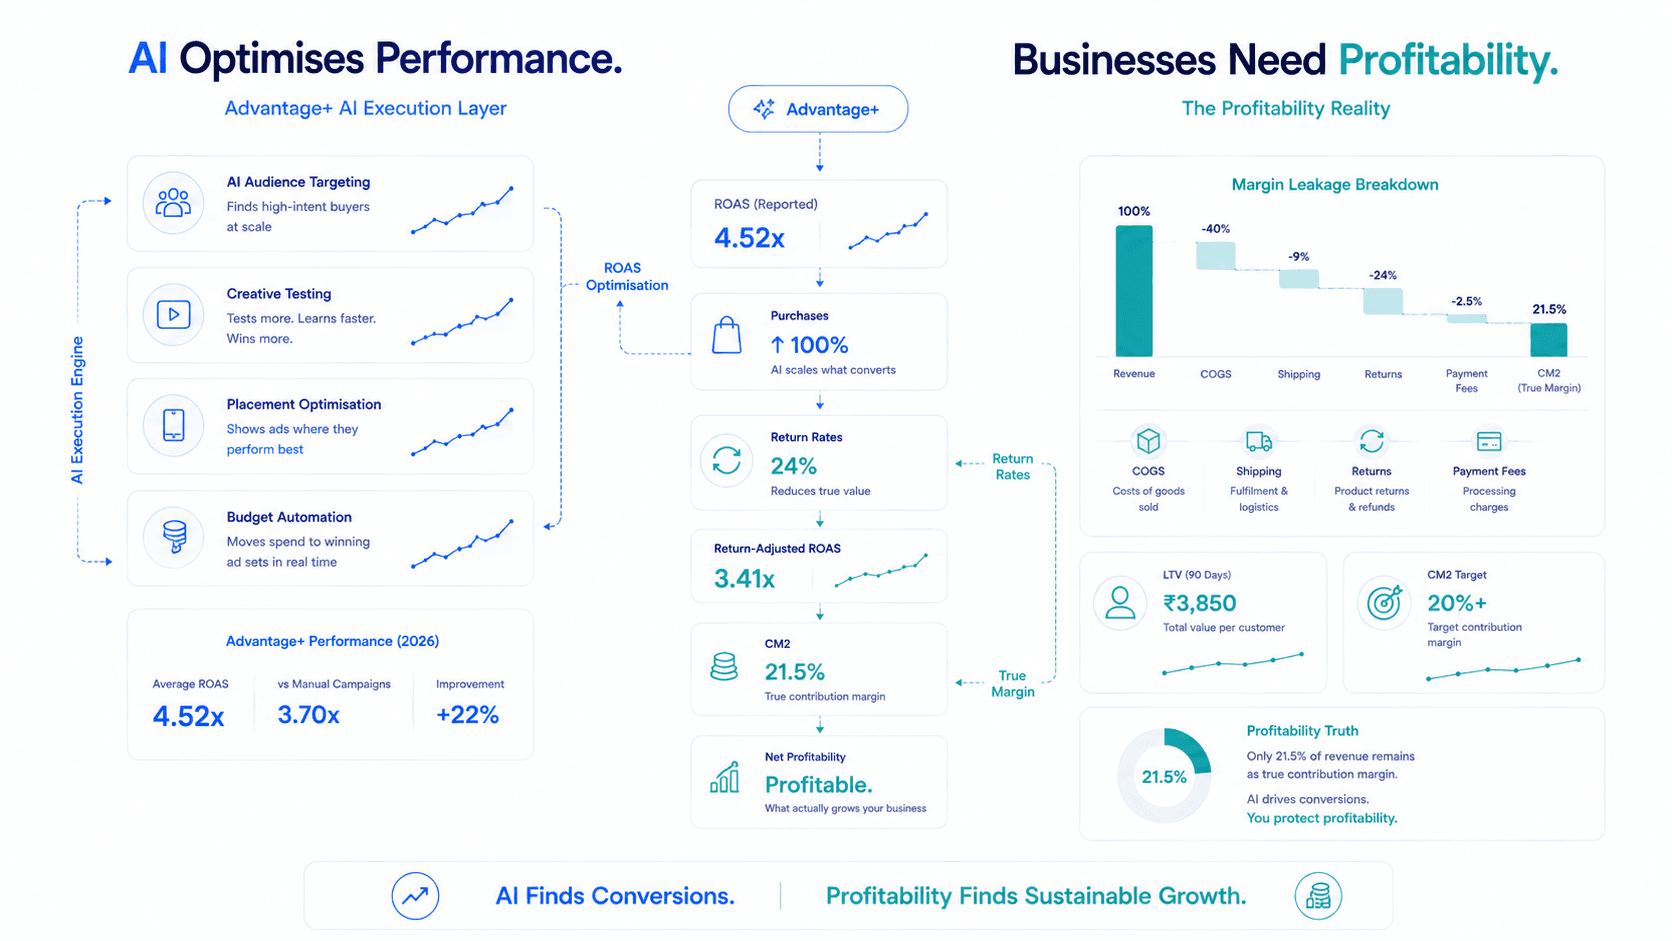
CM2 = CM1 − Outbound Shipping − Returns Processing − Payment Fees − Ad Spend
CM2 is campaign-level profitability. It tells you what a specific campaign contributed to covering fixed costs and generating profit.
This is the most important profitability metric in D2C ecommerce, and the one no ad platform can show you automatically, because they don’t have access to your COGS and returns data.
A brand with 4x ROAS and negative CM2 is growing revenue while destroying margin. A brand with 2.5x ROAS and 28% CM2 is building a profitable business.
Level 5
CM2 minus fixed costs (team salaries, warehouse rent, software, agency retainers) equals net profit.
For most scaling D2C brands, the target is to ensure CM2 is strong enough to cover fixed costs and leave meaningful profit at their current revenue run rate.
Many brands run both D2C and marketplace (Amazon, Flipkart, Nykaa, Meesho) channels. The economic differences are significant:
| D2C (own website) | Marketplace | |
|---|---|---|
| Gross margin | Higher (no platform take rate) | Lower (15–30% commission) |
| Customer acquisition | Brand’s responsibility | Marketplace’s traffic |
| Customer data | Brand owns it | Limited access |
| Returns management | Brand manages | Marketplace policy |
| Repeat purchase | Direct, rebuildable | Platform-controlled |
| CAC | Explicit (paid advertising) | Embedded in commission |
D2C economics require more upfront marketing investment but produce better long-term unit economics because the brand owns the customer relationship. Marketplace economics require lower upfront acquisition spend but yield permanently lower margins and no repeat purchase ownership.
The strongest D2C brands use marketplaces for discovery and their own channel for retention, capturing initial purchase attention on Nykaa or Amazon and then converting repeat purchasers to direct.
The advertising engine is the most capital-intensive part of D2C ecommerce for most brands. Understanding how it works is essential to managing the economics.
Meta (Instagram + Facebook)
Auction system: Every time a user opens Instagram or Facebook, an auction occurs for every ad slot in their feed. Advertisers compete by bidding. The winner is determined not just by bid amount but by estimated ad quality (Meta’s prediction of how likely the user is to engage) multiplied by bid. Better creative + relevant audience = lower effective cost per placement.
Attribution: Meta reports a conversion as attributed when a user who saw or clicked your ad made a purchase within the attribution window (default: 7-day click, 1-day view). This includes returns (still attributed), repeat buyers (attributed alongside new buyers), and view-through conversions where the user saw the ad but didn’t click.
What Meta can’t see: Your COGS. Your return data. Whether the attributed purchase came from a genuinely new customer or a returning one.
A user searching “vitamin C serum for dark spots buy online” has declared purchase intent explicitly, the ad reaches them at the moment of decision.
Shopping ads (Google Shopping/PMax): Pull from your product catalogue, match to relevant search queries, display product image + price + brand. High purchase intent, strong conversion rates.
Search ads: Text-based ads triggered by keyword searches. Brand keywords (searches for your brand name) typically have high conversion rates but moderate-low incrementality. Non-brand category keywords typically have lower conversion rates but high incrementality.
Attribution: Google’s default is last-click, the last ad clicked before purchase gets full credit. With 30-day click windows.
India’s D2C market has structural characteristics that don’t exist in Western ecommerce:
COD dominance
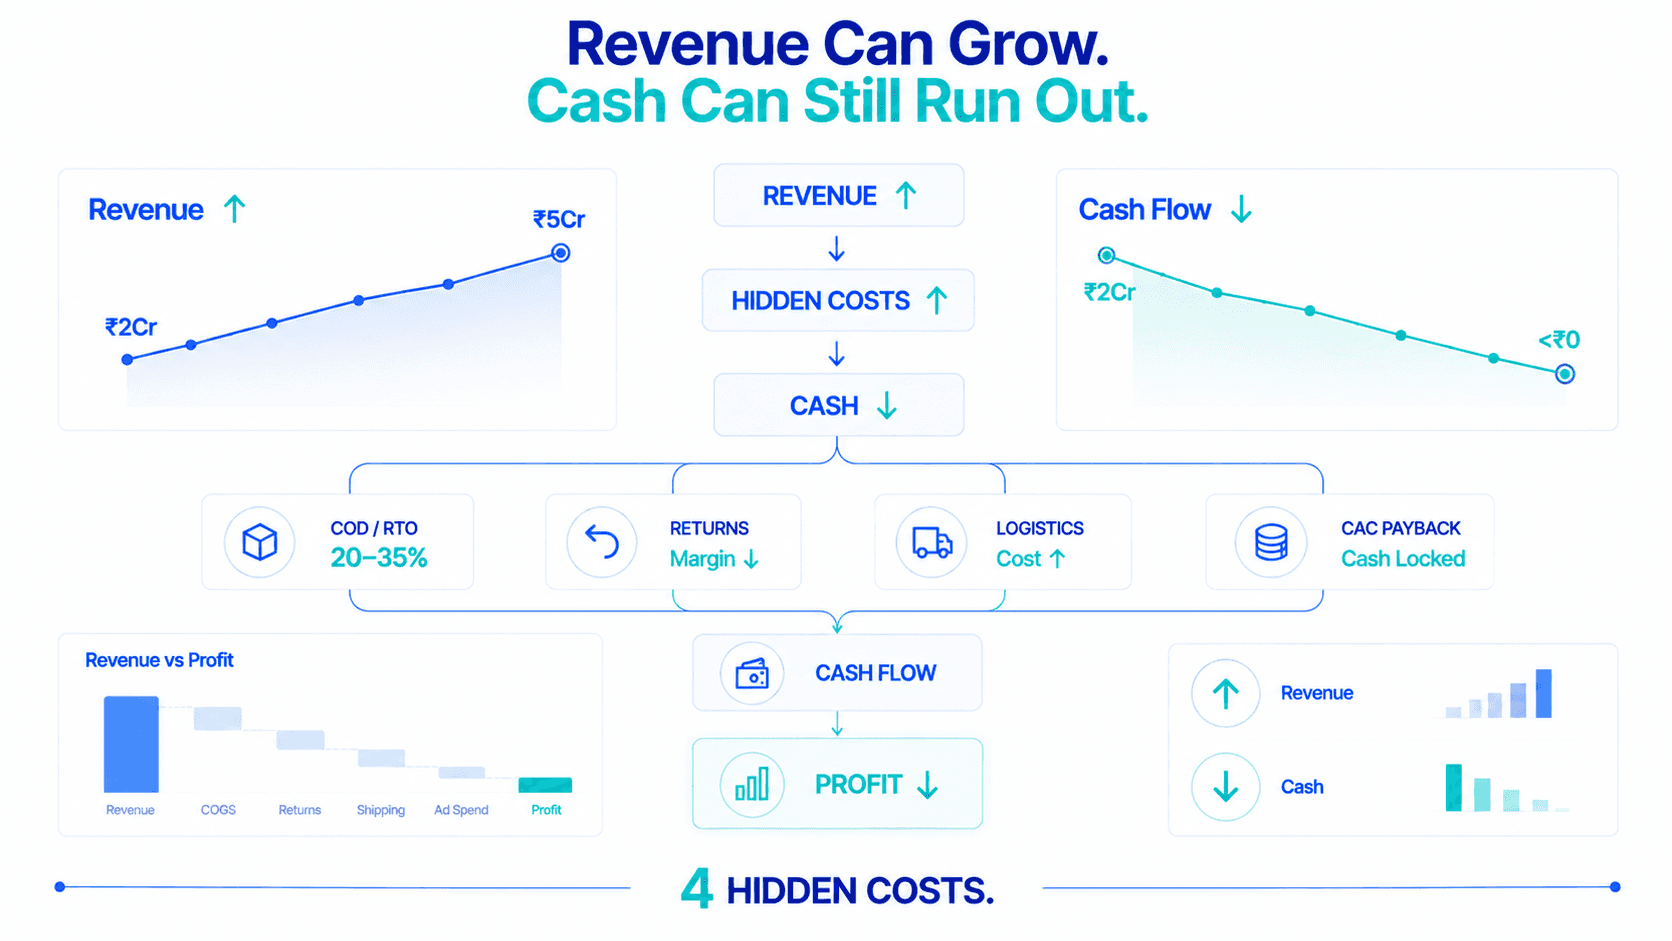
60–70% of D2C orders in India are placed as Cash on Delivery. COD removes payment trust barriers and drives conversions, but COD customers have 2–3× higher RTO (order refusal at delivery) rates than prepaid customers. Every refused COD delivery costs forward + reverse shipping with zero revenue.
RTO economics
A 25% COD refusal rate on orders averaging ₹1,200 costs the brand approximately ₹250 per refused order in logistics alone. At 1,000 COD orders/month, that’s ₹62,500 in pure logistics waste monthly.
Tier 2/3 opportunity
Higher population, lower competition, growing digital penetration. But Tier 2/3 audiences have higher COD rates, higher return rates, and require vernacular language content to convert effectively.
Festive concentration
Diwali, Republic Day, and Independence Day sales concentrate a disproportionate share of annual D2C revenue into tight windows. Brands that plan the economics (discount depth vs. margin) ahead of these windows significantly outperform brands that react in real time.
RTO cost at 1,000 COD orders a month
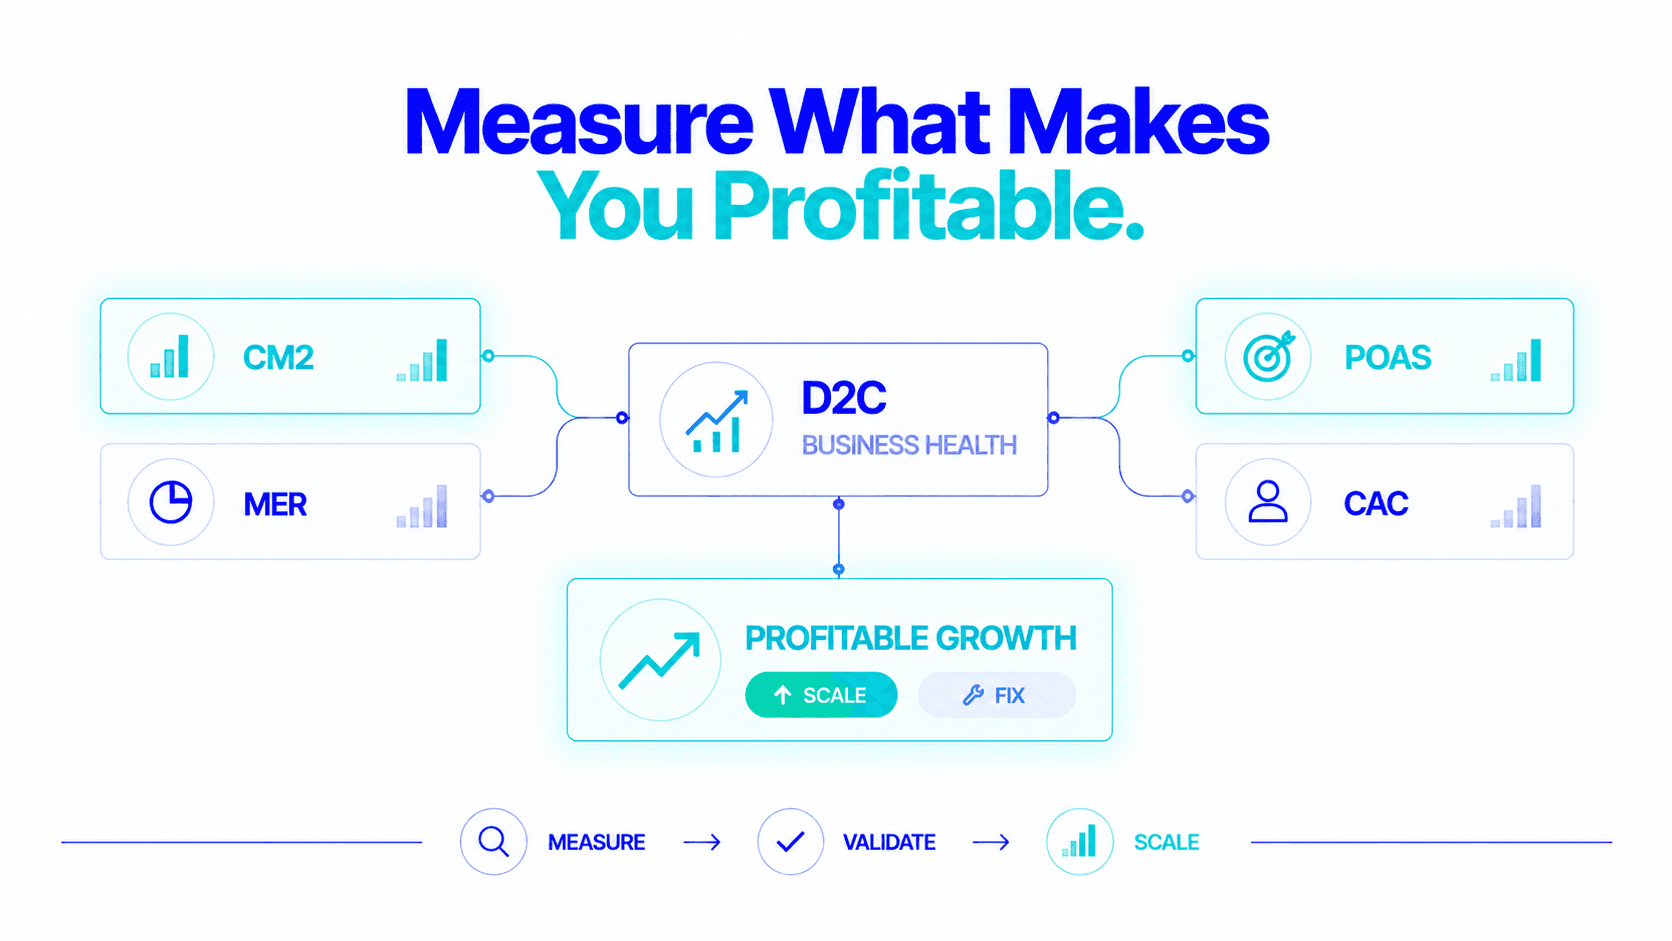
For a D2C brand at any stage, these are the metrics that actually determine business health:
CM2 per campaign
Is each advertising campaign profitable after all variable costs?
POAS (Profit on Ad Spend)
For every rupee of ad spend, how much gross profit returned?
MER (Marketing Efficiency Ratio)
Total Shopify net revenue ÷ Total marketing spend. The attribution-proof aggregate view.
True new customer CAC
Return-adjusted, prospecting-only, full-cost.
90-day repeat purchase rate
The leading indicator of LTV health.
LTV:CAC ratio
Is the business model sustainable?
Everything else, ROAS, sessions, CTR, follower count, is context that helps diagnose problems in these six metrics, not a primary indicator in its own right.
D2C ecommerce works when the gross margin retained by selling direct exceeds the customer acquisition cost required to replace the intermediary’s distribution function.
The brands that understand this, and build measurement infrastructure to see their CM2, POAS, and true CAC in real time, make better decisions faster. They scale what’s profitable before the window closes. They stop what’s loss-making before it compounds.
That is how D2C ecommerce works. Not the transaction mechanics. The unit economics.
Direct-to-Consumer (D2C) ecommerce is a model where a brand sells directly to end customers through its own website, bypassing distributors and retail chains. D2C brands keep the retail margin but must fund their own customer acquisition.
CM2 (Contribution Margin 2) = Net Revenue − COGS − Shipping − Returns − Payment Fees − Ad Spend. It measures what a specific campaign contributed to covering fixed costs and profit after all variable costs. It's the primary profitability metric for D2C advertising decisions.
ROAS measures revenue per ad rupee and is reported by ad platforms. POAS measures gross profit per ad rupee and requires connecting ad spend with COGS, returns, and shipping data. POAS has a universal break-even of 1.0; ROAS break-even varies by margin structure. POAS should drive D2C scaling decisions.
COD orders have 2–3× higher refusal rates at delivery (RTO, Return to Origin) than prepaid orders. Each refused COD delivery costs forward + reverse shipping with zero revenue. Brands heavy on COD face significant logistics losses that don't appear in ad platform reporting.
Flable AI connects ads, Shopify, returns and COGS so you can scale what’s profitable and stop what isn’t, before it compounds.