Seasonal Playbook
AOV is one of the least glamorous metrics in D2C. No one shares their AOV growth on LinkedIn. No agency pitches it in their winning slide.
But AOV, Average Order Value, is one of the most powerful unit economics levers available to D2C brands.
A 30% improvement in AOV, with everything else held constant, can transform a campaign from loss-making to profitable without spending a single additional rupee on acquisition.
Here’s why, and how.
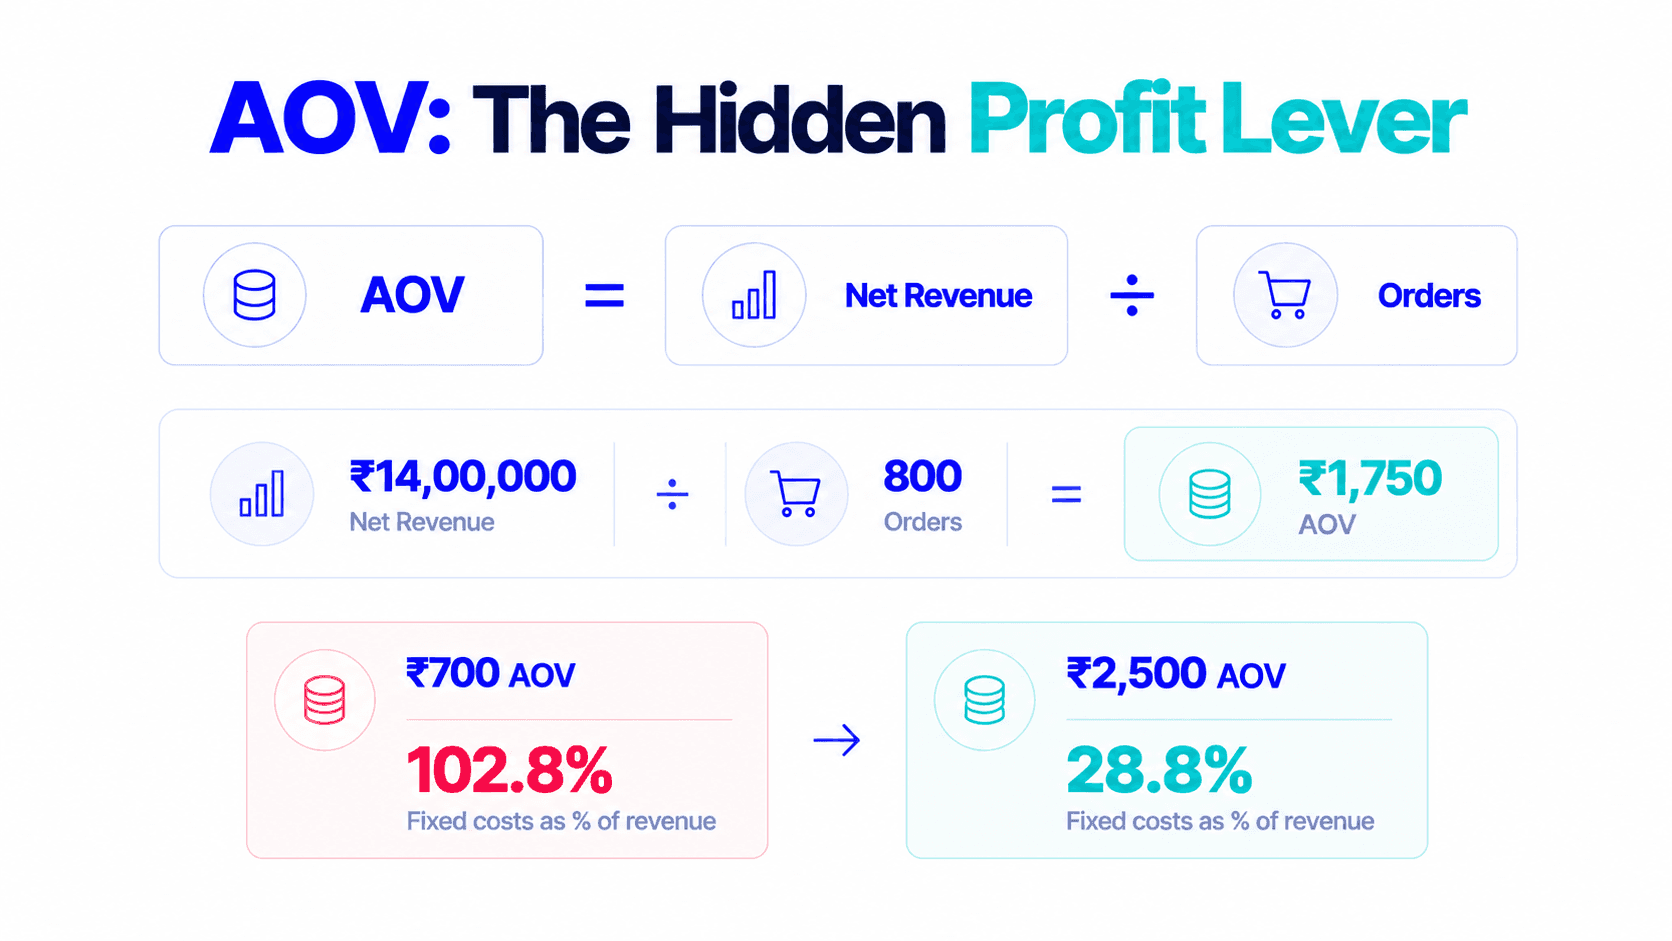
AOV = Total Net Revenue ÷ Total Number of Orders
AOV tells you the average value of each order placed at your store. It’s a simple calculation, but its impact runs through every profitability metric you track.
Here’s what most D2C founders miss about AOV: it’s a fixed cost absorption metric.
Certain costs in D2C are fixed (or near-fixed) per order regardless of order size:
Outbound shipping
Whether a customer orders ₹500 worth or ₹2,500 worth, the packaging and courier cost is roughly similar for most categories.
Payment processing
2.5% of order value, scales proportionally, but the minimum fee floor makes very low-AOV orders disproportionately expensive.
Fulfilment labour
Picking, packing, and labelling one order takes roughly the same time regardless of value.
Customer acquisition cost
You paid ₹600 to acquire that customer regardless of what they bought.
When AOV rises, these fixed costs shrink as a percentage of revenue, directly improving contribution margin.
| AOV | Shipping (₹120) | CAC (₹600) | Fixed cost as % of revenue |
|---|---|---|---|
| ₹700 | 17.1% | 85.7% | 102.8%, loss-making |
| ₹1,200 | 10.0% | 50.0% | 60.0%, marginal |
| ₹1,800 | 6.7% | 33.3% | 40.0%, viable |
| ₹2,500 | 4.8% | 24.0% | 28.8%, strong |
The same product, same customer acquisition cost, same shipping cost, the business at ₹2,500 AOV is fundamentally more profitable than the business at ₹700 AOV.
This is why low-AOV products with thin margins are often structurally incompatible with profitable paid advertising regardless of how well campaigns perform.
| Category | Low AOV | Average AOV | Strong AOV |
|---|---|---|---|
| Beauty / Skincare | <₹600 | ₹600–1,500 | >₹1,500 |
| Health / Supplements | <₹700 | ₹700–2,000 | >₹2,000 |
| Apparel / Fashion | <₹700 | ₹700–2,000 | >₹2,000 |
| Food & Beverage | <₹400 | ₹400–1,000 | >₹1,000 |
| Home / Lifestyle | <₹900 | ₹900–3,000 | >₹3,000 |
| Pet Products | <₹600 | ₹600–1,800 | >₹1,800 |
| Electronics | <₹2,000 | ₹2,000–8,000 | >₹8,000 |
These benchmarks are for net AOV (post-discounts, post-returns). If your AOV is consistently below the “Low” threshold for your category, you have a structural unit economics challenge. No campaign optimisation will compensate for an AOV that makes every order unprofitable.
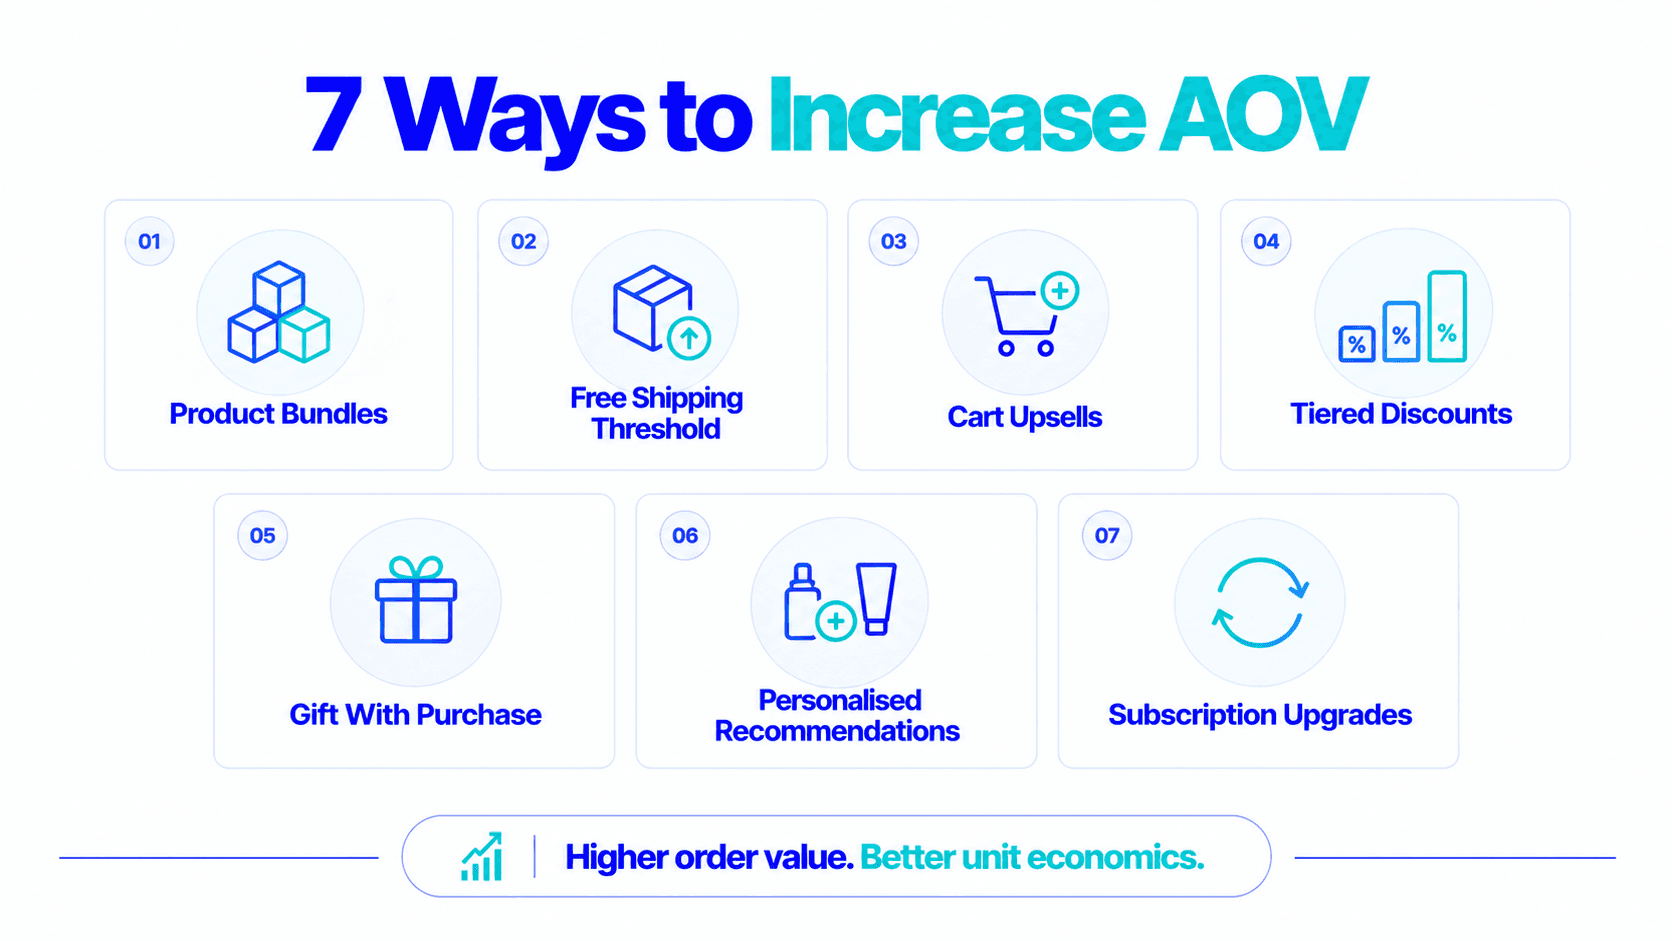
The playbook
Product Bundling
The highest-impact AOV lever for most D2C brands. A customer who buys a bundle spends 2–3× more per order while the shipping and fulfilment cost barely increases.
Bundle pricing rule: Offer 10–15% bundle discount. Even at 15% off, the shipping cost dilution and return rate improvement on bundle orders typically improves CM2 vs single-unit orders significantly. (The full bundle strategy.)
Free Shipping Threshold Above Current AOV
If your current average AOV is ₹900 and you offer free shipping on orders above ₹1,200, you’ve created a powerful incentive to add another item.
How to implement: Set your free shipping threshold at 20–30% above your current AOV. Display the “You’re ₹X away from free shipping” message clearly throughout the cart and checkout flow.
Most brands see 15–25% of orders where the customer adds an item specifically to reach the free shipping threshold. These additions are essentially zero-CAC revenue that directly improves per-order economics.
Post-Add-to-Cart Upsell
After a customer adds a product to their cart, before or during checkout, show a targeted upsell offer. What works:
Shopify apps like ReConvert, AfterSell, and Zipify make post-cart upsells easy to implement without developer work.
BOGO and Tiered Discount Structure
Instead of a flat percentage off everything, structure discounts to reward higher spending:
| Quantity | Discount |
|---|---|
| Single unit | Full price |
| Buy 2 | 8% off |
| Buy 3 | 15% off |
| Buy 4+ | 20% off |
Each tier incentivises spending more. The discount is self-funding because the higher volume improves your economics (shipping dilution, bulk COGS efficiency) even after the discount.
Gift With Purchase Threshold
“Spend ₹1,500 and get [product] free.”
This lifts AOV to the threshold without reducing the selling price of the core purchase. Customers who were going to spend ₹900 now spend ₹1,500 to get the gift. The gift item typically has a high CM1 (popular, low-cost to produce) while the incremental revenue from ₹600 more spending easily covers its cost.
Personalised Product Recommendations
Show “frequently bought together” and “customers who bought X also bought Y” recommendations on product pages and in the cart.
Personalisation based on purchase history (for returning customers) performs significantly better than generic “bestsellers” recommendations. A customer who bought a vitamin C serum last month and is back on site should see retinol or SPF, not random bestsellers.
Subscription Upgrades at Checkout
At the payment step, offer a “Subscribe and save 12% on every order” option alongside the one-time purchase. Subscription customers have higher LTV and, importantly, their first subscription order often includes an initial stocking quantity (2–3 months’ supply) that immediately increases first-order AOV.
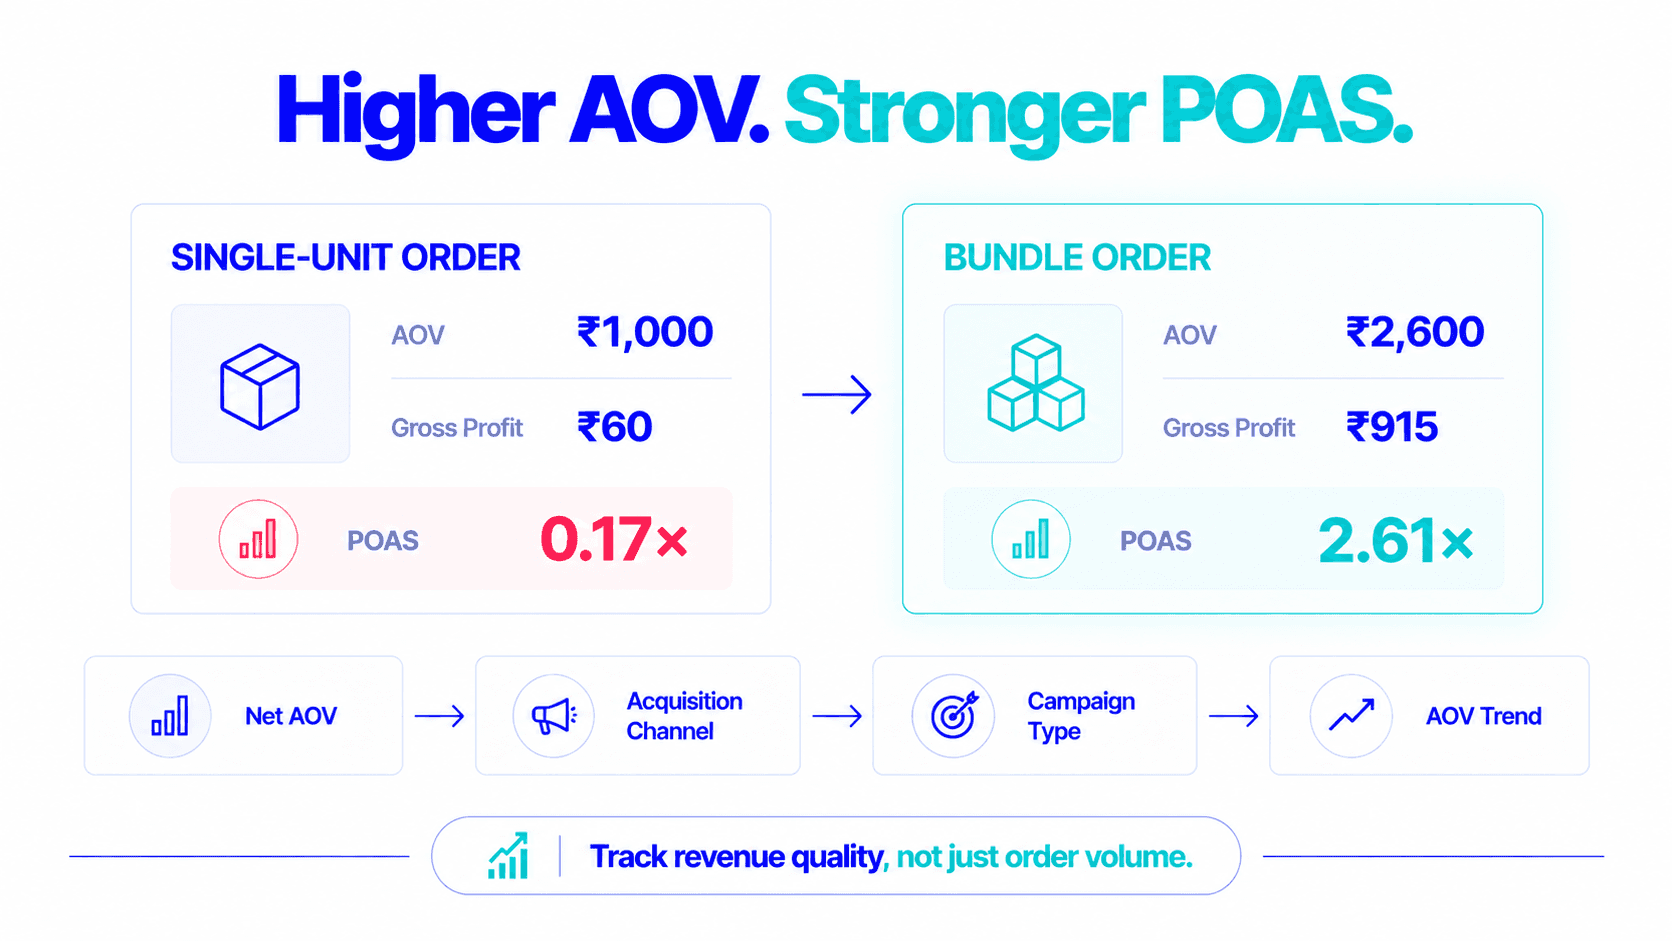
Higher AOV doesn’t just improve per-order economics, it directly improves POAS (Profit on Ad Spend).
POAS = Gross Profit ÷ Ad Spend
When AOV rises (holding all other variables constant):
Same campaign, two different customer behaviours:
| Single unit order | Bundle order | |
|---|---|---|
| AOV | ₹1,000 | ₹2,600 |
| COGS (40%) | ₹400 | ₹1,040 |
| Shipping | ₹120 | ₹140 |
| Returns (10%) | ₹45 | ₹90 |
| Payment fees | ₹25 | ₹65 |
| Ad spend attributed | ₹350 | ₹350 |
| Gross Profit | ₹60 | ₹915 |
| POAS | 0.17× | 2.61× |
Same campaign, same CAC, same ad spend. The single-unit buyer produces a POAS of 0.17×, deeply loss-making. The bundle buyer produces 2.61× POAS, excellent.
This is why bundle conversion rate is one of the most important secondary metrics for any D2C brand to track. Even a 20% bundle attach rate can transform campaign-level economics entirely.
Net AOV
The real per-order revenue. A campaign that appears to drive high gross AOV through deep discounts may have a lower net AOV than a full-price campaign driving half the volume.
AOV by acquisition channel
Meta prospecting customers, Google Shopping customers, and email-driven customers often have different AOVs. The channel that drives the highest AOV often justifies higher acquisition cost.
AOV by campaign type
Bundle-focused campaigns should show higher AOV than single-product campaigns. If they don’t, the bundle offer isn’t reaching and converting the right audience.
AOV trend
Rising AOV indicates your bundling and upsell strategies are working. Declining AOV indicates either product mix shift toward lower-price items or increasing discount depth.
AOV isn’t a vanity metric.
It’s the lever that determines whether your unit economics are viable at your current customer acquisition cost.
A brand with ₹500 AOV and ₹350 CAC has a structural profitability problem that no amount of campaign optimisation can fix. A brand that lifts AOV to ₹1,200 through bundles and upsells transforms those same campaigns from loss-making to profitable without changing a single targeting parameter.
Build the bundle. Set the free shipping threshold. Add the cart upsell. Track AOV by channel and campaign type.
AOV is the simplest lever with the most direct path to improved contribution margin. Pull it deliberately.
AOV stands for Average Order Value. AOV = Total Net Revenue ÷ Total Number of Orders. It measures the average revenue generated per order placed at your store and is one of the most direct levers on D2C unit economics and contribution margin.
Varies by category. Beauty/skincare: ₹600–1,500+ is typical, with >₹1,500 being strong. Fashion: ₹700–2,000+. Supplements: ₹700–2,000+. Food: ₹400–1,000+. The meaningful threshold is whether your AOV is high enough that fixed per-order costs (shipping, CAC) leave sufficient margin for a profitable CM2.
Higher AOV spreads fixed per-order costs (shipping, customer acquisition cost) across more revenue, directly improving POAS and CM2 as a percentage of revenue. A bundle order at 2.5× the single-unit AOV often generates 5–10× the contribution margin because the incremental revenue is nearly pure GM above the fixed cost floor.
Flable tracks CM2 per campaign, which reflects AOV performance because campaigns driving higher-AOV bundle orders show higher contribution margin than campaigns driving low-AOV single-unit orders. This makes the AOV impact on real profitability immediately visible per campaign.
Flable AI tracks CM2 per campaign, so bundle-driven, high-AOV campaigns show their real contribution against single-unit ones.