Deep Dive
D2C marketing has a language problem. ROAS, POAS, MER, CAC, LTV, CM1, CM2, AOV, CPA, CTR, CVR, CAPI, RTO — the acronyms stack up fast. This is the complete glossary explained in plain language with exact formulas.
18 Essential
Metrics & Definitions
5 Categories
Revenue, Profit, Efficiency, etc.
CM2 & POAS
Real Profit Metrics
Total sales value before any deductions, discounts, returns, or fees.
Where it belongs: Board decks and PR. Not in performance decisions.
What actually landed in your business after discounts and returns.
Benchmark: Should be at least 75–85% of gross revenue for healthy D2C brands.
AOV Benchmarks by Category:
| Category | Low AOV | Mid AOV | Strong AOV |
|---|---|---|---|
| Beauty / Skincare | <₹600 | ₹600–1,500 | >₹1,500 |
| Supplements | <₹800 | ₹800–2,000 | >₹2,000 |
| Apparel | <₹700 | ₹700–2,000 | >₹2,000 |
| Home / Lifestyle | <₹1,000 | ₹1,000–3,000 | >₹3,000 |
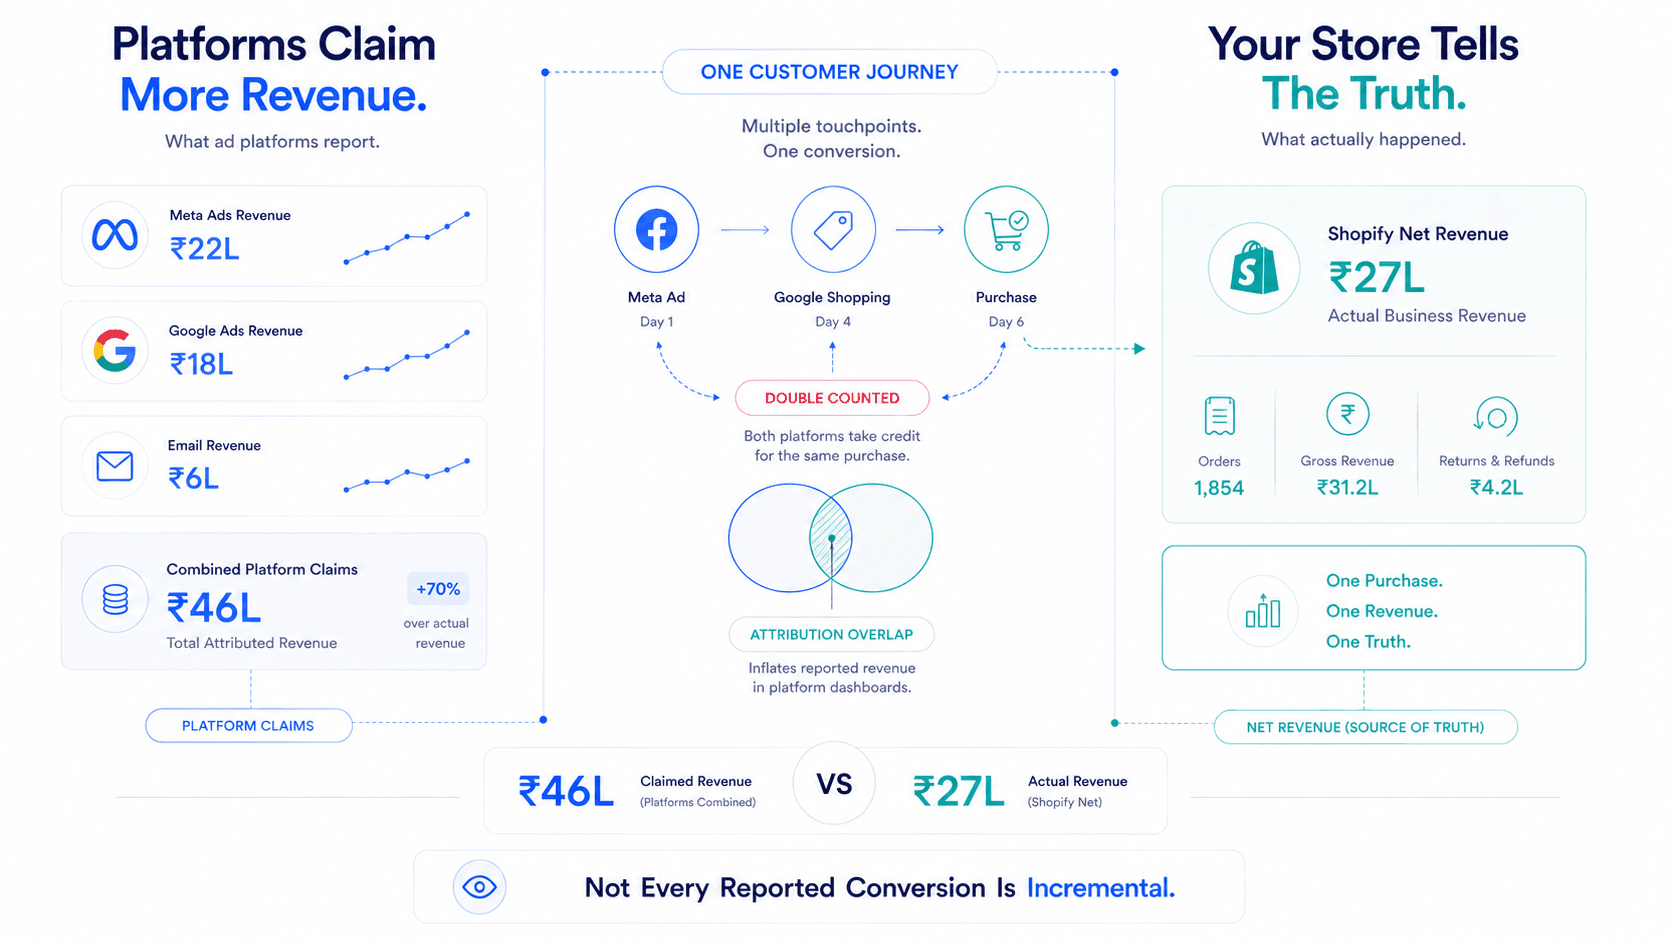
⚠️ Self-attribution Warning: Meta and Google both claim credit for the same sales. Combined platform ROAS significantly overstates real efficiency.
Break-even POAS: Always 1.0 (100%), universally across all margin structures.
| Category | Breakeven | Target POAS | Strong POAS |
|---|---|---|---|
| Beauty / Skincare | 1.0 | 1.3–1.8x | >1.8x |
| Supplements | 1.0 | 1.5–2.0x | >2.0x |
| Apparel | 1.0 | 1.2–1.6x | >1.6x |
| Food & Beverage | 1.0 | 1.1–1.4x | >1.4x |
| Electronics | 1.0 | 1.0–1.2x | >1.2x |
Target MER by stage: Early (<₹1Cr MRR): 3.5–5.0x | Growth (₹1–5Cr MRR): 2.8–4.0x | Scale (₹5Cr+): 2.2–3.5x
Used for setting bid constraints in Meta and Google automated bidding algorithms.
CM1 (Contribution Margin 1)
Net Revenue − COGS
Product-level profitability before variable marketing & shipping.
CM2 (Contribution Margin 2)
CM1 − Shipping − Returns − Fees − Ad Spend
Campaign-level net profit after all variable operating expenses.
Gross Margin % Benchmarks by Category:
| Category | Minimum | Healthy | Strong |
|---|---|---|---|
| Beauty / Skincare | 40% | 55–65% | >65% |
| Supplements | 45% | 60–70% | >70% |
| Apparel | 35% | 50–60% | >60% |
| Food & Beverage | 25% | 35–45% | >45% |
| Electronics | 15% | 25–35% | >35% |
CM2 per campaign, POAS per campaign, MER, True New Customer CAC, Net Revenue, Return Rate
ROAS (directional), CPA (diagnostic), Creative Frequency, Attribution Inflation Ratio
LTV by cohort, LTV:CAC ratio, CAC Payback Period, Gross Margin % by SKU
CAPI status, Pixel event quality, Attribution window settings
| Metric | Formula | Decision It Drives |
|---|---|---|
| Net Revenue | Gross − Discounts − Returns | Ground truth for all financial decisions |
| AOV | Net Revenue ÷ Orders | Bundling and pricing strategy |
| ROAS | Platform Revenue ÷ Ad Spend | In-platform creative & bidding decisions |
| POAS | Gross Profit ÷ Ad Spend | Scale / Hold / Kill decisions |
| MER | Shopify Net Rev ÷ Total Spend | Cross-channel efficiency & agency review |
| CM1 | Net Revenue − COGS | Product advertising eligibility |
| CM2 | CM1 − Shipping − Returns − Fees − Ad Spend | Campaign profitability verdict |
| True CAC | Prospecting Spend ÷ Net New Customers | Acquisition efficiency |
| LTV | AOV × Frequency × Margin × Lifespan | Justification for CAC |
| Payback Period | CAC ÷ Monthly Gross Profit | Cash flow planning for scaling |
| Return Rate | Returns ÷ Orders | Campaign quality signal |
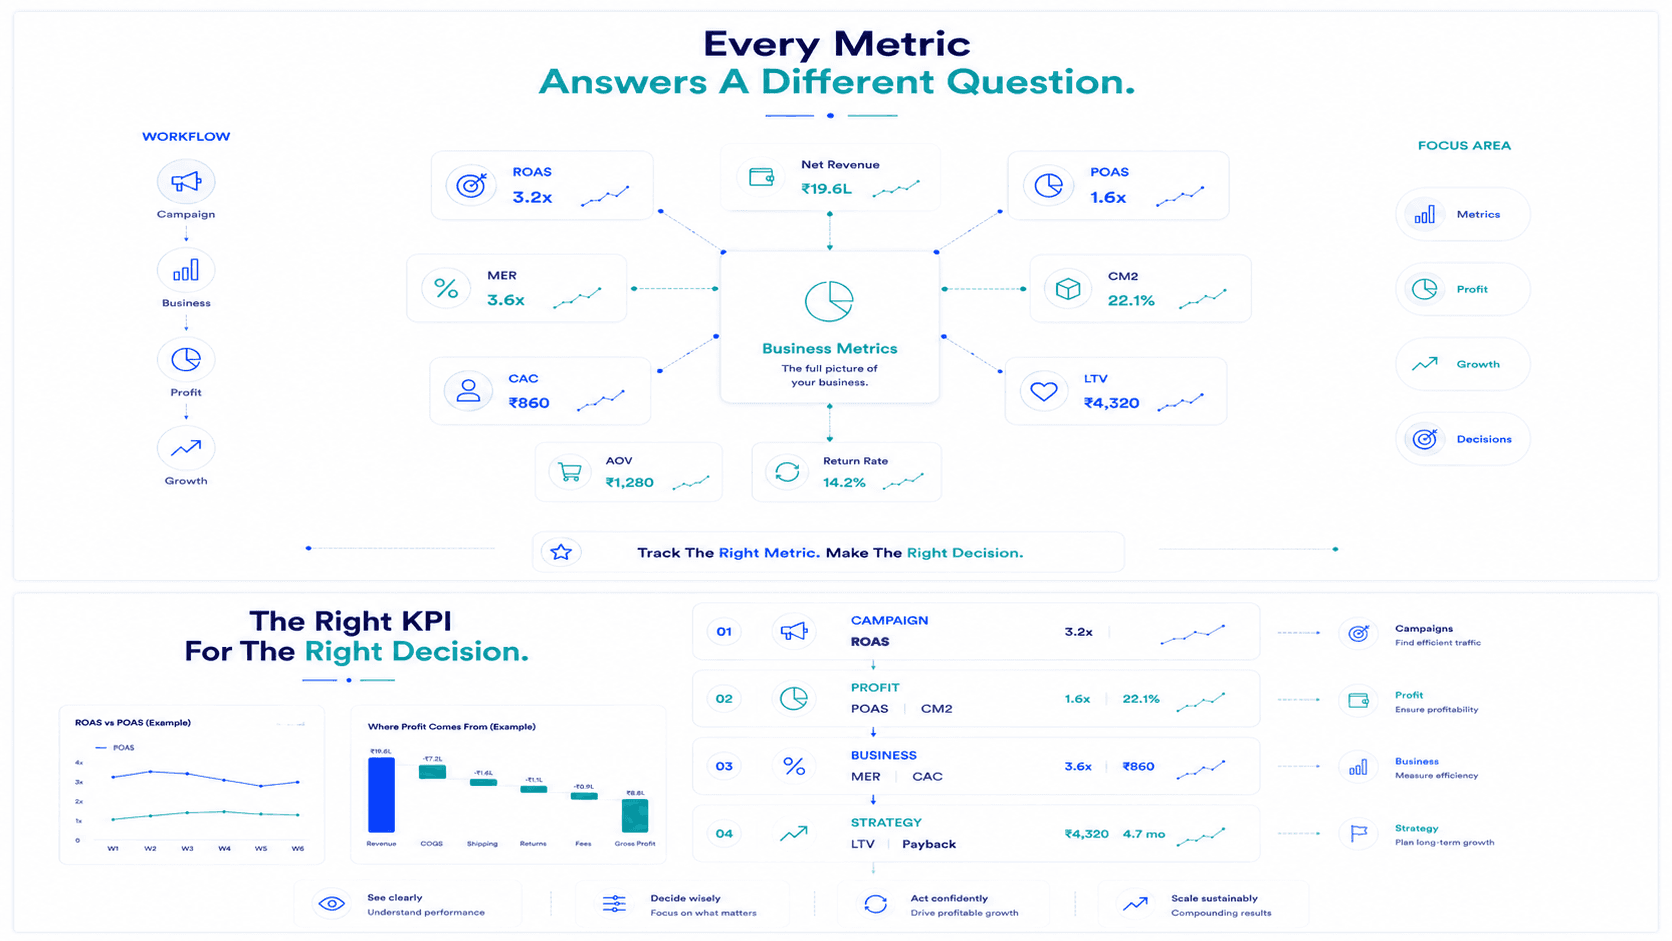
Ecommerce metrics are not equally useful. Some answer campaign questions. Some answer business questions. Some are platform vanity metrics dressed up as performance indicators.
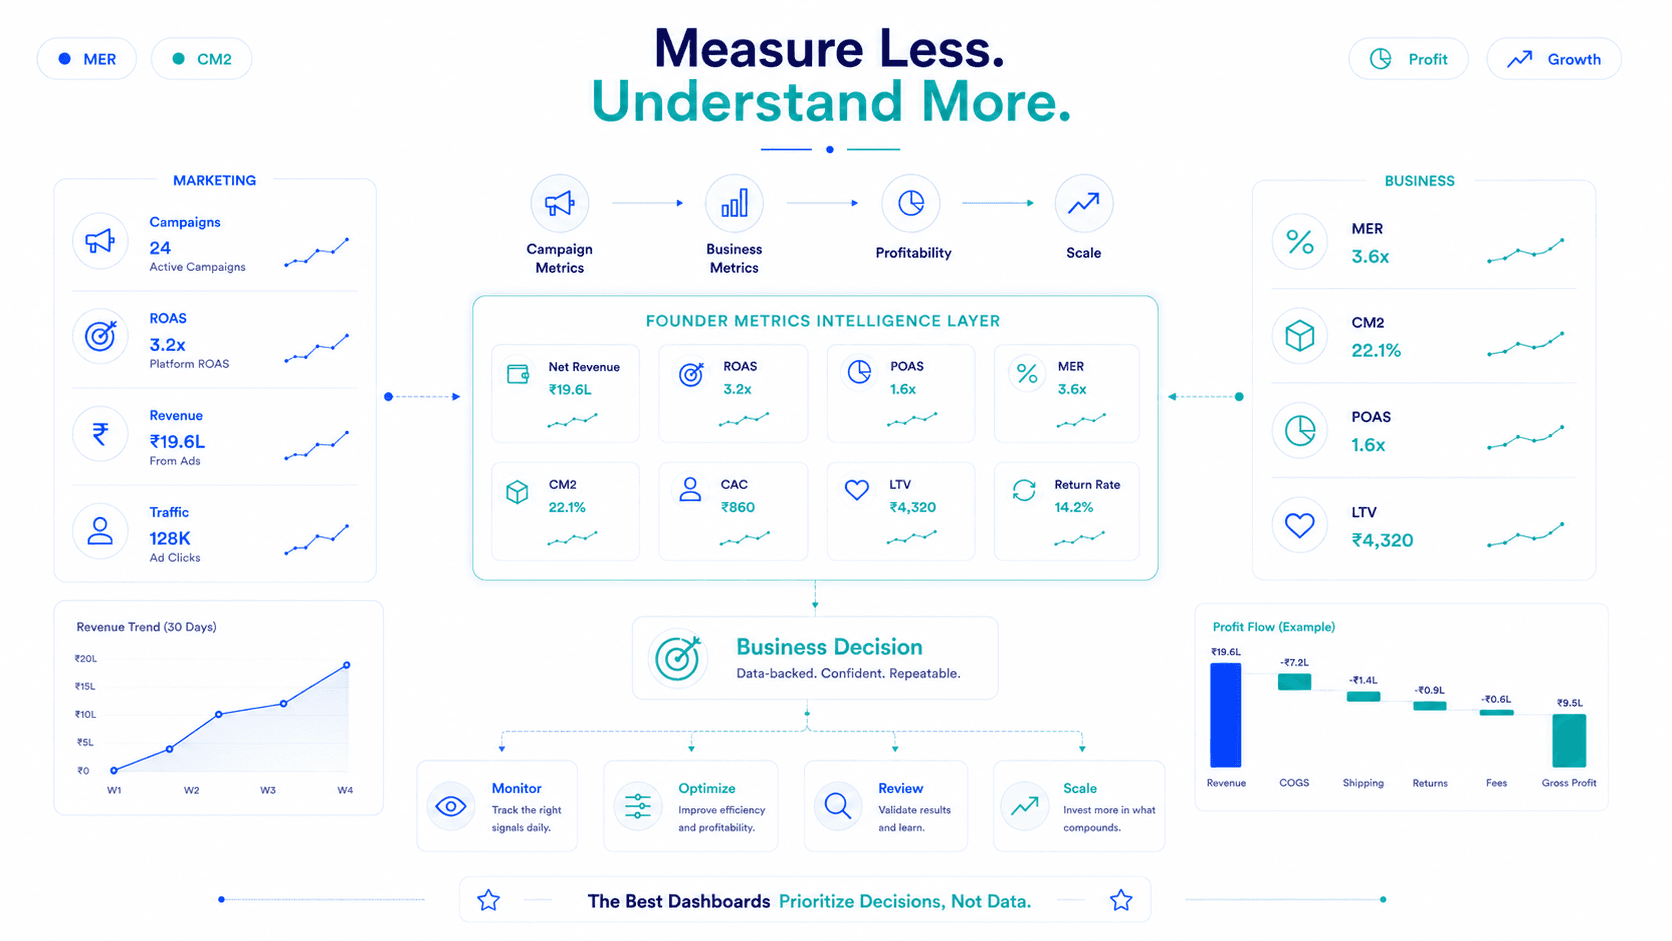
The brands that scale profitably are not the ones tracking the most metrics — they're the ones that know exactly which metric answers which question, and they act on the right one at the right moment.
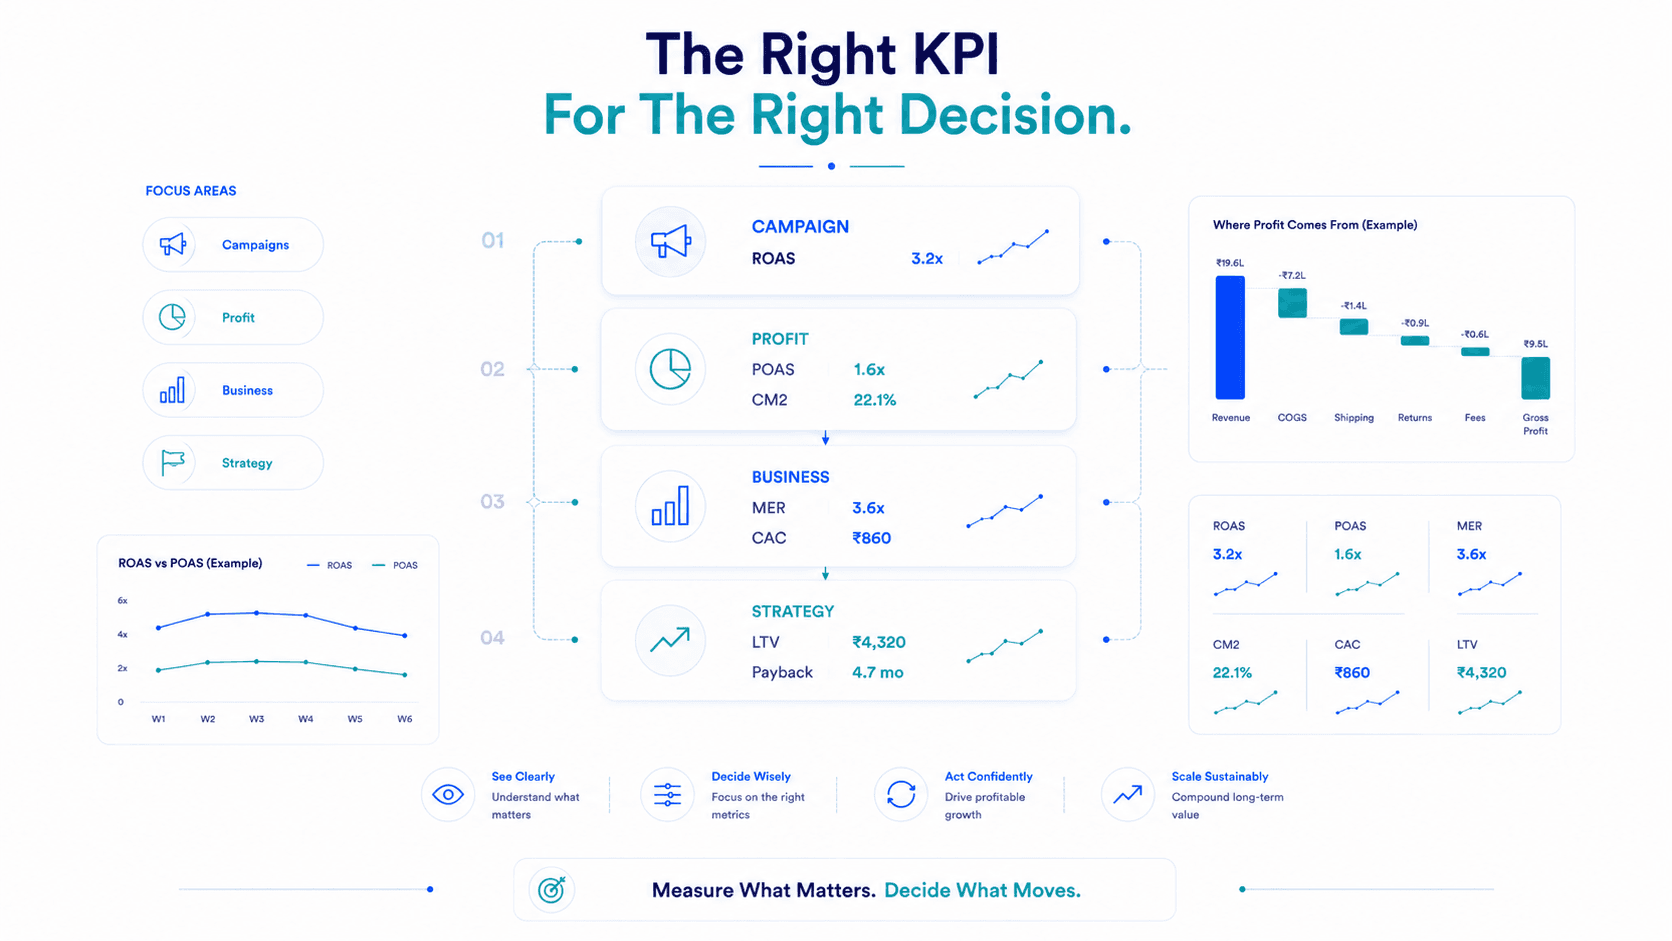
POAS and CM2 for campaign decisions. MER for macro efficiency. LTV and payback period for strategic direction. Everything else is context.
Key Takeaway
Know the hierarchy. Use the right metric at the right time. That's how data becomes decisions.
Frequently Asked Questions
For campaign-level decisions: POAS (Profit on Ad Spend), it's the only metric that directly measures whether a campaign is profitable. For business-level decisions: MER (Marketing Efficiency Ratio) — it measures aggregate marketing efficiency against real Shopify revenue, immune to platform attribution bias.
ROAS = Platform Revenue ÷ Ad Spend (measures revenue efficiency, ignores COGS, returns, and shipping). POAS = Gross Profit ÷ Ad Spend (measures profit efficiency, accounts for all variable costs). The same campaign can show 4x ROAS and 0.85x POAS (loss-making) simultaneously. Scale on POAS, not ROAS.
CM2 (Contribution Margin 2) = Net Revenue − COGS − Shipping − Returns − Payment Fees − Ad Spend. It's campaign-level profitability — what a specific campaign contributed to gross profit after every variable cost. It's the correct denominator for scaling decisions.
Weekly: CM2 per campaign, POAS, MER, New Customer CAC (return-adjusted), Return Rate by campaign, Shopify Net Revenue, Attribution Inflation Ratio. These seven cover campaign profitability, macro efficiency, and acquisition quality — the decisions that happen every week.
Flable connects Meta and Google ad spend, Shopify net revenue and returns data, and COGS inputs to calculate POAS, CM2, MER, and true new customer CAC in real time, per campaign and per channel. No spreadsheet reconciliation required. All metrics are live on your dashboard every morning.
POAS, CM2, MER, CAC, return rate, all automatic. All real-time.
Start Measuring Profitability →Setup in 48 hours · No credit card required · Backed by Microsoft & NVIDIA