Meta Ads
Why Your Meta Ads Look Profitabe, But Your Bank Account Says Otherwise
There's a specific kind of dread familiar to almost every D2C founder: you open Meta Ads Manager, see a 3.8x ROAS on your best campaign, feel genuinely good about the business for about four minutes, and then you check your bank balance and it doesn't match the story at all.
This isn't a rare glitch. It's one of the most common and least discussed problems in performance marketing, and it has gotten worse as acquisition costs have climbed. Average ecommerce customer acquisition cost rose 40–60% between 2023 and 2025, and Meta Ads CPMs have increased roughly 18–20% year over year across most verticals in 2026. Ad accounts can look identical on the surface, same ROAS, same spend, same "efficient" campaigns, while the underlying profit outcome quietly deteriorates.
This piece breaks down exactly why that disconnect happens, walks through a real numeric example, and lays out what to track instead so your dashboard finally agrees with your bank statement.
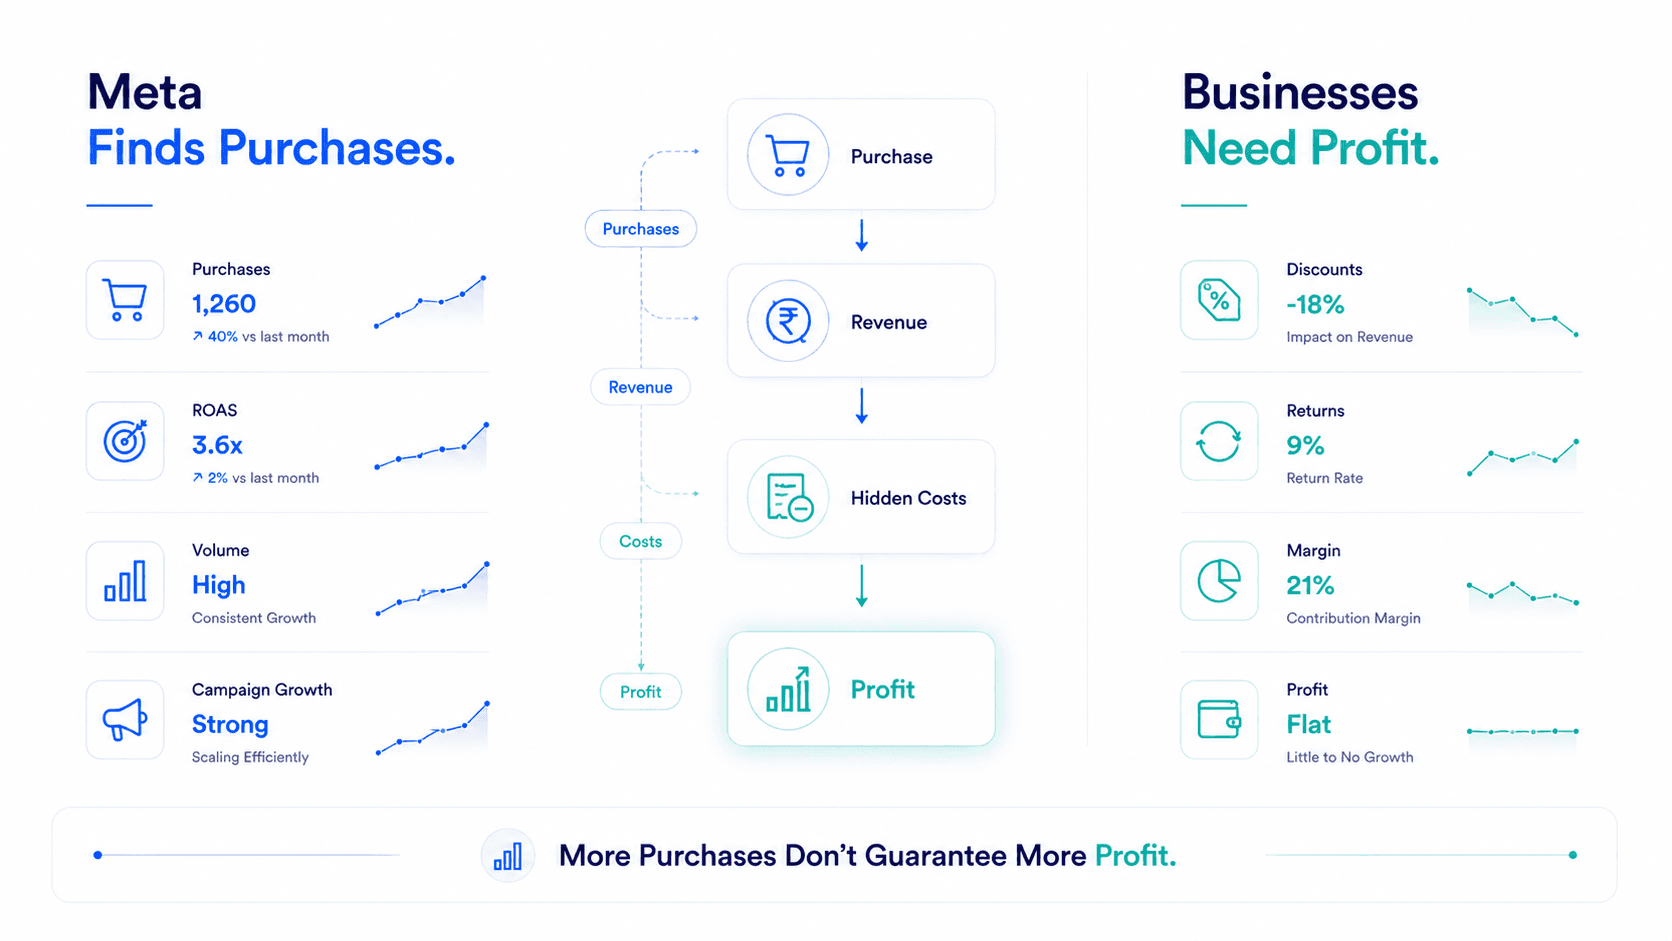
Ask any founder what ROAS they're targeting and they'll answer instantly usually something like "3x minimum" or "anything above 4x is good." Ask the same founder what their actual profit margin was last month after ad spend, COGS, shipping, and returns, and the answer usually gets much vaguer.
That gap in confidence isn't a knowledge problem. It's a tooling problem. Ad platforms report what they're built to report: clicks, conversions, and revenue attributed to their own pixel. They were never built to know your cost of goods, your payment processor's fee schedule, or your return rate. So the "profitability" a founder sees in Ads Manager is really just a revenue efficiency number wearing a profitability costume.
| Gap | What It Does | Why ROAS Misses It |
|---|---|---|
| Cost of Goods Sold (COGS) | Reduces true margin per unit | ROAS only looks at revenue, never cost |
| Payment Processing Fees | Typically 2–3% of every transaction | Not tracked in ad platforms at all |
| Shipping & Fulfillment | Often 8–15% of order value | Lives in your fulfillment or 3PL system, invisible to Meta |
| Discounts & Promo Codes | Directly reduces realized revenue | Ads Manager reports gross revenue, not net-of-discount |
| Returns & Refunds | Can reverse "won" revenue days later | Attribution happens at time of purchase, not after returns |
| Attribution Inflation | Overstates revenue actually caused by the ad | Meta's pixel takes credit broadly across the customer journey |
There are four structural reasons a healthy-looking ad account can coincide with a shrinking bank balance:
Revenue is not profit. Every dollar of "ad revenue" still has product cost, fulfillment cost, and platform fees subtracted before anything reaches the bank.
Cash timing lags reporting. Ad spend is billed immediately; revenue from sales (especially with payment processing holds, COD, or Buy Now Pay Later) can lag by days or weeks.
Returns and chargebacks land later. A sale that looked profitable in week one can become a loss in week three once a return or chargeback is processed after the ROAS number was already reported and celebrated.
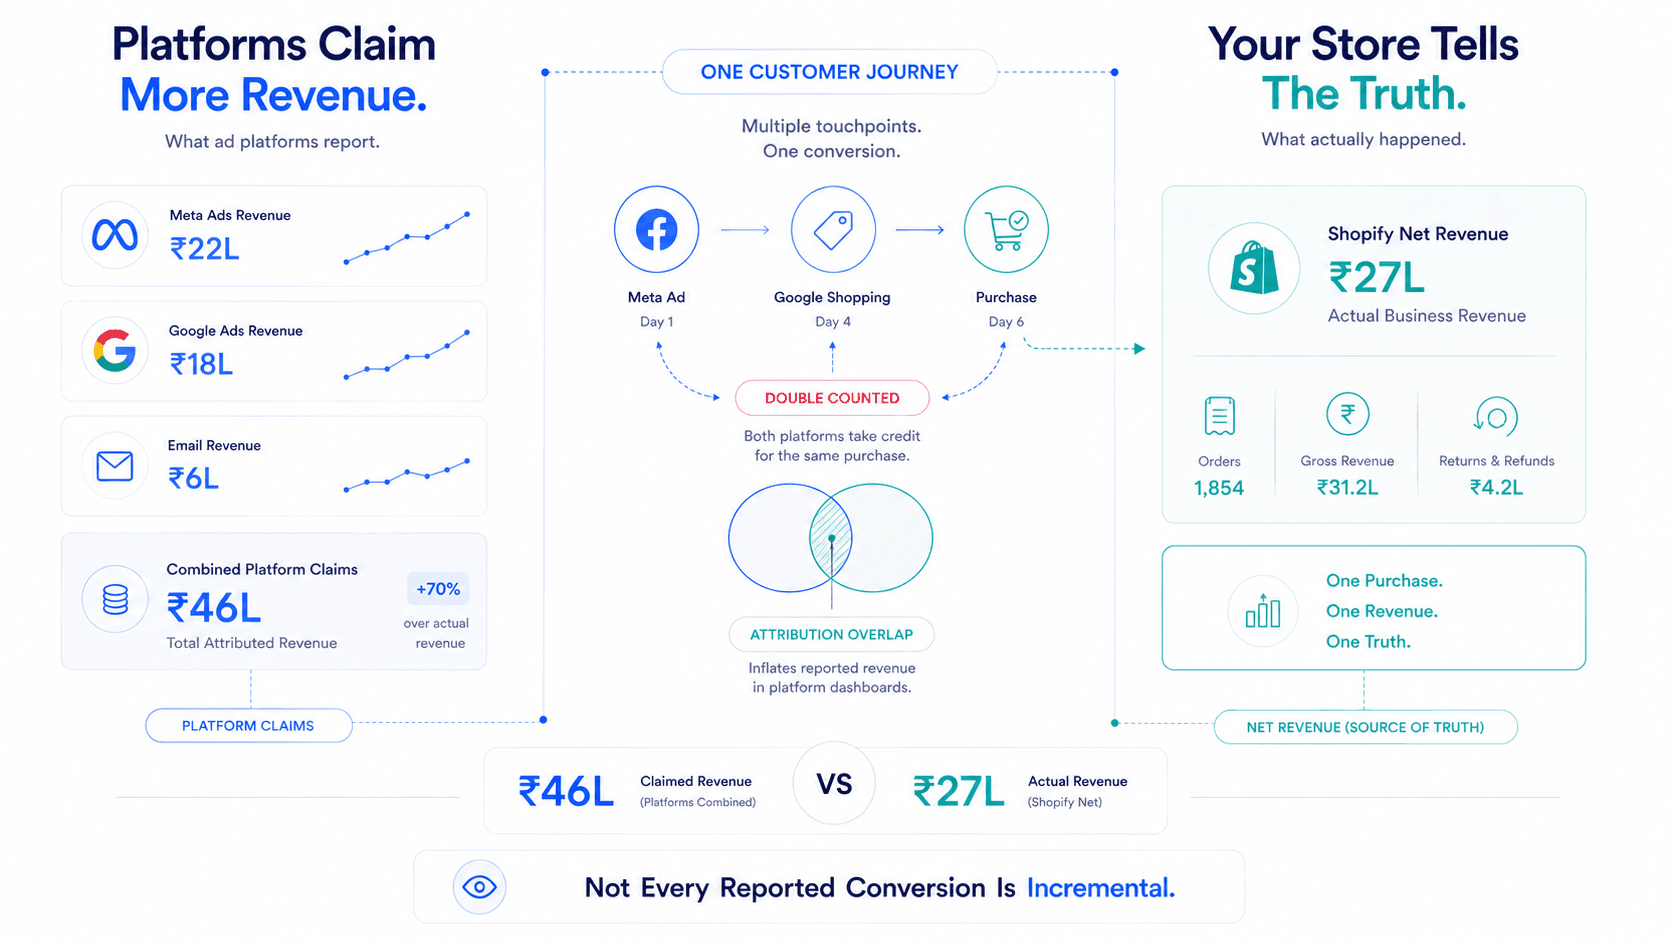
Attribution overlap inflates in-platform numbers. Meta frequently claims credit for revenue that other channels (email, organic, branded search) also contributed to or would have generated anyway.
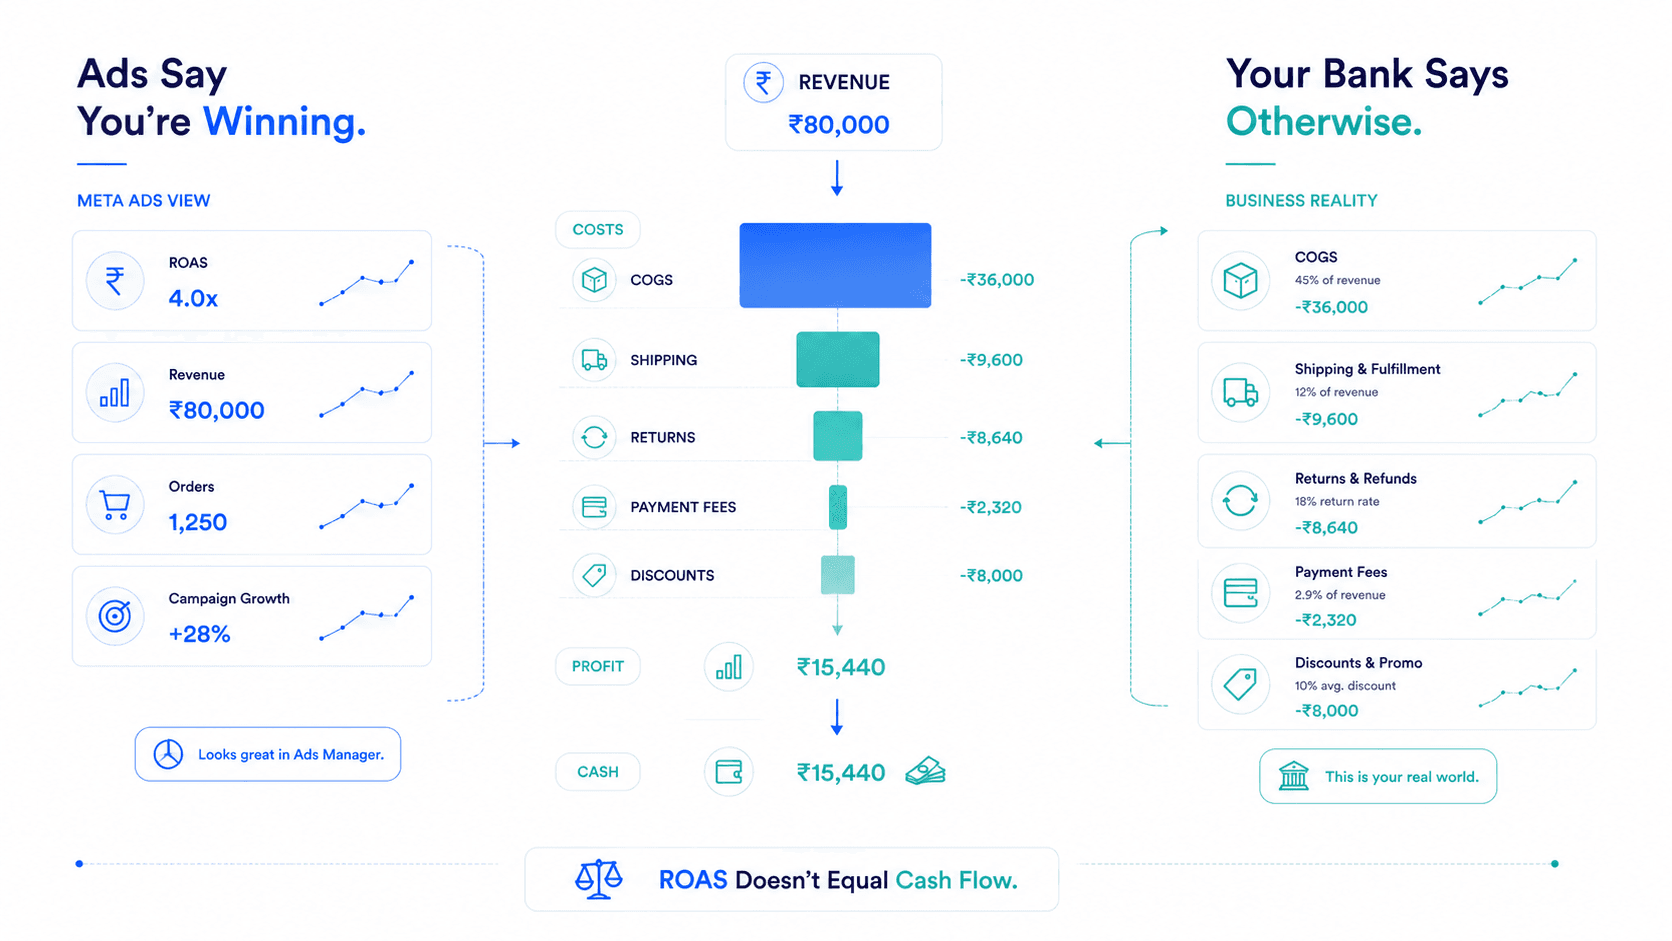
Consider a D2C apparel brand running a $20,000 monthly Meta budget with a reported 4.0x ROAS — meaning $80,000 in attributed revenue.
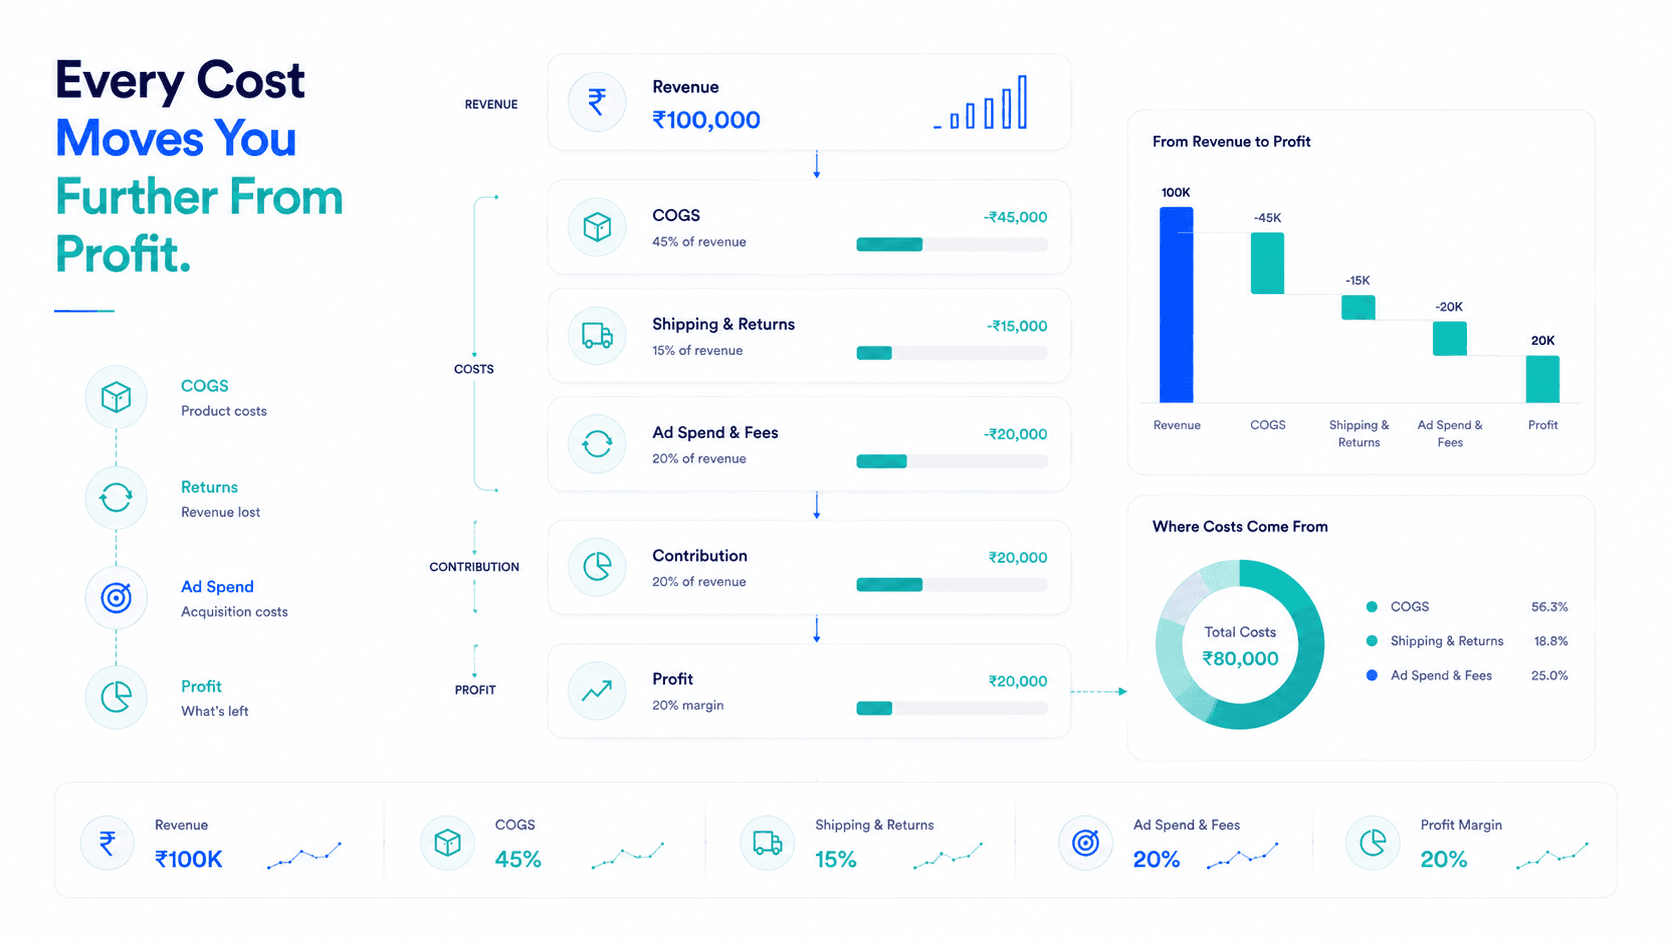
Returns (18% return rate on apparel, averaging 60% of order value refunded): −$8,640
Against $20,000 in ad spend, that's a POAS of 0.77x, meaning the brand is technically losing money on this channel despite a 4x ROAS that looked outstanding in the ad platform. This is exactly the scenario that convinces founders their reporting is "broken," when really it's just incomplete.
It's worth being fair to the platform here: Meta Ads Manager was never designed to be a profit and loss statement. It's an advertising performance tool, and for that narrow purpose, it does its job reasonably well. The failure happens when brands treat platform-reported ROAS as if it were a substitute for financial reporting.
According to Meta's own advertiser resources, ROAS and attributed conversions are meant to help optimize campaign delivery not to represent verified, deduplicated business outcomes. The responsibility for connecting that number to actual profit sits with the brand's own reporting stack, not the ad platform.
Attribution inflation compounds the cost-blindness problem. Since iOS privacy changes reduced the accuracy of cross-device tracking, Meta has leaned more heavily on modeled conversions — statistical estimates of purchases it likely influenced but can't directly observe. Multiple attribution studies from firms including Triple Whale and ProfitMetrics have found that in-platform ROAS frequently overstates true incremental revenue, sometimes significantly, especially for brands with strong organic or email channels running alongside paid social.
This means the ROAS number itself can be inflated before you even get to the cost layer problem — a double distortion that makes bank account reality feel even further from the ad dashboard.
MER (Marketing Efficiency Ratio): Corrects for attribution overlap by comparing total store revenue to total marketing spend.
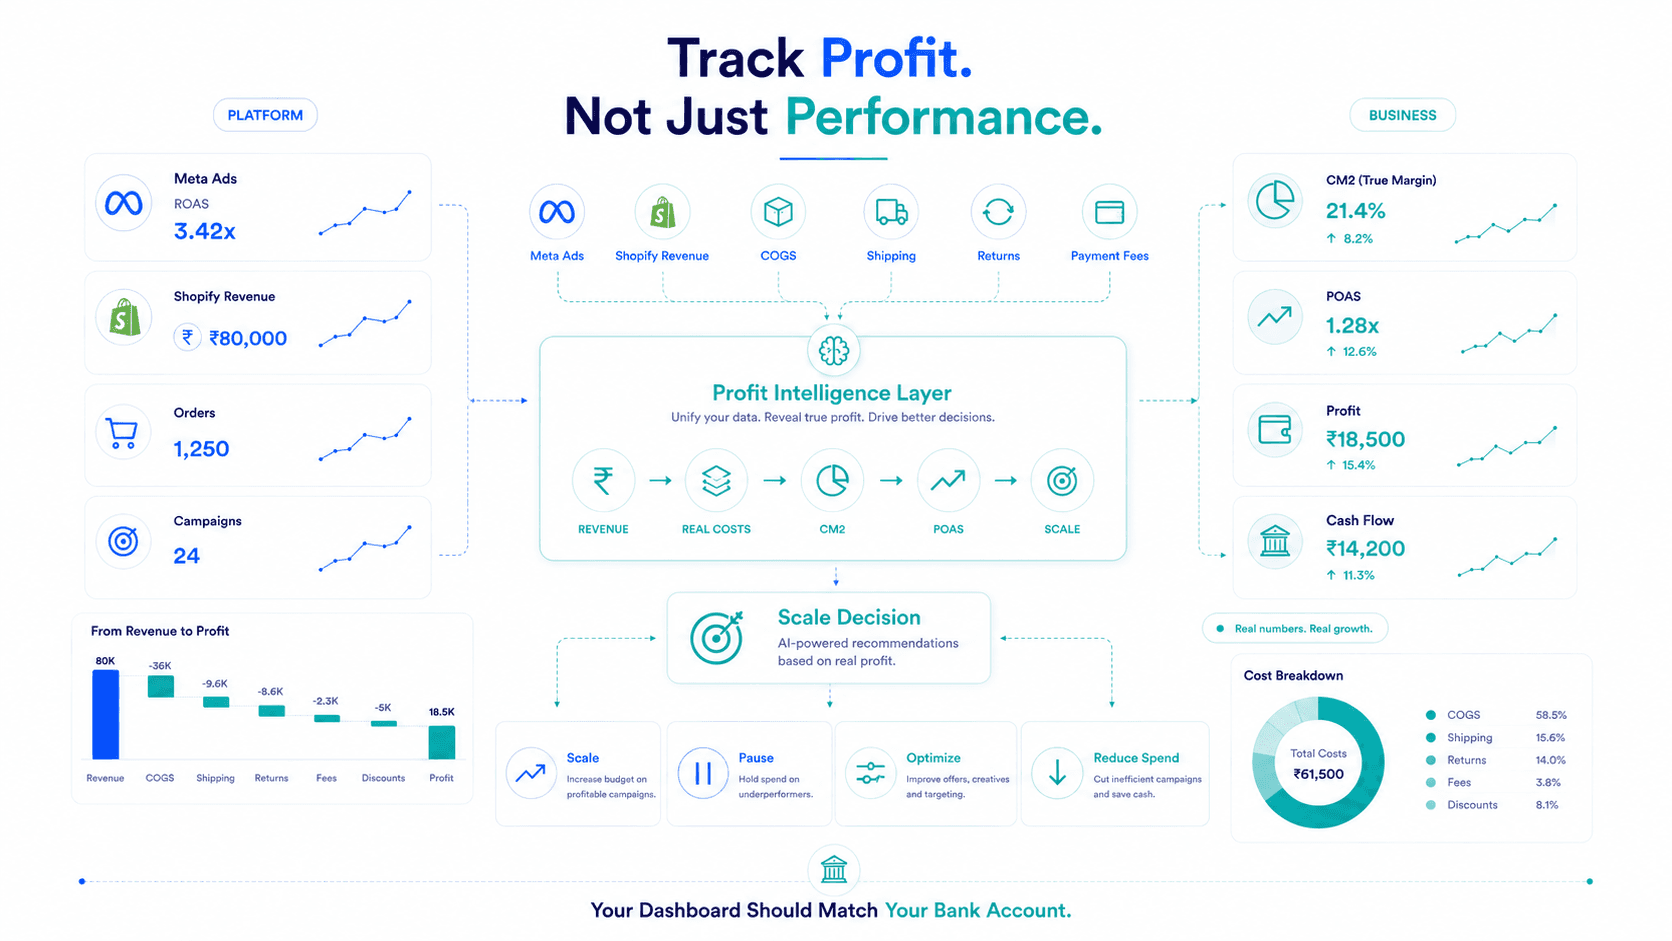
POAS (Profit on Ad Spend): Accounts for COGS and variable costs to show actual profit per ad dollar, exactly as demonstrated in the scenario above.
Contribution Margin (CM1/CM2): CM1 subtracts direct costs (COGS, payment fees, shipping) from revenue; CM2 further subtracts variable marketing costs, giving the clearest picture of whether a specific channel or campaign is actually contributing to the bottom line.
Used together, these three numbers explain almost every case of "ROAS looked great but cash didn't move."
Scaling budget based on ROAS alone, without confirming POAS or contribution margin is also positive.
Ignoring return rate by category. Apparel and footwear typically carry much higher return rates than beauty or consumables, and this dramatically changes real profitability even at identical ROAS.
Not accounting for payment processing tiers, especially for international or Buy Now Pay Later transactions, which often carry higher fees than standard card payments.
Treating discount-code revenue the same as full-price revenue in performance reporting.
Reviewing ad performance weekly but reconciling actual profit monthly —creating a lag where bad decisions compound before anyone notices.
Pull COGS per SKU (not category averages) into your reporting stack.
Layer in payment processing fees by actual gateway and region.
Include a rolling return-rate adjustment, not just point-of-sale revenue.
Calculate MER weekly, alongside platform ROAS, to catch attribution drift early.
Set a POAS floor (for example, 1.2x) as a scaling gate, no budget increase without clearing it.
Automate the data pipeline. Manually reconciling Shopify, Meta, and payment processor data in spreadsheets doesn't scale past a handful of SKUs, which is why AI-based profitability platforms have become common in this exact workflow.
Never present ROAS to leadership without a corresponding POAS or contribution margin figure alongside it.
Build return-rate assumptions into profitability models by product category, not as a flat blended number.
Reconcile actual bank cash flow against reported ad profitability at least monthly to catch drift early.
Treat attribution inflation as a known, expected distortion, cross-check platform ROAS against MER regularly rather than trusting it in isolation.
Make COGS updates a recurring operational habit, not a one-time setup task.
Key Takeaways
Frequently Asked Questions
Because ROAS only measures revenue against ad spend, it doesn't account for product cost, fees, shipping, discounts, or returns, all of which reduce actual profit.
Not inaccurate exactly, but incomplete, it's built to measure advertising performance, not overall business profitability, and it can also be affected by attribution inflation.
POAS (Profit on Ad Spend) is generally considered more accurate since it factors in cost of goods and variable costs.
Significantly, especially in apparel and footwear categories, where return rates can exceed 15–20% and reverse a large share of "won" revenue after the fact.
This usually indicates attribution overlap, Meta is claiming credit for some revenue that other channels also influenced or that would have occurred organically.
No, ROAS remains useful for campaign-level optimization. The mistake is using it as your only profitability indicator.
Weekly at minimum for fast-growing brands; monthly reconciliation alone often lets problems compound before they're caught.
Yes, at 2–3% per transaction, payment fees alone can be the difference between a marginally profitable and unprofitable POAS at scale.
Contribution margin (CM1/CM2) subtracts direct costs and then variable marketing costs from revenue, showing whether a channel or campaign is actually adding to the bottom line, the same underlying gap ROAS misses.
Software can't change your unit economics, but AI-driven profitability platforms can automate the reconciliation of COGS, fees, returns, and ad spend so the gap becomes visible in real time instead of at month-end. If you're still optimizing for ROAS alone, you're only seeing part of the picture. Platforms like Flable AI help D2C brands connect ad performance to actual profit — automatically reconciling COGS, fees, and returns against Meta Ads spend — so what's on your dashboard finally matches what's in your bank account.
Real contribution margin per campaign and channel. The number that tells you whether to scale.
Start Measuring Profitability →Setup in 48 hours · No credit card required · Backed by Microsoft & NVIDIA