Deep Dive
ROAS is the metric every D2C brand learns first. It’s also the metric that misleads more D2C founders than any other number in their business. Not because ROAS is wrong. Because it’s incomplete. Contribution margin is the number that fills that gap.

Contribution margin is what’s left from a sale after you subtract all the variable costs directly associated with that sale.
What’s left is the amount that "contributes" to covering your fixed costs (rent, salaries, tools) and ultimately to profit.
Revenue minus COGS and fulfillment costs. This tells you how much a product makes before any marketing spend.
CM1 minus all variable marketing costs (ad spend, agency fees, creative costs). This tells you how much a product makes after you've paid to acquire the customer.
CM2 is the number every D2C advertising decision should be anchored to. Not ROAS.
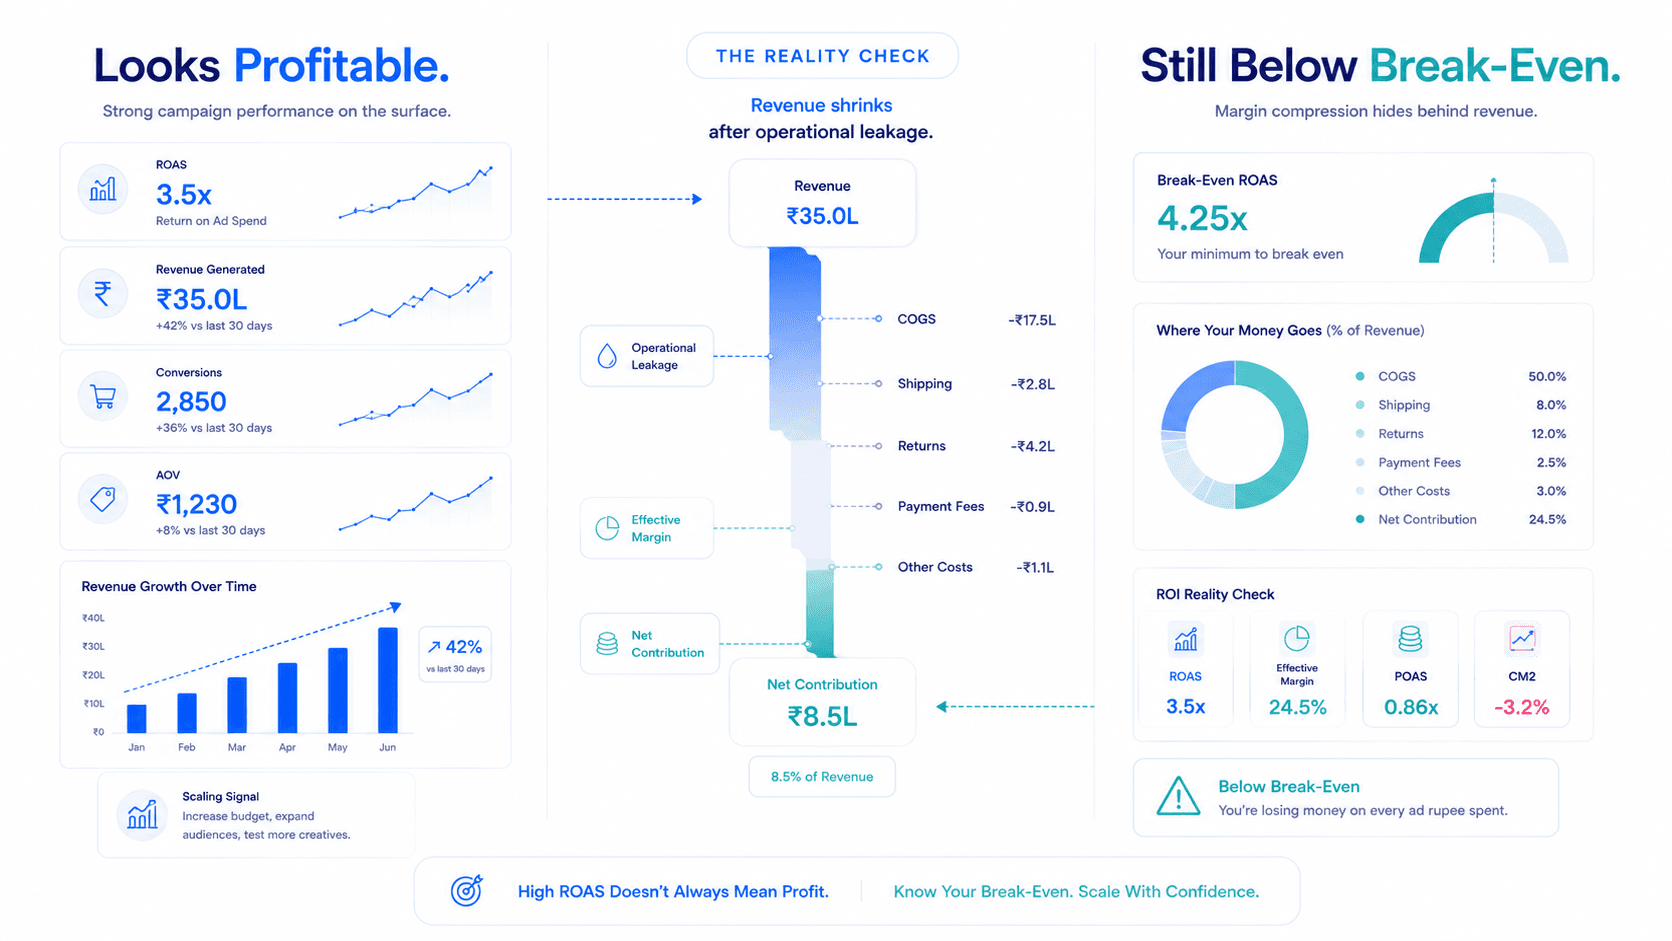
Standard ROAS thinking tells you to scale campaigns with the highest ROAS. But look at this real scenario:
| Metric | Campaign A (5x ROAS) | Campaign B (3x ROAS) |
|---|---|---|
| Revenue | ₹25L | ₹15L |
| COGS | ₹10L (40%) | ₹6L |
| Shipping | ₹2L | ₹1L |
| Returns | ₹5L (20%) | ₹45K (3%) |
| Ad Spend | ₹5L | ₹5L |
| CM2 | ₹3L (12%) | ₹2.55L (17%) |
Campaign A has a higher ROAS, but Campaign B is more profitable per rupee of revenue. Scale Campaign A based on ROAS and you’re growing revenue while squeezing margin. Scale Campaign B and you compound profitability.

A campaign with a 20% return rate is silently 20% less profitable than it appears. This is the biggest distortion in ROAS-based reporting.
A 4x ROAS on a product with 20% margin is very different from a 4x ROAS on a 60% margin product. The ad platform reports the same number.
Free shipping transfers cost to the business. On low-AOV products, shipping can consume 15–25% of revenue. ROAS sees none of this.
A campaign offering 30% off looks efficient on ROAS because the discount is absorbed before the revenue figure is calculated. You see a good ratio, but earn less.
CM2 per campaign =
+ (Orders × AOV)
- (Orders × Average COGS)
- (Orders × Average Shipping)
- (Returned Orders × AOV)
- Total Ad Spend
Done manually in a spreadsheet, this takes hours and breaks the moment data updates. Done automatically with Flable AI, it’s live updated in real time as orders come in and returns are processed.

There is no universal benchmark, but here are directional ranges for D2C brands:
Fashion / Apparel
15–30%
Beauty / Skincare
25–45%
Health / Supps
30–50%
Electronics
8–20%
Food / Beverage
20–35%
Home / Lifestyle
20–35%
If your CM2 is consistently below 15% and you have significant fixed costs, you likely don't have a profitable business — even if revenue is growing.
ROAS is not the enemy. It’s a useful signal. But it is not a profitability metric. Running a D2C brand on ROAS alone is like driving with only a speedometer and no fuel gauge.
Contribution margin is the fuel gauge. Know the difference. Measure the right thing. Scale what's actually profitable.
Frequently Asked Questions
ROAS benchmarks vary by category and margin structure. A 3x ROAS on a 60% gross margin product is excellent. A 5x ROAS on a 20% gross margin product with high returns might be unprofitable. The right question isn't 'what is our ROAS?' but 'what is our contribution margin at this ROAS?'
CM1 is revenue minus COGS and fulfillment costs. It shows product-level profitability before marketing. CM2 subtracts variable marketing costs (ad spend, agency fees) from CM1. CM2 is the metric that tells you whether acquiring a customer through a specific campaign was actually profitable.
Returns directly reduce contribution margin because they remove revenue while many variable costs (shipping, processing) are already spent. A campaign with a 20% return rate has a contribution margin approximately 20% lower than gross revenue suggests.
Yes, you can build a spreadsheet that pulls ad spend, revenue, COGS, returns, and shipping costs. The challenge is that it requires manual reconciliation across multiple data sources and becomes stale immediately. Flable automates this reconciliation in real time.
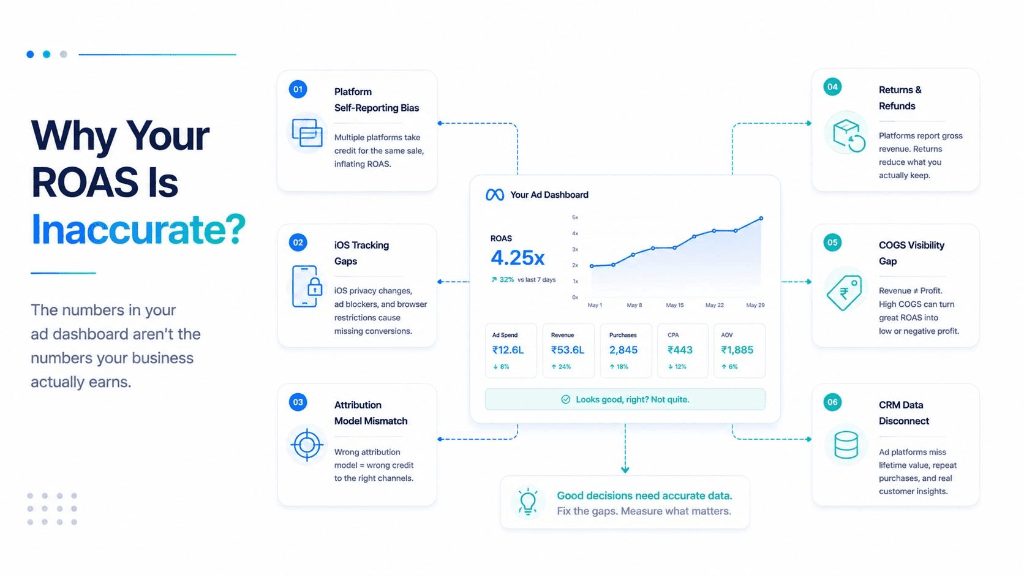
Ad platforms (Meta, Google) only have access to the data their pixel captures — clicks, conversions, and attributed revenue. They have no visibility into your COGS, return rates, or fulfillment costs. Contribution margin requires combining platform data with your operational data.
Real CM2 per campaign, per channel — live, automatic, no spreadsheets.
See Your Real Profitability →Setup in 48 hours · No credit card required · Backed by Microsoft & NVIDIA