Optimisation
ROAS vs POAS vs MER: Which Metric Should Actually Run Your D2C Business?
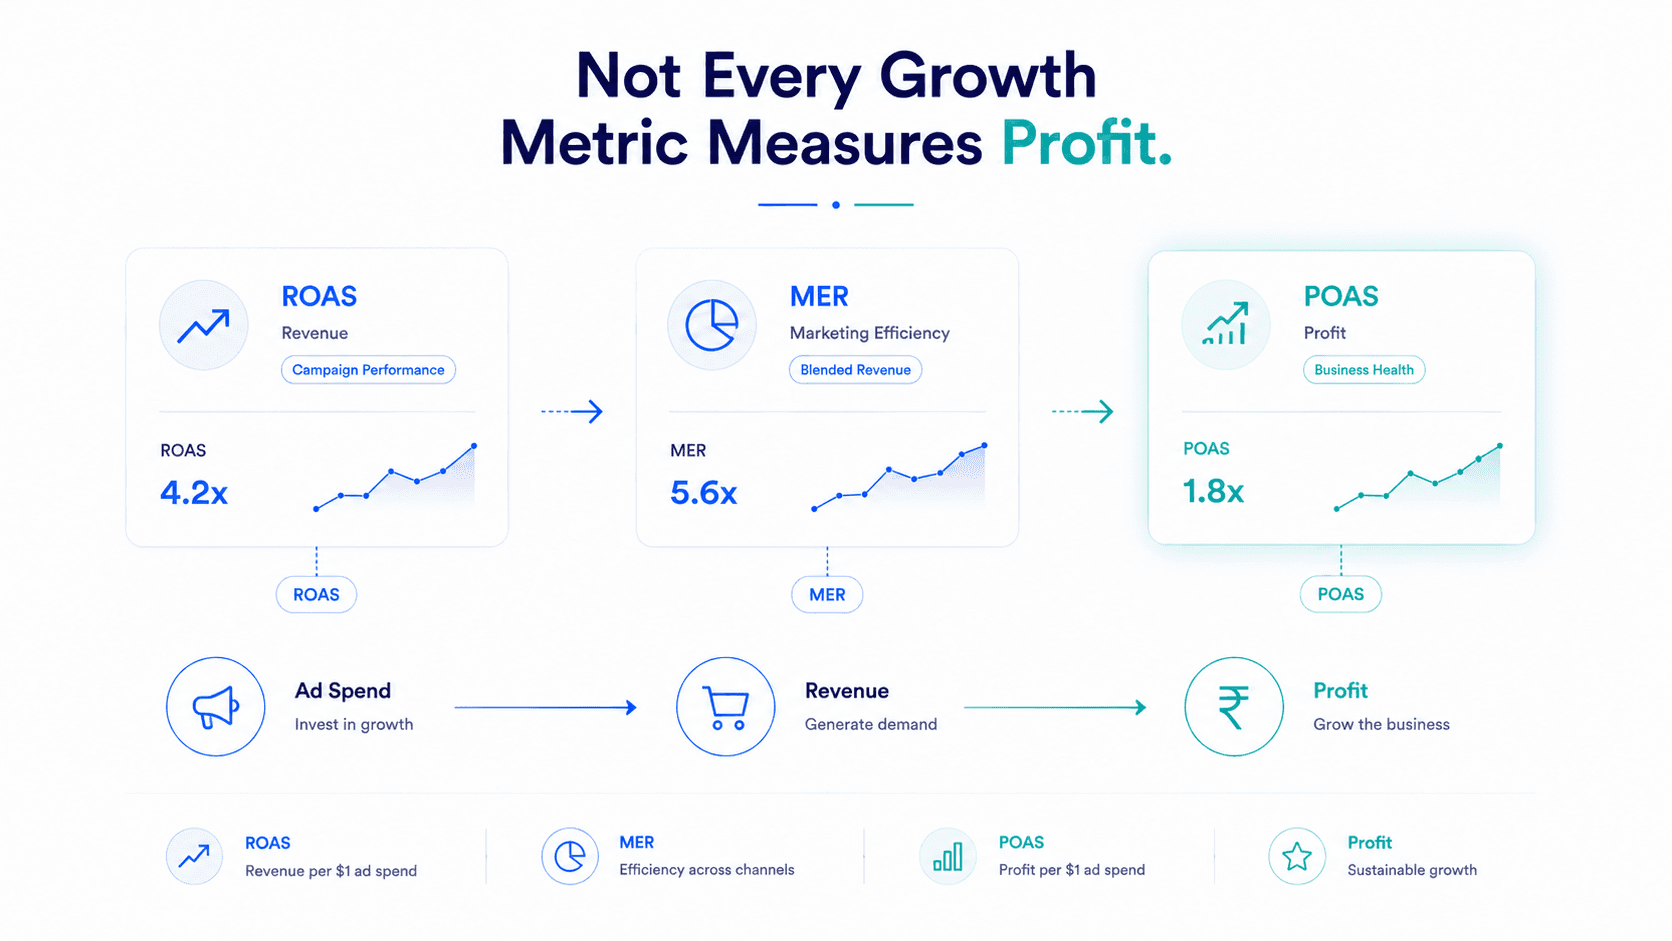
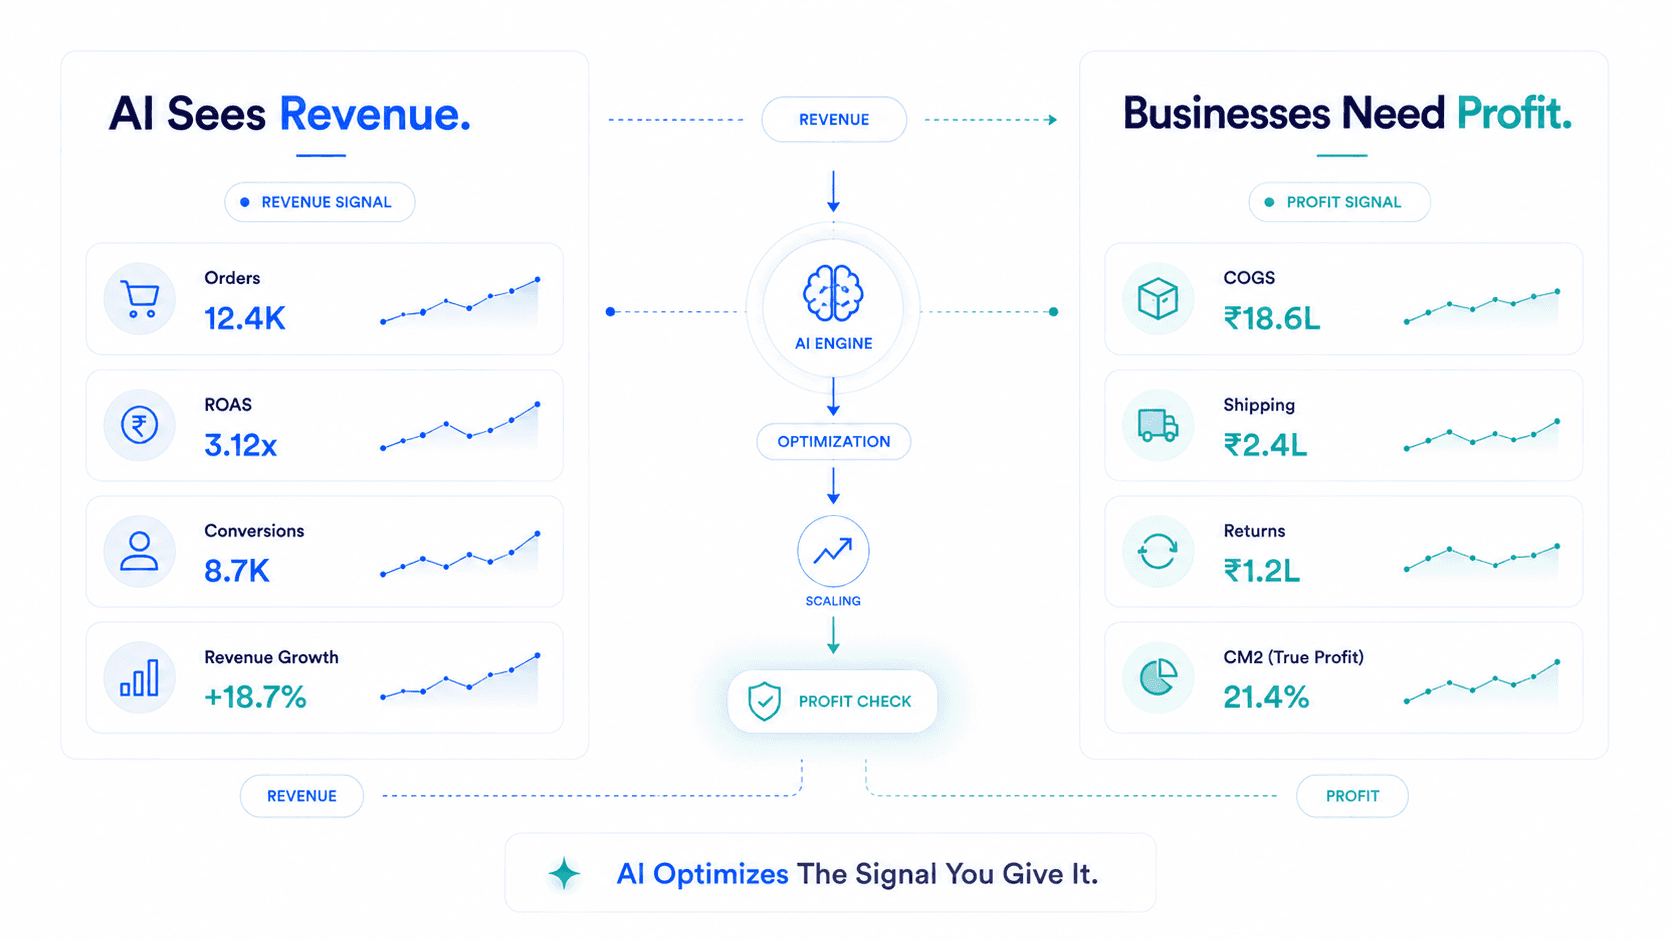
If you've ever presented a "4.2x ROAS" number in a founder meeting and gotten a blank stare followed by "okay, but are we actually making money?" you already understand the core problem with this metric debate. It's not that ROAS is wrong. It's that ROAS was never built to answer the question everyone is using it to answer.
Ecommerce brands are under more margin pressure than at any point in the last decade. Acquisition costs have risen sharply, average ecommerce customer acquisition cost climbed 40–60% between 2023 and 2025, with Shopify's 2026 Global Commerce Report putting the merchant-wide average CAC at $318, up 16.1% year over year. On the media cost side, Meta Ads CPMs have jumped roughly 18–20% year over year across most verticals in 2026, according to multiple industry benchmark reports including Triple Whale and Tinuiti.
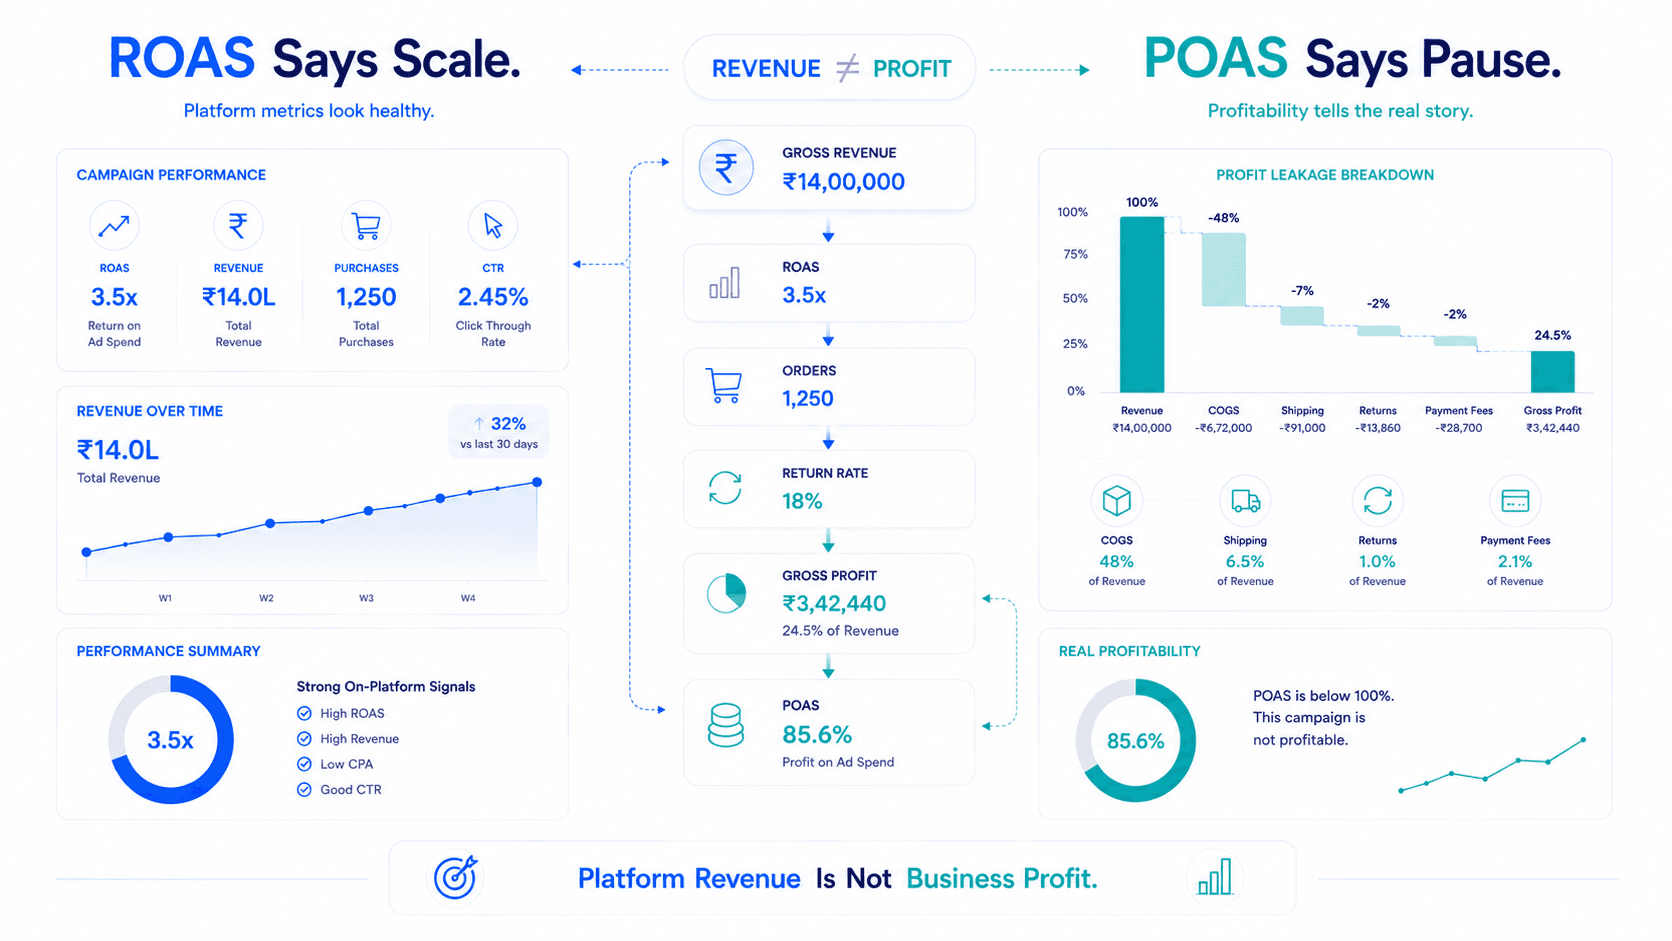
In that environment, a metric that only tells you "revenue went up" isn't enough. You need to know whether that revenue actually made you money after product cost, shipping, discounts, payment fees, and returns. That's exactly the gap between ROAS, MER, and POAS and why the difference between them has become one of the most searched, debated, and misunderstood topics in performance marketing.
This guide breaks down all three metrics in plain language, shows you how to calculate each one with real numbers, and more importantly, shows you when each metric will actively mislead you if you're not careful.
| Metric | What It Measures | Formula | Best Used For | Biggest Weakness |
|---|---|---|---|---|
| ROAS | Revenue per ad dollar (single channel) | Ad Revenue ÷ Ad Spend | Creative and campaign-level testing | Ignores COGS, ignores non-ad costs, prone to platform inflation |
| MER | Revenue per marketing dollar (blended) | Total Revenue ÷ Total Marketing Spend | Overall marketing efficiency, budget sanity checks | Still a revenue metric, hides channel-level detail |
| POAS | Profit per ad dollar | (Revenue − COGS − Variable Costs) ÷ Ad Spend | True profitability decisions, scaling decisions | Requires accurate cost and margin data |
For years, ROAS was the default scoreboard for paid media. It was easy to calculate, easy to explain to a founder, and easy to pull straight from Meta Ads Manager or Google Ads. The problem is that "easy" and "accurate" are not the same thing.
Three forces have converged to make the ROAS-only approach dangerous in 2026:
Rising acquisition costs. With CAC up 40–60% in two years, the same ROAS number today represents a very different profit outcome than it did in 2022.
Platform attribution drift. iOS privacy changes and cross-device shopping behavior mean in-platform ROAS is frequently inflated relative to what actually happened.
Margin compression. Rising freight, packaging, and payment processing costs mean the "cost" side of the profit equation has grown just as fast as the "revenue" side, and ROAS never accounts for it.
This is exactly why MER and POAS have moved from niche finance-team vocabulary into standard performance marketing conversation. They're not replacements for ROAS so much as corrections for what ROAS was never designed to measure.
Return on Ad Spend (ROAS) measures how much revenue you generate for every dollar spent on advertising.
Formula:
ROAS = Total Revenue from Ads ÷ Total Ad Spend
If you spend $10,000 on Meta Ads and generate $40,000 in attributed revenue, your ROAS is 4.0x.
ROAS is fast, granular, and platform-native. It lets media buyers compare creative variants, audiences, and campaigns in near real time. For top-of-funnel optimization and creative testing, it's still a genuinely useful diagnostic metric.
It ignores cost of goods sold (COGS). A 4x ROAS on a product with 70% margin is a very different business outcome than a 4x ROAS on a product with 25% margin.
It ignores non-ad costs. Shipping, packaging, payment processing fees, discounts, and returns never enter the equation.
It's frequently inflated by platform attribution. Meta and Google both tend to over-credit their own platforms in mixed-channel customer journeys, a phenomenon well documented by attribution researchers and platforms like Triple Whale and ProfitMetrics.
Marketing Efficiency Ratio (MER), sometimes called blended ROAS, measures total revenue against total marketing spend across every channel, not just one platform.
Formula:
MER = Total Revenue ÷ Total Marketing Spend (all channels)
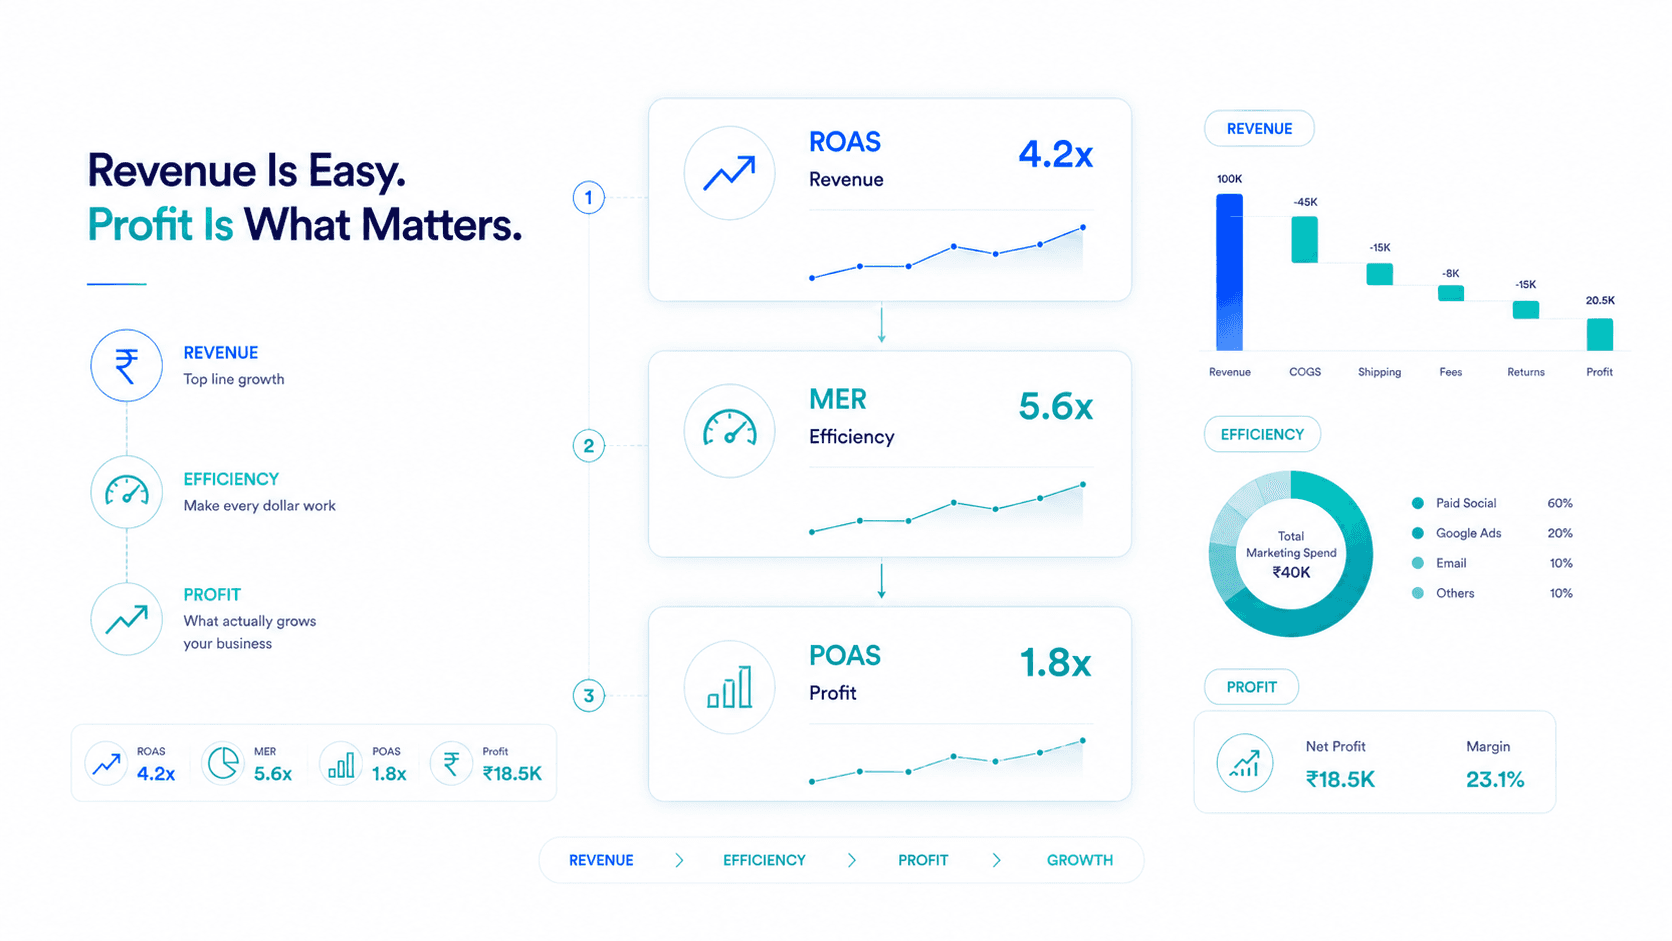
If your store did $200,000 in total revenue in a month and you spent $40,000 across Meta, Google, TikTok, and affiliate combined, your MER is 5.0x.
MER solves the attribution overlap problem. Instead of trusting each platform's self-reported numbers (which, added together, will almost always overstate total revenue), MER uses your actual store-wide revenue as the numerator. It's harder to game and much closer to reality.
MER is a fantastic sanity check for overall marketing spend efficiency, but it still shares ROAS's core weakness: it's a revenue metric, not a profit metric. A brand can have a beautiful 6x MER and still be losing money if margins are poor, discounting is aggressive, or fulfillment costs have crept up.
MER also makes it harder to diagnose channel-specific problems, since it deliberately blends everything together. It answers "is our overall marketing efficient?" not "which channel or campaign is actually working?"
Profit on Ad Spend (POAS) measures how much actual profit, not revenue, you generate for every dollar of ad spend, after accounting for product cost and other variable costs.
Formula:
POAS = (Revenue − COGS − Other Variable Costs) ÷ Ad Spend
Using the same $40,000 revenue example from earlier, if COGS and variable costs total $22,000, your profit is $18,000. Divided by the $10,000 ad spend, your POAS is 1.8x — a dramatically different (and more honest) number than the 4.0x ROAS.
POAS directly answers the question every founder actually cares about: for every rupee or dollar I put into Meta Ads, how much profit do I keep? It naturally accounts for:
This is also why POAS is the foundation of contribution margin thinking, the same logic behind CM1 and CM2 calculations that finance teams use to evaluate whether a business is fundamentally healthy.
POAS requires more data. You need accurate COGS per SKU, updated variable cost data, and a system that can tie ad spend to actual profit rather than platform-reported revenue. This is precisely the operational gap that AI-powered profitability platforms have emerged to close — pulling COGS, fees, and ad data together automatically instead of relying on manual spreadsheet reconciliation.
Consider a Shopify skincare brand running a $15,000 Meta Ads budget in a single month.
ROAS: $60,000 ÷ $15,000 = 4.0x — looks excellent.
MER: $95,000 ÷ $22,000 = 4.3x — still looks excellent.
POAS: Profit = $95,000 − (58% COGS = $55,100) − (8% discounts = $7,600) = $32,300. POAS = $32,300 ÷ $22,000 = 1.47x — still profitable, but a completely different story than the first two numbers suggested.
None of these numbers are "wrong." They're answering different questions. The danger is when a team only looks at the first two and assumes the business is healthier than it actually is.

Pull total revenue for the period from your store (not the ad platform).
Subtract COGS — product cost, packaging, and inbound freight.
Subtract payment processing fees (typically 2–3%).
Subtract shipping cost not covered by the customer.
Subtract discounts and promo codes applied.
What remains is your contribution profit.
Divide contribution profit by total ad spend for the same period.
Most brands attempting this manually in spreadsheets run into two problems: COGS data lives in Shopify or an inventory tool, ad spend lives in Meta and Google, and payment fee data lives in Stripe or Shopify Payments. Reconciling all three consistently, at scale, is where AI-driven profitability platforms have started to replace manual finance work.
Treating ROAS as a profitability metric. It was designed as a media efficiency metric, not a P&L metric.
Comparing ROAS across products with different margins. A 3x ROAS on a low-margin bundle can be worse than a 2x ROAS on a high-margin hero SKU.
Ignoring MER entirely and only watching platform ROAS. This leads teams to over-credit Meta or Google for revenue that would have happened anyway (branded search, email, direct traffic).
Calculating POAS without updating COGS regularly. Ingredient costs, freight rates, and packaging prices change, a POAS model built on stale cost data will quietly mislead you.
Not segmenting POAS by product or campaign. A blended POAS can mask the fact that one hero SKU is subsidizing several unprofitable ones.
The honest answer: all three, but not with equal weight.
ROAS belongs in the media buyer's daily dashboard it's a tactical, campaign-level diagnostic.
MER belongs in the weekly marketing review, it's a directional check on whether overall spend efficiency is trending up or down.
POAS belongs in the monthly leadership and board reporting, it's the number that actually reflects business health and should inform scaling decisions.
Founders and CMOs who report ROAS alone to their board are, in effect, reporting a metric that has no formal connection to the company's bank balance.
Use ROAS to optimize creative, audiences, and campaign structure in-platform.
Use MER as a weekly gut check against platform-reported ROAS to catch attribution inflation.
Use POAS as the ultimate gate before scaling budget, never increase spend on a campaign or SKU without confirming POAS is positive and stable.
Build a system (not a one-off spreadsheet) that pulls COGS, fees, and spend data automatically, since manual reconciliation breaks down as SKU count and channel count grow.
Segment POAS by product category, not just account-wide, since blended numbers hide underperformers.
Key Takeaways
Frequently Asked Questions
POAS isn't a replacement for ROAS, it answers a different question. ROAS is useful for campaign optimization; POAS is more accurate for understanding actual profitability.
It depends on margin structure, but many D2C brands target a POAS above 1.0x at minimum, with healthy brands often aiming for 1.5x–2.5x depending on category and overhead.
MER uses total revenue and total marketing spend across all channels, while ROAS typically measures a single platform's attributed revenue against its own spend.
Yes. If product margins are thin or non-ad costs (shipping, fees, discounts) are high, a strong ROAS can still coexist with a loss-making business.
This is typically due to attribution overlap, Meta often takes credit for conversions that were influenced by other channels, especially after iOS tracking changes.
Not necessarily, but accurately tracking COGS, fees, and spend across channels at scale is difficult in spreadsheets, which is why many brands adopt AI-based profitability platforms.
Yes, even at low spend levels, MER is a useful early-warning signal for attribution inflation before it becomes a larger problem at scale.
Ideally continuously, or at least weekly, since COGS, discounts, and ad costs all shift regularly.
Yes, MER and blended ROAS are generally used interchangeably in the industry.
Reporting ROAS as if it were a profitability metric, when it was only ever designed to measure revenue efficiency per ad dollar. If you're still optimizing for ROAS alone, you're only seeing part of the picture. Platforms like Flable AI help D2C brands understand what truly drives profitability — connecting POAS, CM1, and CM2 to real ad performance — so they can scale Meta Ads with confidence instead of guesswork.
Real contribution margin per campaign and channel. The number that tells you whether to scale.
Start Measuring Profitability →Setup in 48 hours · No credit card required · Backed by Microsoft & NVIDIA