Industry Report
Most D2C marketing glossaries cover the financial metrics: ROAS, POAS, CM2, CAC. The metrics that measure money.
> 40%
Reels 3s view rate
1.5% – 3.0%
Reels video format
Media Subsidies
Higher engagement drops CPM
Creative performance metrics measure something different: attention. And for D2C brands where the ad creative is responsible for 50–70% of campaign performance variance, attention is worth measuring precisely.
CTR, CVR, Hook Rate, Thumb-Stop Rate — these are the metrics that tell you whether your ads are earning the scroll-stop, the click, and the conversion. They sit upstream of every financial metric. Get them wrong and no amount of bidding strategy or audience targeting rescues the campaign.
This is the complete guide: what each creative metric measures, what good looks like by format, and how they connect to your financial performance downstream.
Always optimize for CTR (Link Click) rather than CTR (All). CTR (All) includes likes, comments, and profile visits that rarely lead to store purchases.
What it measures: The percentage of people who saw your ad and clicked on it.
Why it matters: CTR is the first conversion that happens in any ad — converting an impression into a click. A low CTR means your ad is being seen but not acted on. Either the creative isn't relevant to the audience, the hook isn't compelling enough, or the offer isn't interesting.
The two CTR metrics you need to distinguish:
CTR Benchmarks for D2C Meta Ads (2026):
| Format | Low | Average | Strong |
|---|---|---|---|
| Feed image | <0.8% | 0.8–1.5% | >1.5% |
| Feed video | <1.0% | 1.0–2.0% | >2.0% |
| Reels | <1.5% | 1.5–3.0% | >3.0% |
| Stories | <0.5% | 0.5–1.2% | >1.2% |
| Carousel | <0.8% | 0.8–1.6% | >1.6% |
CTR Benchmarks for Google Ads:
| Category | Low | Average | Strong |
|---|---|---|---|
| Brand keywords | <5% | 5–15% | >15% |
| Non-brand category keywords | <2% | 2–5% | >5% |
| Google Shopping | <0.5% | 0.5–1.5% | >1.5% |
What a low CTR tells you:
The audience is seeing the ad but not engaging. Before changing targeting or budget, change the creative — specifically, change the hook. The first 2–3 seconds (video) or first visual impression (static) is almost always the cause of low CTR, not body copy or CTA.
What high CTR + low CVR tells you:
People are clicking but not buying. The landing page isn't delivering on the ad's promise — expectation gap between ad and site. Or the audience is curious but not purchase-intent.
What it measures: The percentage of people who clicked your ad and then completed a purchase on your website.
Why it matters: CVR is where clicks become revenue. It combines the effect of your landing page quality, product price-value alignment, checkout friction, and audience purchase intent. A strong CTR is worthless if CVR is poor — you're paying for clicks that don't convert.
CVR Benchmarks for D2C Ecommerce (2026 by Audience Temperature):
| Audience Temperature | Low | Average | Strong |
|---|---|---|---|
| Cold (prospecting) | <1.0% | 1.0–2.5% | >2.5% |
| Warm (site visitors) | <2.5% | 2.5–5.0% | >5.0% |
| Hot (cart abandoners) | <5.0% | 5.0–12.0% | >12.0% |
What affects CVR:
What it measures: The percentage of people who watched at least the first 3 seconds of your video ad.
Why it matters: For Reels and video Feed ads, the hook is everything. Meta's algorithm measures watch time as an engagement signal — ads that earn longer watch times get better placement at lower CPMs. Hook Rate is the first indicator of whether your creative is earning attention at all.
A video ad with a poor hook can have excellent messaging in the body and nobody will see it. If 96% of your audience scrolls past in the first 2 seconds, the quality of seconds 3–30 is irrelevant.
Hook Rate Diagnostic Table:
| Hook Rate | Diagnosis |
|---|---|
| Below 20% | Poor hook — opening isn't stopping the scroll. Test new first-frame concepts. |
| 20–35% | Average — some audience engages but majority scroll past. |
| 35–55% | Good — hook is earning attention from a meaningful portion. |
| Above 55% | Strong — hook is working. Study it and brief similar concepts. |
What makes a strong D2C video hook:
Thumb-Stop Rate: 3-Second Views ÷ Impressions. Treat as equivalent to Hook Rate in practical D2C workflows.
VTR / Video Completion Rate: Complete Video Views ÷ Total Impressions × 100. Measures whether your video holds attention to the end.
VTR Benchmarks for D2C (15–30 Second Videos):
| VTR | Diagnosis |
|---|---|
| Below 10% | Most viewers drop before completion — pacing or content issue after hook. |
| 10–20% | Average — typical for informational or product-focused content. |
| 20–35% | Good — storytelling is working, audience stays engaged. |
| Above 35% | Strong — narrative is compelling end-to-end. |
What it measures: How much it costs to reach 1,000 people with your ad.
Why it matters for D2C creative decisions: CPM is not purely a bidding metric — it's also a creative quality signal. Meta's algorithm charges lower CPMs for ads that generate strong engagement (high CTR, high Hook Rate, strong watch time). An ad with excellent creative quality reaches more people for the same spend.
Creative that earns high engagement effectively subsidises your own media cost. Brands with systematically better creative run at lower CPMs than competitors in the same auctions — creating a compounding efficiency advantage.
CPM Benchmarks for Indian D2C Meta Ads (2026):
| Category | Average CPM | Context |
|---|---|---|
| Apparel / Fashion | ₹150–300 | Competitive category, higher CPMs |
| Beauty / Skincare | ₹120–250 | Moderately competitive |
| Health / Supplements | ₹100–200 | Slightly less competitive |
| Food & Beverage | ₹90–180 | Lower competition, lower CPMs |
| Home / Lifestyle | ₹100–220 | Seasonal spikes during festivals |
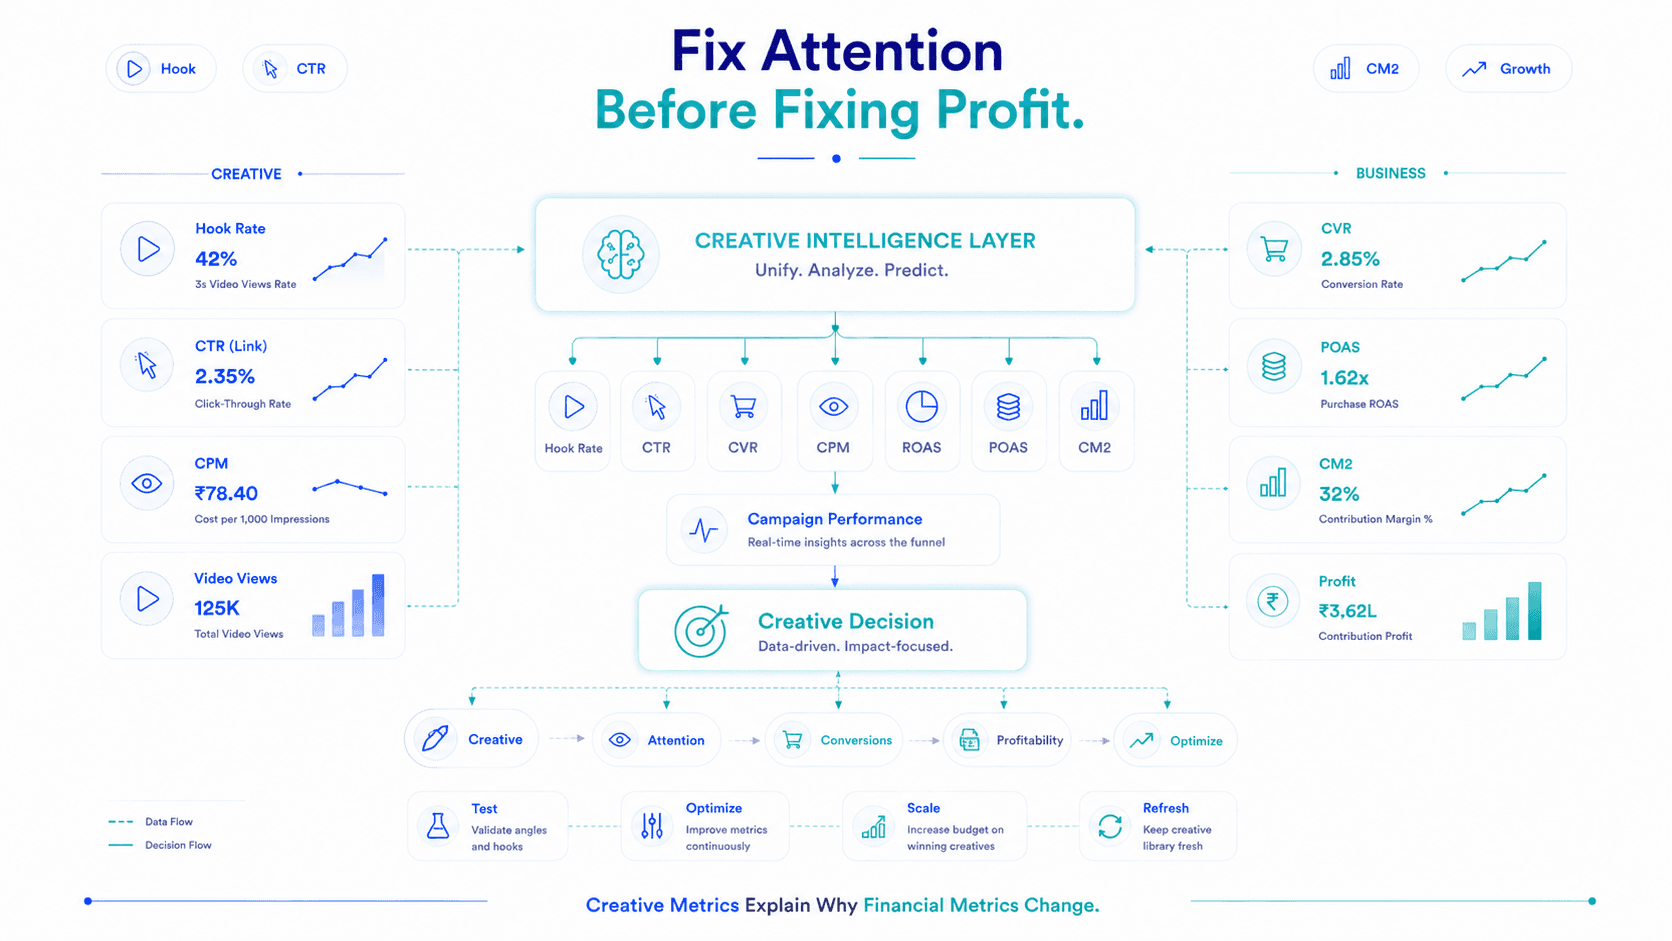
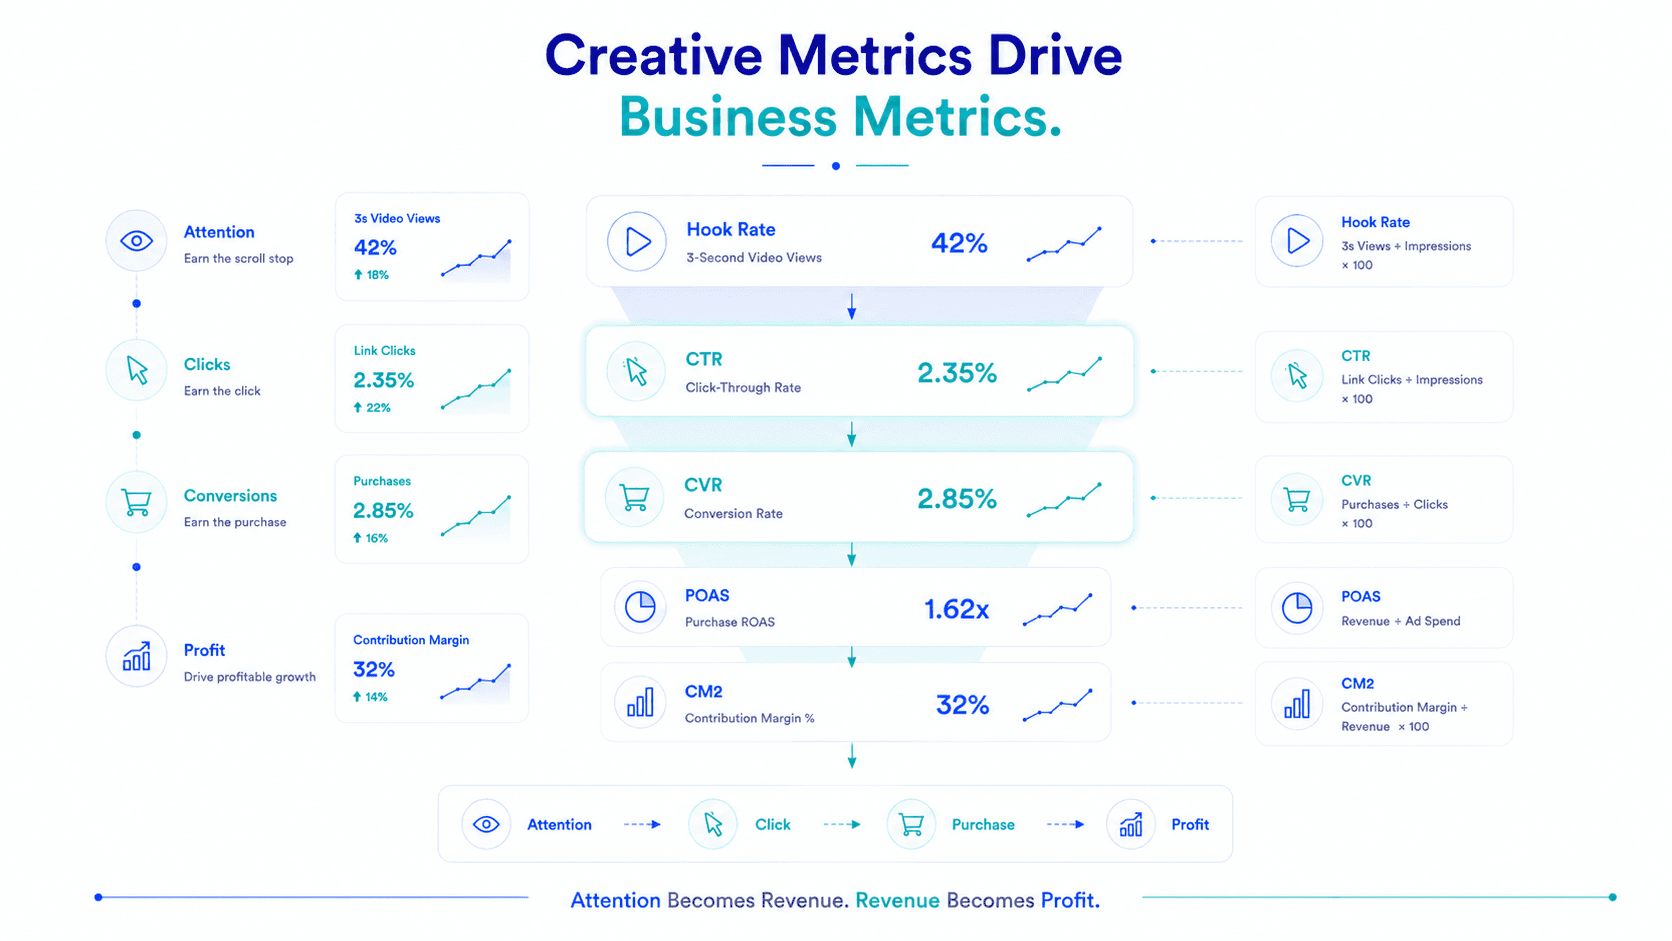
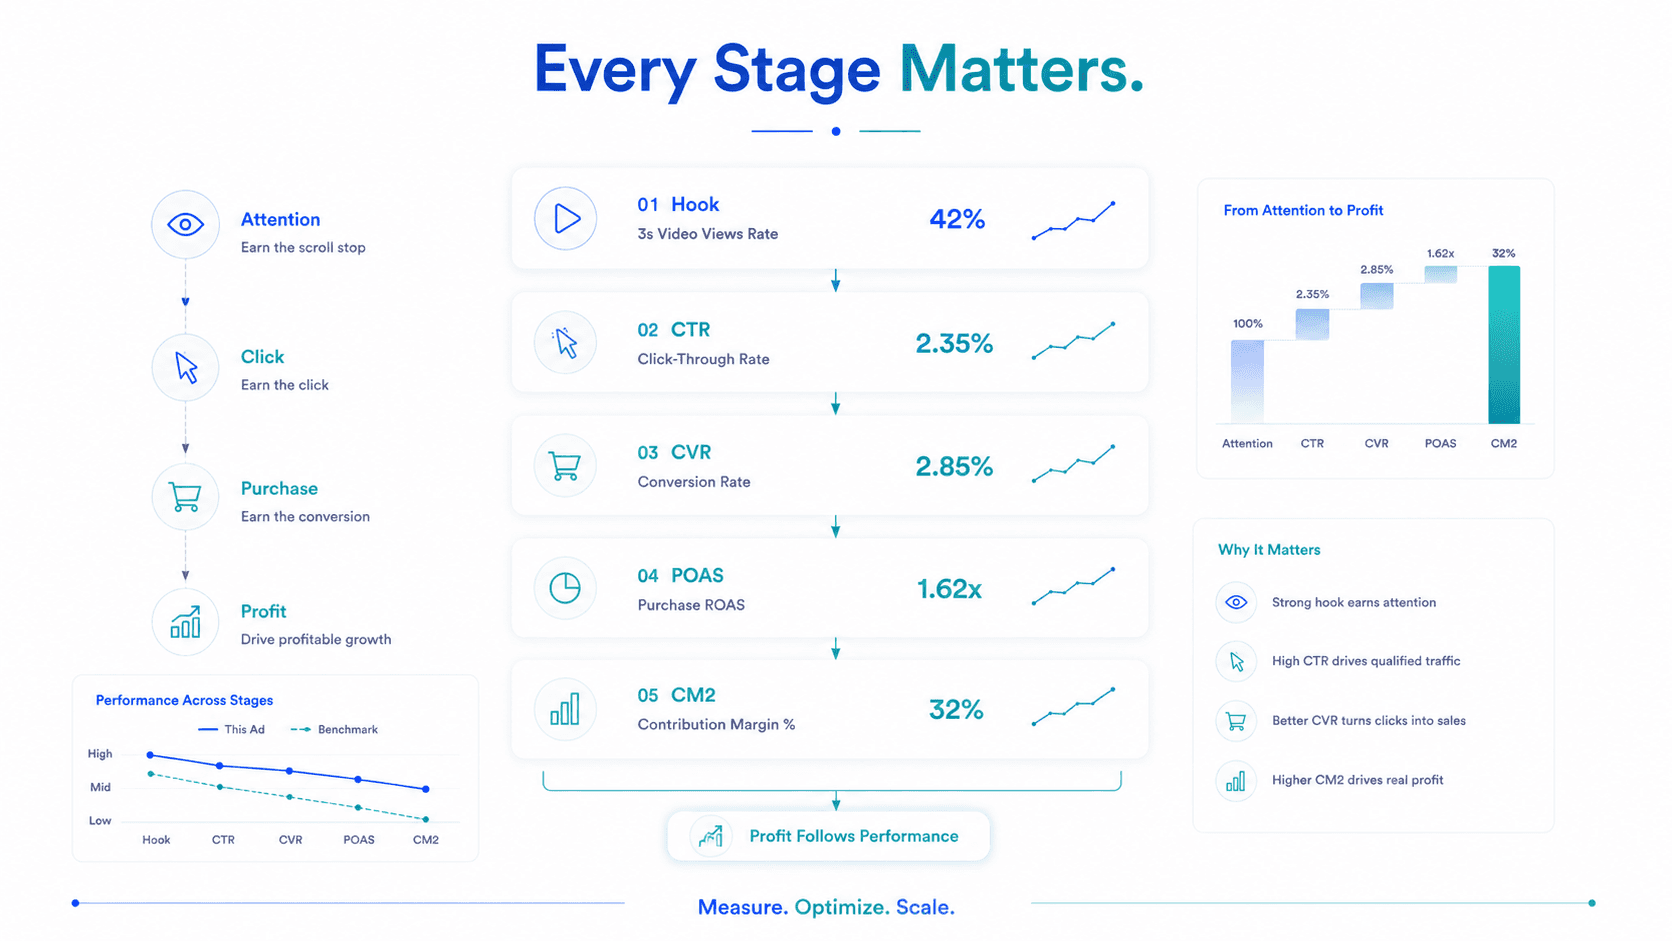
These metrics connect sequentially — each one determines how much audience passes through to the next stage:
Impressions (total audience reached)
↓ Hook Rate / Thumb-Stop Rate (% who watched 3+ seconds)
↓ View-Through Rate (% who watched to completion)
↓ CTR — Link (% who clicked through to site)
↓ CVR (% of site visitors who purchased)
↓ POAS / CM2 (was the resulting purchase profitable?)
A problem at any stage affects everything downstream. Low Hook Rate → low CTR → low CVR → poor POAS, even if the offer and audience are correct. This is why diagnosing creative performance requires working through the funnel from top to bottom.
| Metric | Below Average | Average | Strong |
|---|---|---|---|
| Hook Rate (Reels) | <20% | 20–40% | >40% |
| VTR (15–30 sec video) | <10% | 10–20% | >20% |
| CTR — Link (Feed image) | <0.8% | 0.8–1.5% | >1.5% |
| CTR — Link (Reels) | <1.5% | 1.5–3.0% | >3.0% |
| CVR (cold audience) | <1.0% | 1.0–2.5% | >2.5% |
| CVR (cart abandoners) | <5.0% | 5.0–12.0% | >12.0% |
| CPM (fashion, India) | >₹300 | ₹150–300 | <₹150 |
Creative metrics and financial metrics are not separate conversations. They're the same conversation at different stages of the funnel.
A campaign with strong creative metrics (45% Hook Rate, 1.8% CTR, 2.2% CVR) but poor financial metrics (POAS 0.8x) usually has a product economics problem — margins too thin, returns too high, or CAC floor too high for the product to ever be profitable at realistic creative performance.
A campaign with poor creative metrics (18% Hook Rate, 0.6% CTR, 0.9% CVR) but adequate product economics usually has a creative problem — the offer is right but the execution isn't earning attention or trust.
Diagnosing which type of problem you have is the first step to fixing it. Creative metrics tell you where the funnel is leaking. Financial metrics tell you whether fixing the leak is worth the margin that remains.
CTR, CVR, Hook Rate, and CPM are not vanity metrics. They're the diagnostic layer that explains why your campaigns perform the way they do before the financial metrics can tell you whether they're profitable.
Track them by format, not just by campaign. A Reel's CTR benchmarks are different from a Feed image's. A cold audience CVR benchmark is different from a cart abandoner's. Use the right benchmark for the right context.
And connect them downstream: Hook Rate → CTR → CVR → POAS. Every step in that chain either earns the next conversion or loses the audience. Know where your creative is losing attention, and brief the fix accordingly.
The creative metrics tell you the problem. The financial metrics tell you whether solving it is worth the investment.
Key Takeaways
Frequently Asked Questions
Hook Rate = 3-Second Video Views ÷ Total Impressions. It measures the percentage of people who watched at least the first 3 seconds of a video ad — indicating whether the opening creative stopped the scroll. A Hook Rate above 40% is strong for Reels; below 20% indicates the hook needs significant improvement.
For Link CTR specifically: Feed images should target 0.8–1.5%, with above 1.5% being strong. Reels typically achieve higher CTR (1.5–3.0%) due to format engagement. Note that CTR (All) includes engagement clicks — always use CTR (Link) for performance assessment.
CTR (Click-Through Rate) measures clicks ÷ impressions — how many people clicked the ad. CVR (Conversion Rate) measures purchases ÷ clicks — how many clickers completed a purchase. Both are required: high CTR with low CVR means clicks aren't converting (landing page issue). High CVR with low CTR means fewer people click to begin with (creative hook issue).
CPM (Cost Per Mille) = (Spend ÷ Impressions) × 1,000. It measures the cost to reach 1,000 people. It matters for creative because Meta charges lower CPMs for ads that generate strong engagement — meaning high-quality creative effectively subsidises its own media cost. For D2C brands in India, average Meta CPMs range from ₹90–300 depending on category.
Creative metrics explain funnel efficiency — Hook Rate drives CTR, CTR drives CVR, CVR drives order volume, order volume generates revenue. POAS and CM2 measure whether that revenue was profitable. A campaign can have excellent creative metrics but poor POAS if product margins are thin or return rates are high.
CTR, CVR, POAS, CM2 connected, automatic.
Book a Live Demo →Setup in 48 hours · No credit card required · Backed by Microsoft & NVIDIA