Metric Guide
Here is a question most D2C founders cannot answer without pulling up a spreadsheet:
What is your break-even ROAS?
Not your target ROAS. Not your benchmark ROAS. The specific ROAS below which every campaign you run is losing money, regardless of how the platform reports it.
Most brands don’t know this number. They have a target ROAS handed to them by an agency (“we aim for 3.5x in your category”) or reverse-engineered from a feel for what “performing” looks like. But they’ve never calculated the floor, the minimum ROAS below which the math doesn’t work.
Not knowing your break-even ROAS means you’re running campaigns without knowing whether they’re profitable. Here’s how to calculate it correctly.
Break-even ROAS is the minimum Return on Ad Spend at which a campaign covers all variable costs associated with acquiring and fulfilling customer orders, not generating profit, but not generating losses either.
Below break-even
Every order produced by the campaign costs more in variable costs than it generates in gross profit.
Above break-even
The campaign is covering variable costs and generating gross profit. Whether it’s enough to cover fixed costs and generate net profit depends on how far above break-even it sits.
The commonly taught formula
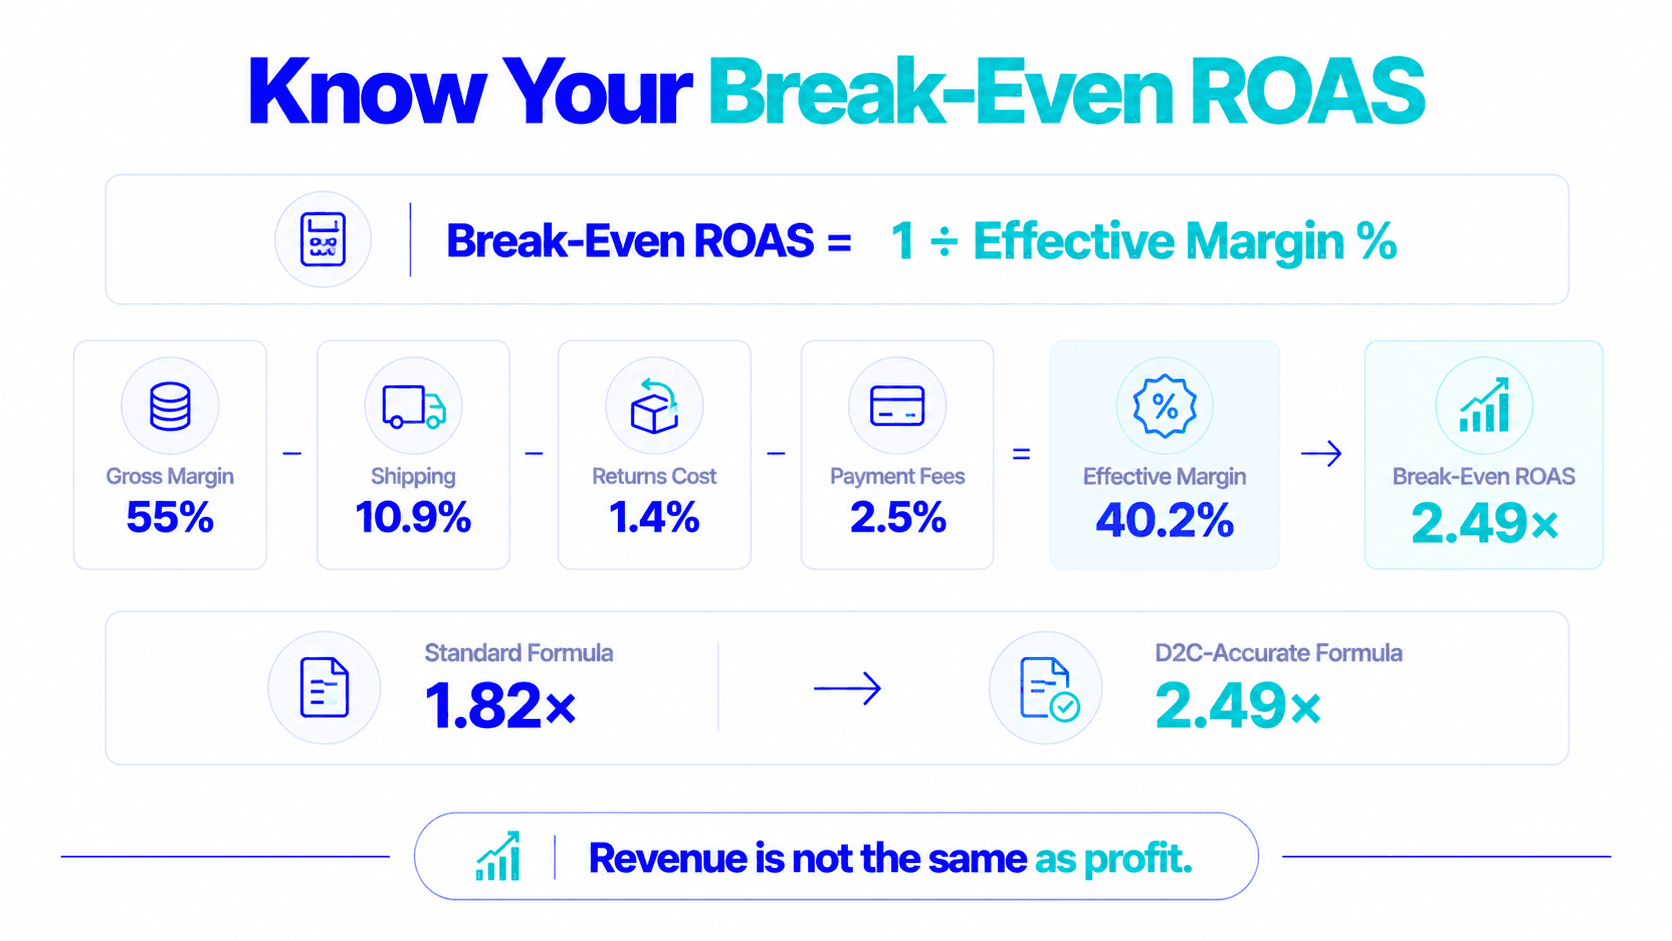
Break-even ROAS = 1 ÷ Gross Margin %
Example: A skincare brand with 55% gross margin. Break-even ROAS = 1 ÷ 0.55 = 1.82x
At 1.82x ROAS, gross profit exactly equals ad spend. Every rupee of ad spend returns 1.82 rupees of revenue, and 55% of that (the gross margin) exactly covers the rupee of ad spend.
This formula is correct, but for D2C brands it’s significantly incomplete.
D2C brands have variable costs beyond COGS that the standard formula ignores. The complete version:
D2C break-even ROAS
Break-even ROAS = 1 ÷ Effective Margin %
Let’s build this properly for the same skincare brand:
Gross Margin: 55%
Gross Margin = (Net Revenue − COGS) ÷ Net Revenue.
Shipping as % of Revenue: 10.9%
Average outbound shipping ₹120 ÷ average selling price ₹1,100.
Returns Cost as % of Revenue: 1.4%
Return rate 14%. Average return processing cost per return ₹110 (reverse logistics + restocking). (0.14 × ₹110) ÷ ₹1,100 = 1.4%. Revenue lost on refunds is already in the net revenue calculation, so only the processing cost is deducted here.
Payment Processing: 2.5%
2.5% of net revenue.
Effective margin for the skincare brand
1.82x
Gross margin only
2.49x
Effective margin
0.67x
Where losses accumulate
That 0.67x gap is the range in which campaigns appear profitable on the standard formula but are actually loss-making. It’s the range where most D2C brand losses accumulate invisibly.
These are estimated ranges based on typical category margins, shipping costs, return rates, and payment fees:
| Category | Gross margin | Return rate | Estimated break-even ROAS |
|---|---|---|---|
| Beauty / Skincare | 55–70% | 8–15% | 2.0–2.8x |
| Health / Supplements | 60–75% | 5–10% | 1.7–2.3x |
| Apparel / Fashion | 45–60% | 15–25% | 2.5–3.5x |
| Food & Beverage | 35–50% | 3–8% | 2.5–3.5x |
| Home / Lifestyle | 45–60% | 10–18% | 2.2–3.0x |
| Electronics | 25–40% | 10–20% | 3.5–5.5x |
Fashion combines moderate margins with high return rates, both of which compress effective margin. Electronics combines thin margins with significant return rates, meaning any paid advertising requires very high ROAS just to cover variable costs.
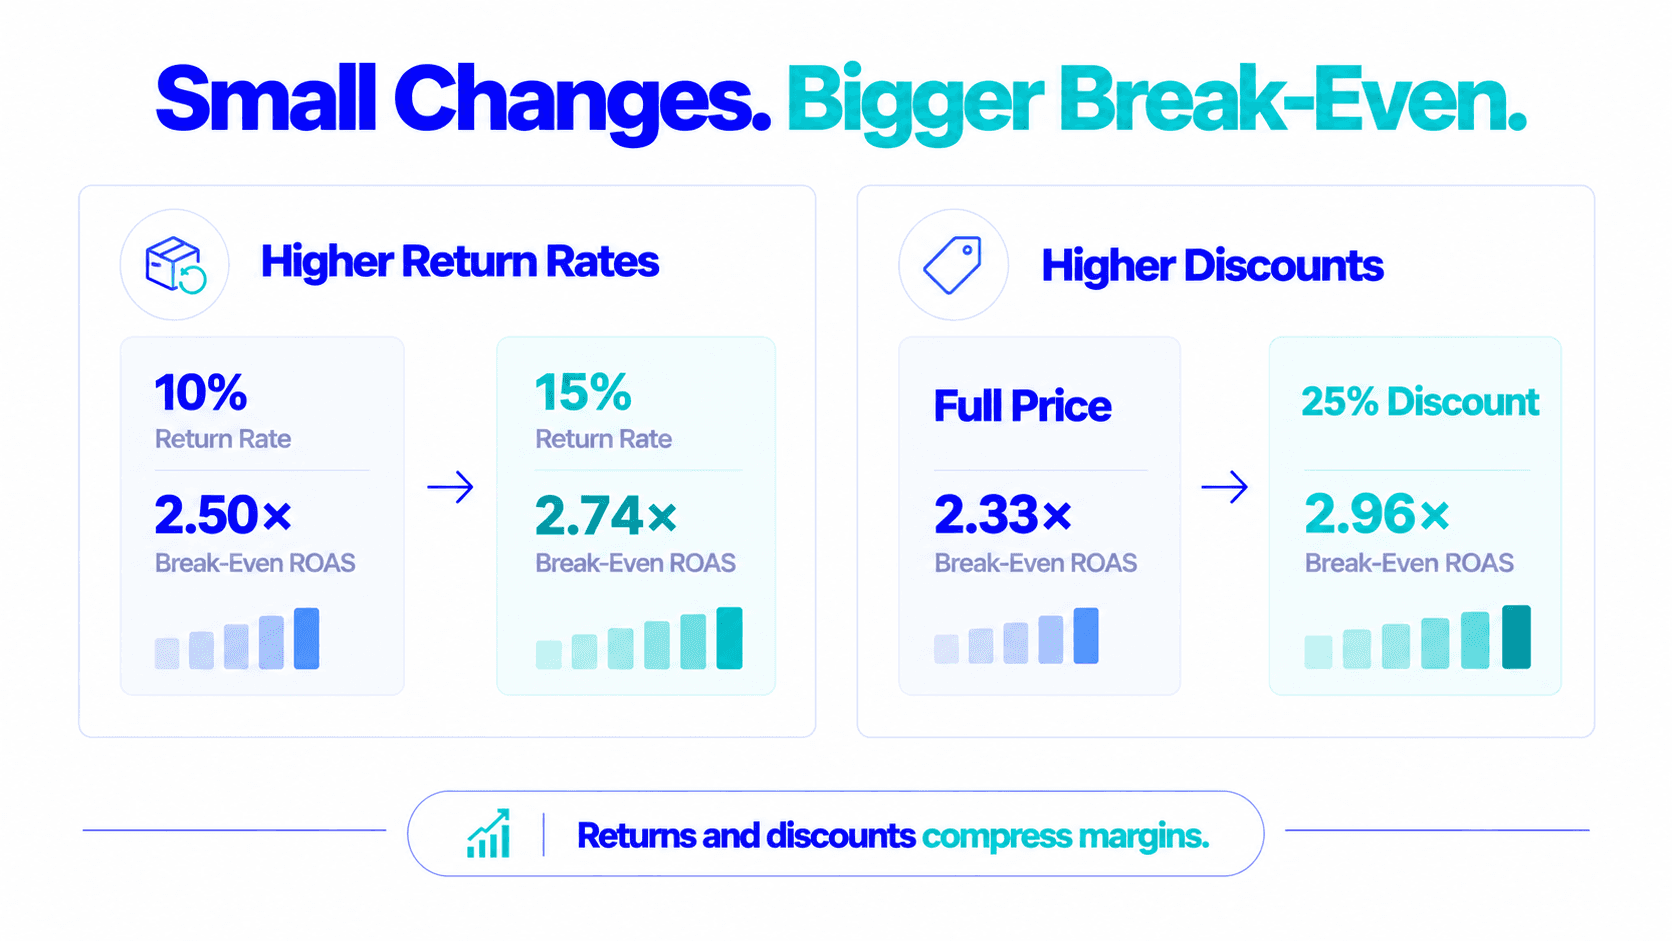
This is the calculation most brands never run, and the most important one. Return rates directly compress effective margin by:
10% return rate
15% return rate (5pp higher)
A 5-point return rate increase shifts break-even by 0.24x. For a brand spending ₹10L/month running at 2.6x ROAS, which looked profitable at 2.50x break-even, this return rate shift just pushed the campaign below break-even.
This happens invisibly. The Ads Manager ROAS stays at 2.6x. Returns happen 7–14 days after attribution. Nobody notices until the monthly review.
Running a 25% off promotion? Your break-even ROAS just jumped, significantly.
| Full price | 25% off | |
|---|---|---|
| Selling price | ₹1,500 | ₹1,125 |
| COGS | ₹540 | ₹540 |
| Gross margin | 64% | 52% |
| Shipping (₹120) | 8.0% | 10.7% |
| Return bump (promo periods run 5–8pp higher) | — | 5% |
| Payment fees | 2.5% | 2.5% |
| Effective margin | ~43% | ≈ 33.8% |
| Break-even ROAS | 2.33x | 2.96x |
Running a 25% off campaign requires 27% higher ROAS just to break even, during a period when CPMs are likely elevated (more competition during sale periods) and return rates are higher (promotional buyers).
Calculate your break-even ROAS at every planned discount depth before launching any promotional campaign.
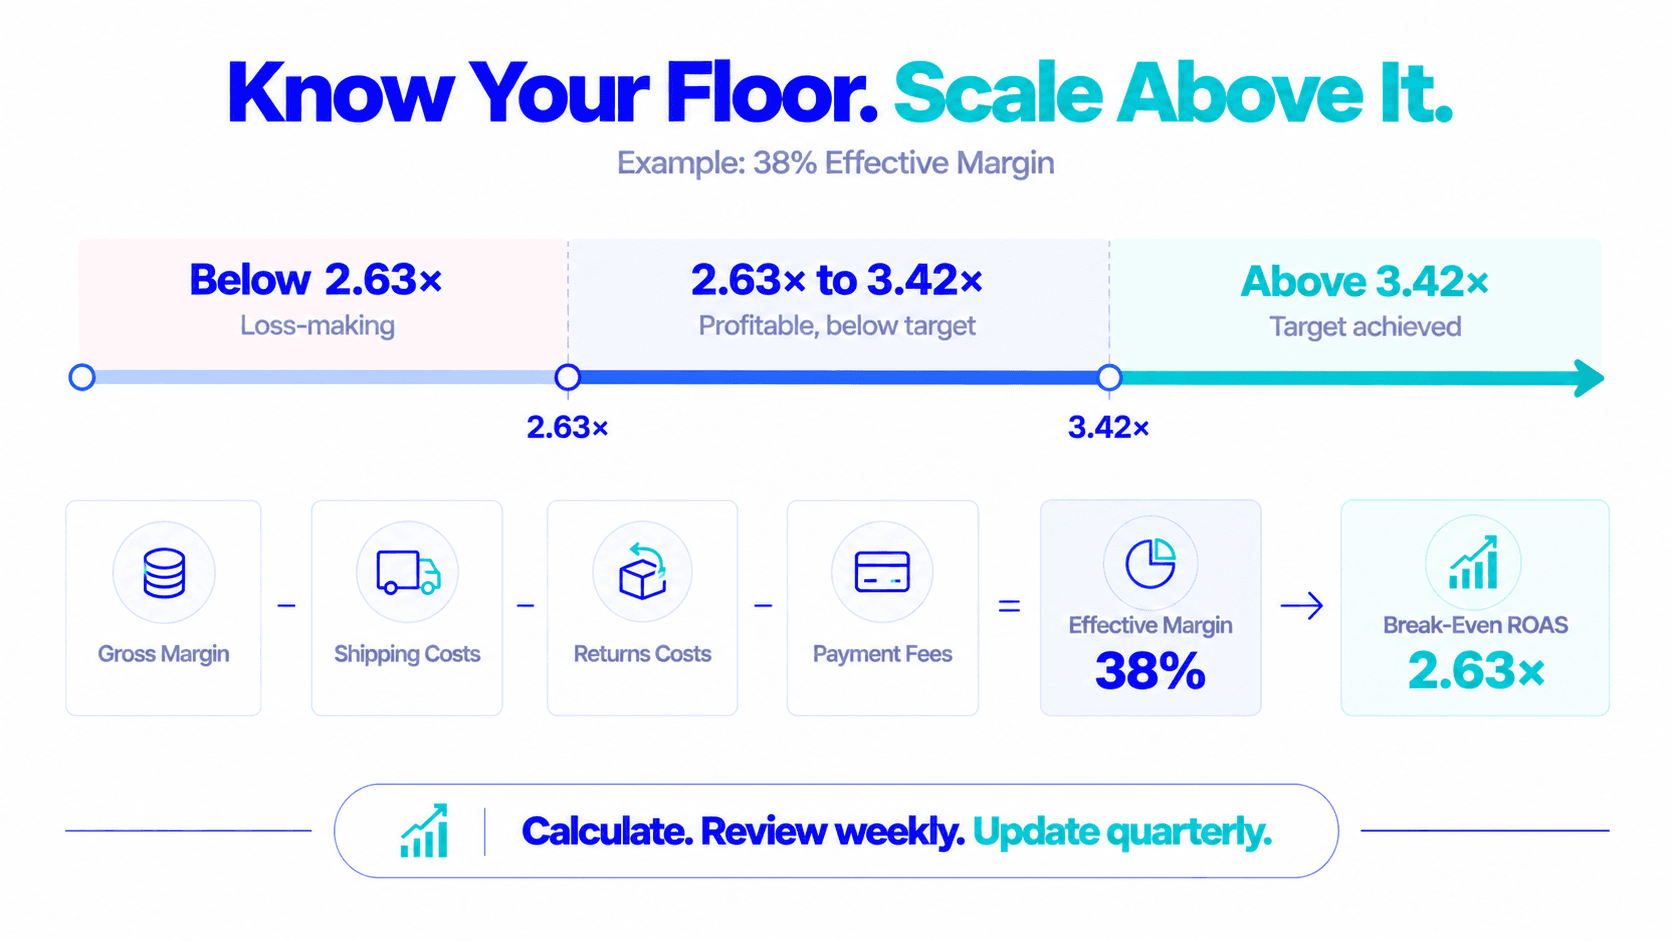
Break-even ROAS
The minimum. Below this = loss-making.
Target ROAS
The ROAS that produces your desired POAS margin.
Target ROAS
Target ROAS = POAS Target ÷ Effective Margin %
38% effective margin
Losing
Money-losing
Below target
Profitable but below target
On target
Target achieved
Set your platform’s tROAS bid strategy at your target (3.42x), not your break-even. Setting tROAS at break-even tells the algorithm it can accept zero-margin conversions.
Before you can calculate your real break-even ROAS, you need four numbers:
Gross Margin % per product or category
(Net Revenue − COGS) ÷ Net Revenue. Update quarterly, changes with production run sizes and COGS inflation.
Shipping cost as % of average selling price
Average shipping cost ÷ Average selling price. Varies by product weight and logistics partner.
Return cost as % of revenue
(Return rate × average return processing cost) ÷ Average selling price. Varies significantly by campaign type and audience.
Payment processing rate
Typically 2–2.5% for Razorpay/Stripe/PayU.
Add all four variable deductions to get Effective Margin. Divide 1 by Effective Margin to get break-even ROAS.
This takes 10 minutes. Do it once. Update it quarterly and whenever you change pricing, returns policies, or logistics partners.
You continue scaling campaigns that are below break-even.
Every campaign that runs below break-even ROAS burns money, slowly or quickly depending on the gap. The amount burned accelerates with scale.
| Monthly ad spend | Loss at 15 paise per rupee |
|---|---|
| ₹2L | ₹30,000/month |
| ₹8L | ₹1,20,000/month |
The platform ROAS never tells you this. The agency report never shows it. The weekly dashboard doesn’t surface it.
The only way to know is to calculate break-even ROAS from your actual product economics, and check every active campaign against it weekly.
Break-even ROAS isn’t a benchmark from a blog post. It’s a number calculated from your specific product margins, shipping costs, return rates, and payment fees.
Calculate it. Update it when your economics change. Use it as the floor in every campaign decision, below this ROAS, the campaign is losing money. Full stop.
Know your floor. Then set targets above it. Scale what clears both.
Break-even ROAS is the minimum Return on Ad Spend at which a campaign covers all variable costs without losing money. Basic formula: 1 ÷ Gross Margin %. D2C-accurate formula: 1 ÷ Effective Margin %, where Effective Margin = Gross Margin − Shipping % − Returns Cost % − Payment %.
Step 1: Calculate gross margin (net revenue − COGS) ÷ net revenue. Step 2: Subtract shipping as % of revenue. Step 3: Subtract returns cost as % of revenue. Step 4: Subtract payment processing %. Step 5: Divide 1 by the resulting effective margin. This gives your true D2C break-even ROAS.
Discounts reduce your selling price while COGS stays fixed, compressing gross margin. Shipping costs become a higher % of the discounted price. Promotional return rates are typically 5–8 percentage points higher than full-price return rates. All three factors reduce effective margin, raising the ROAS needed to break even.
No. Set tROAS at your target ROAS (POAS Target ÷ Effective Margin %), not at break-even. Setting tROAS at break-even tells the algorithm it can accept zero-margin conversions.
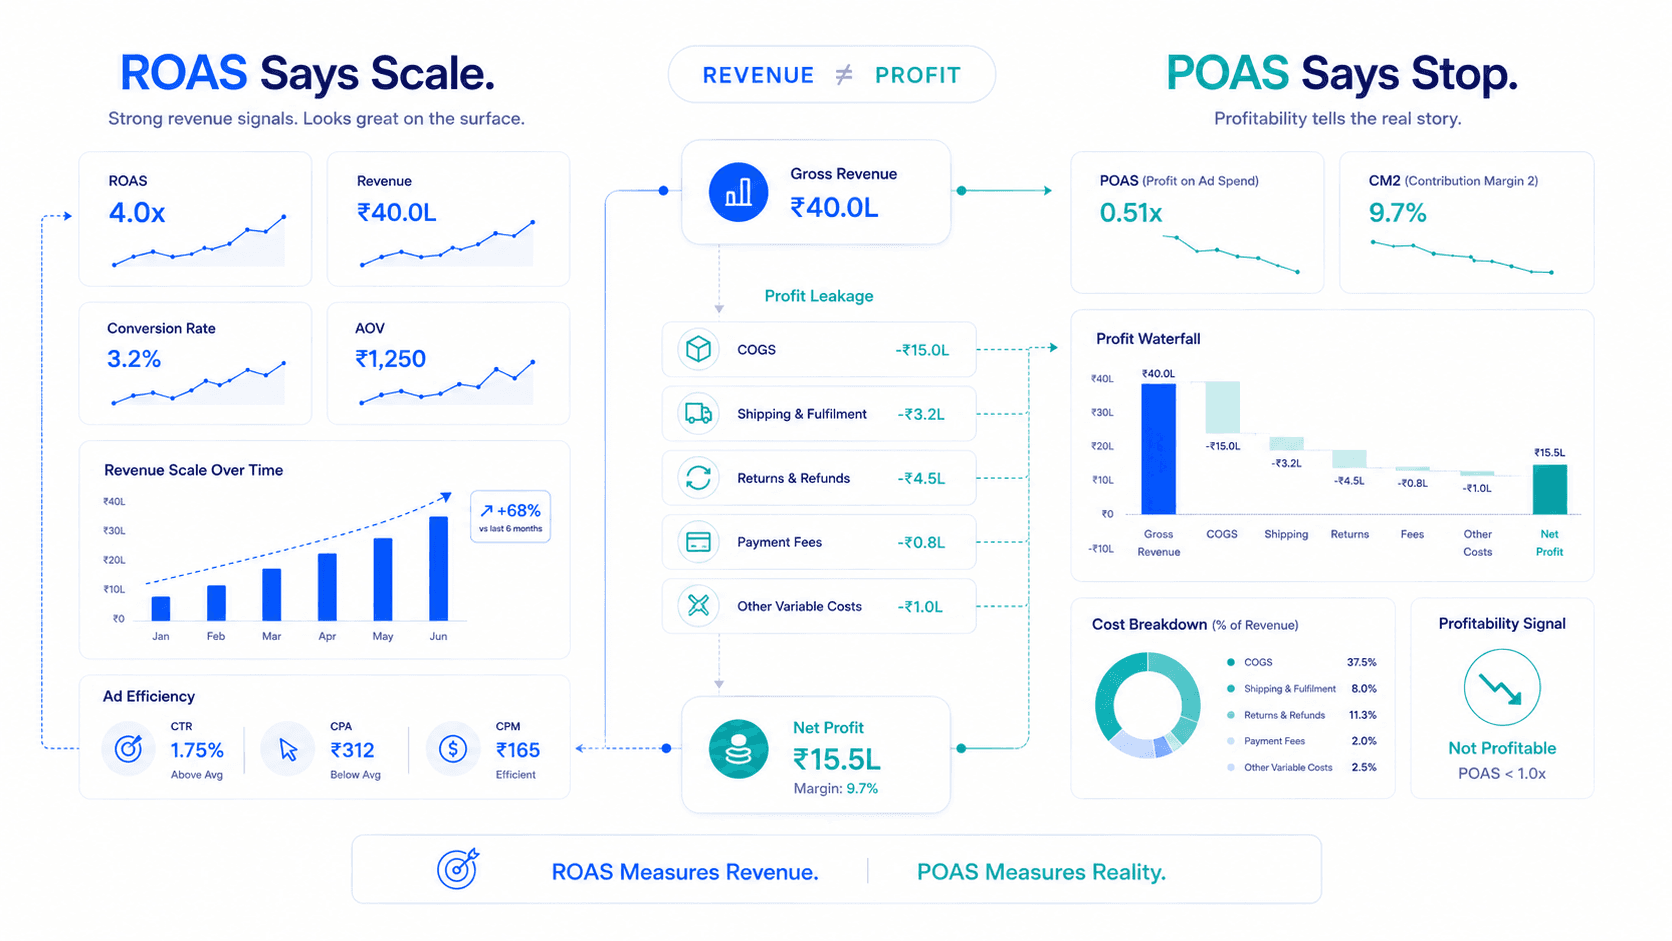
Flable calculates real-time POAS per campaign, which is the profitability metric that subsumes break-even ROAS. When POAS drops below 1.0, you're below break-even regardless of what ROAS shows. Flable makes this visible continuously, not just in weekly reviews.
Flable AI tracks real-time POAS per campaign. Below 1.0 means below break-even, whatever ROAS says.