Seasonal Playbook
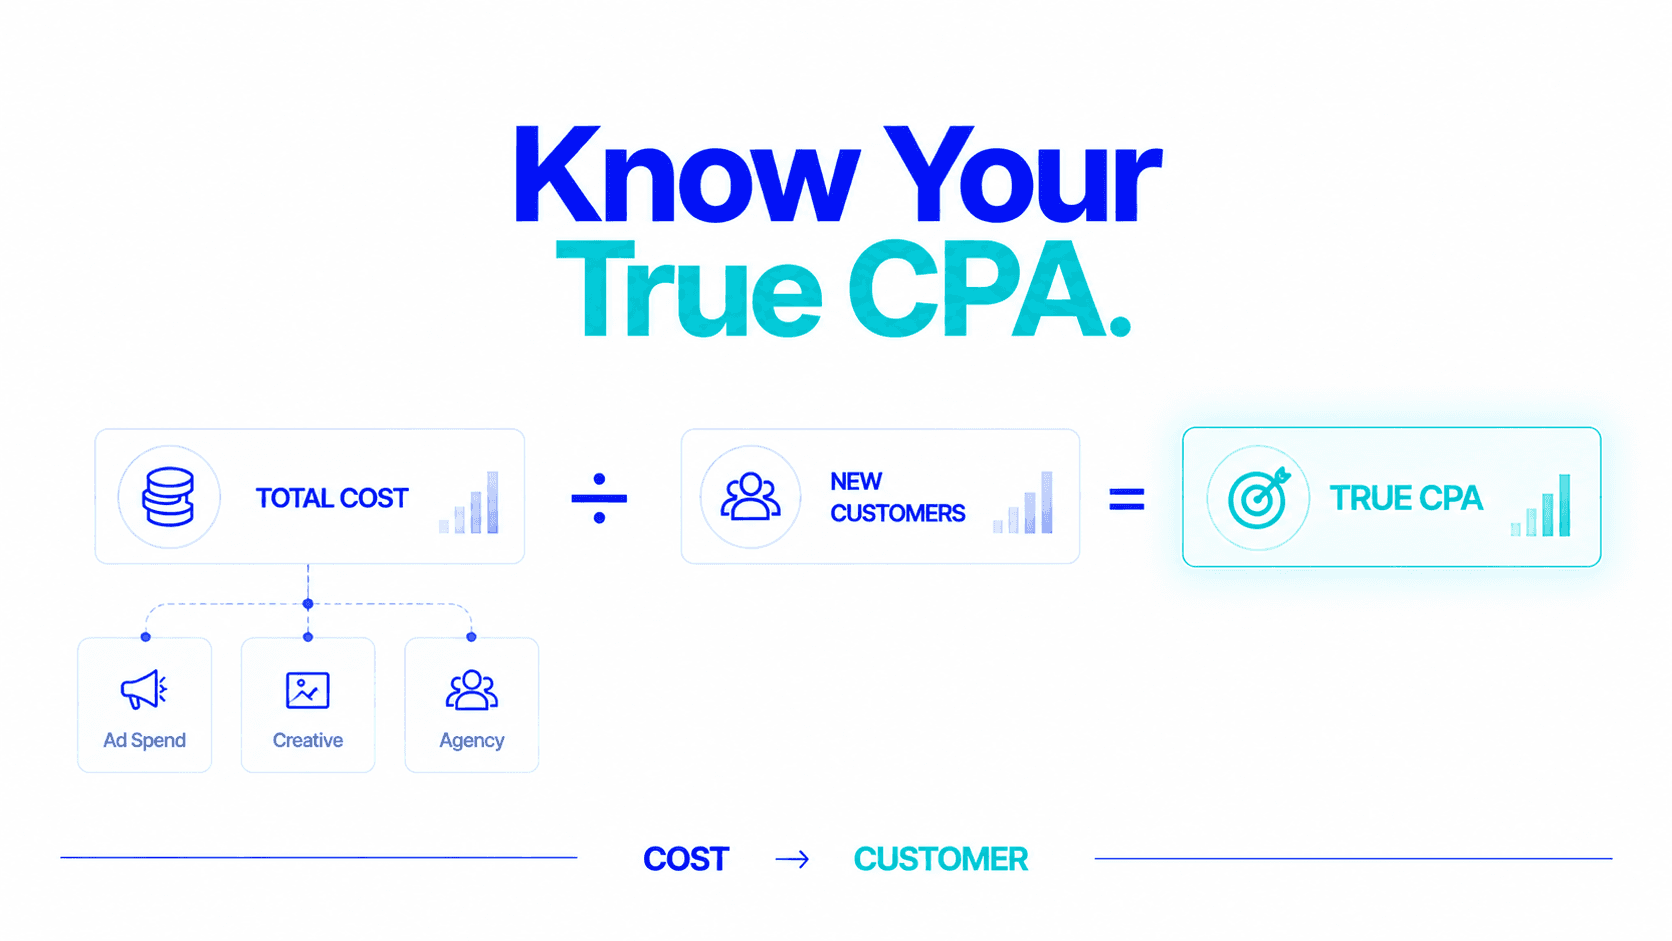
The CPA formula is simple.
Total Campaign Cost ÷ New Customers Acquired = Cost Per Acquisition.
Most D2C brands know the formula. Almost none of them use it correctly. And the gap between the CPA their Ads Manager shows and the true cost of acquiring a retained, profitable customer is where most D2C margin quietly disappears.
This is the complete guide: what CPA actually measures, what it misses, how to calculate it correctly for D2C, and the metric that should sit above it in your decision-making hierarchy.
Cost Per Acquisition is the amount spent to acquire one new customer or lead through a specific campaign or channel.
Standard CPA formula
CPA = Total Campaign Cost ÷ New Customers Acquired
Alternative formula
CPA = Cost Per Click (CPC) ÷ Conversion Rate
The second formula is useful for estimating CPA when you have platform data without aggregating total campaign costs. If your CPC is ₹18 and your landing page conversion rate is 4%, CPA = ₹18 ÷ 0.04 = ₹450.
This is where most D2C brands make the first mistake, using only ad spend as the total cost.
Include
Do not include
Using ad spend alone as your cost base understates true CPA by 20–40% for most D2C brands working with agencies or producing campaign-specific creative. Your “₹400 CPA” is likely a ₹520–600 full-cost CPA.
The CPA formula is structurally limited in two ways that make it insufficient as a standalone D2C metric.
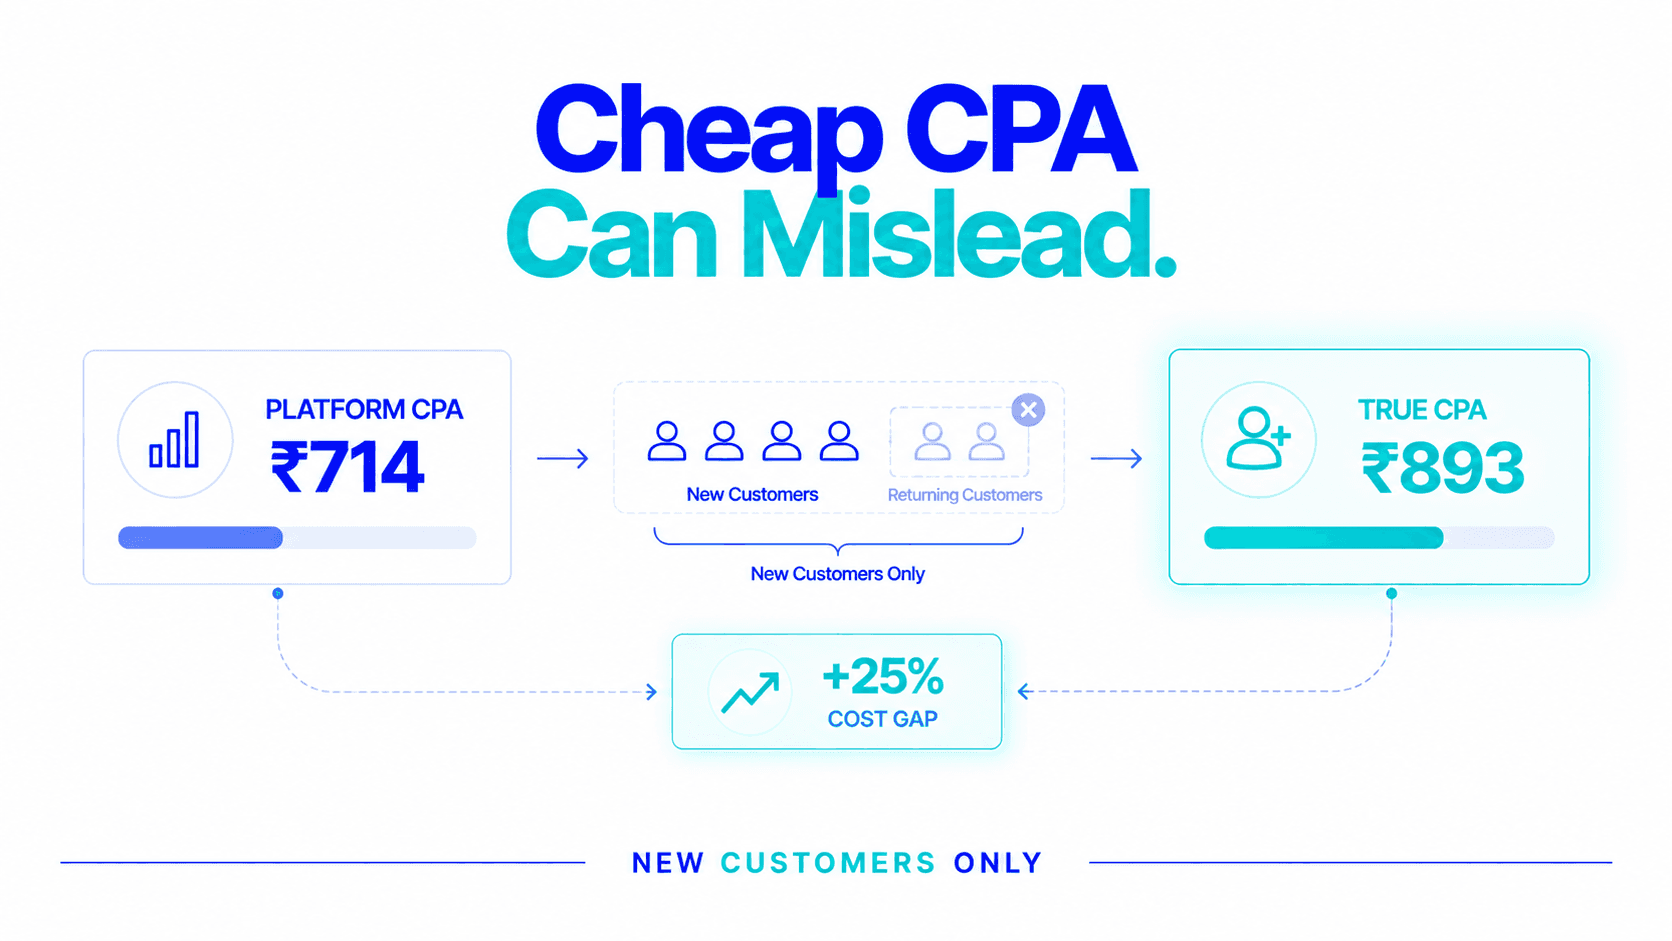
When you divide total campaign spend by total conversions, you’re including returning customers who converted through your campaign, customers who were going to buy again anyway and were simply captured by your paid campaign’s attribution window.
Returning customers convert at a fraction of the cost of new customers. Including them in your CPA denominator makes new customer acquisition look cheaper than it is.
True new customer CPA
True CPA = Prospecting Spend ÷ (Net New First-Time Buyers × (1 − Return Rate))
Platform-reported CPA
True CPA (20% return rate)
The platform CPA is understating your real acquisition cost by 25%. At scale, that gap is material.
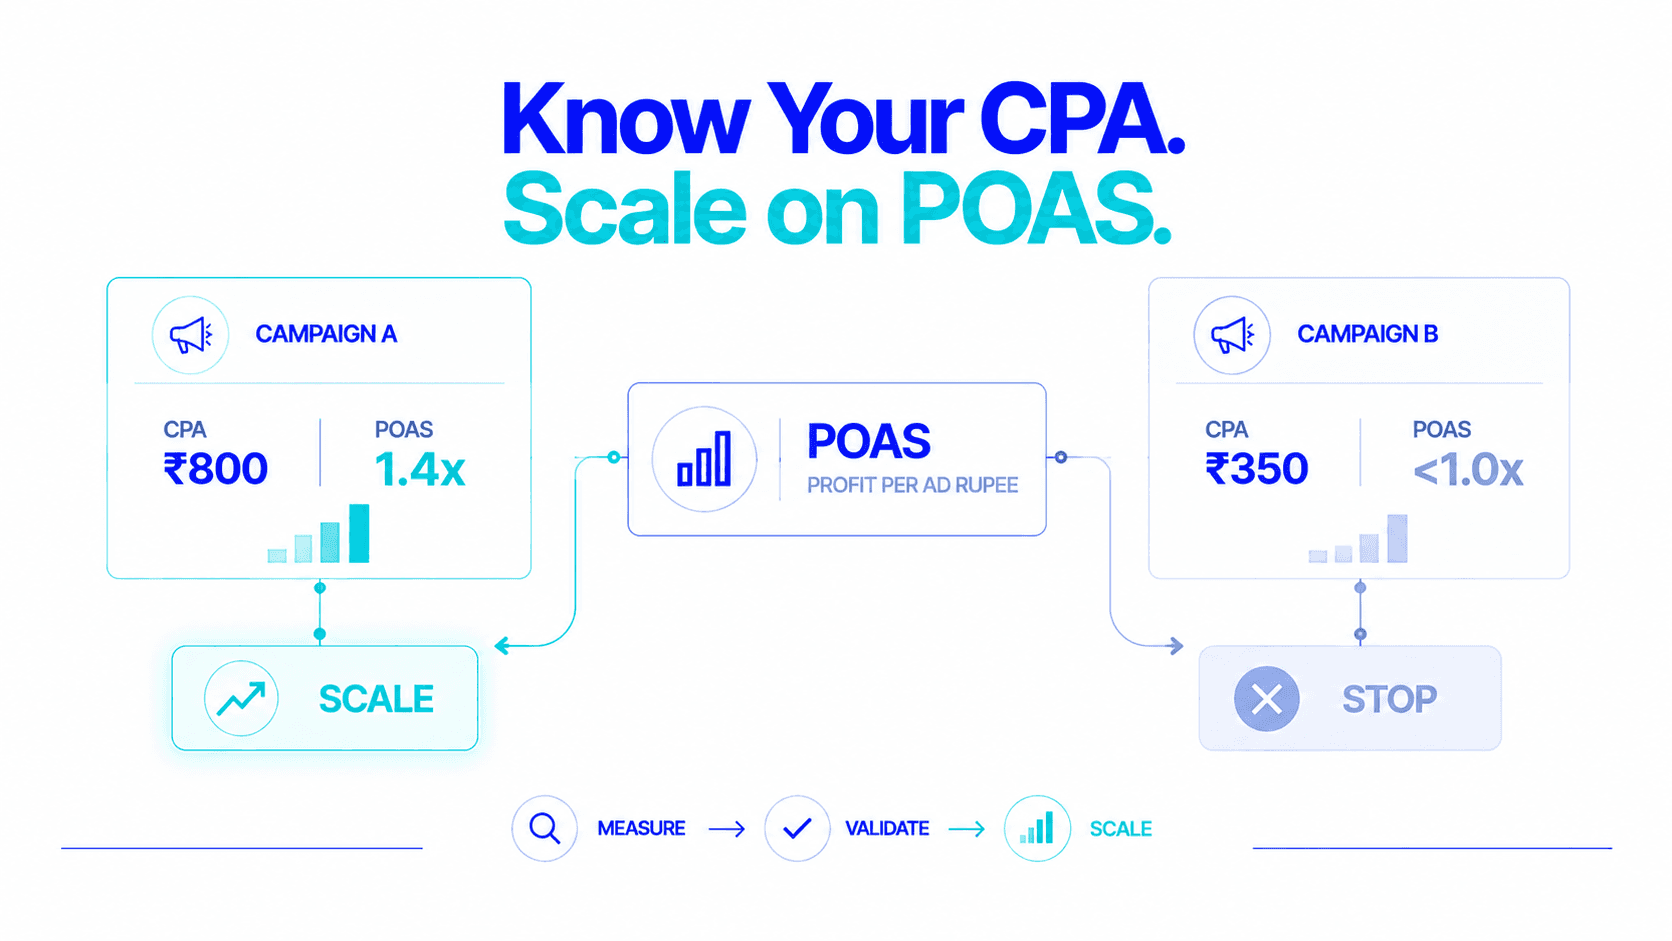
Two campaigns can have identical CPAs and completely different profitability outcomes.
Campaign A · CPA ₹800
Product with 65% gross margin, 5% return rate.
Campaign B · CPA ₹800
Product with 22% gross margin, 24% return rate.
CPA treats both campaigns identically. POAS (Profit on Ad Spend), the metric that accounts for COGS, returns, shipping, and payment fees, distinguishes them immediately.
Define the campaign and period
Choose the campaign (or channel) and exact date range. 30-day windows work well for campaign-level CPA; quarterly analysis is better for channel-level true CPA.
Sum all relevant campaign costs
Add: ad spend + agency fees + creative production + allocated marketing team time. This is your total campaign cost.
Count net-new customers only
From Shopify, filter orders in the period to first-time buyers only (Customer Type: New). Do not include returning customers who purchased through the campaign’s attribution window.
Apply return rate adjustment
Multiply net-new customers by (1 − first-order return rate for this campaign). New customers have higher return rates than the blended average, typically 5–8 percentage points higher for most D2C categories.
Divide
True CPA = Total campaign cost ÷ Return-adjusted net new customers.
Compare against LTV
CPA in isolation is meaningless. The number only has value relative to LTV (Lifetime Value). The standard benchmark: CPA should not exceed one-third of CLV.
If your 12-month LTV is ₹2,400, your CPA ceiling is ₹800. A CPA of ₹950 means you’re spending more than a third of the customer’s lifetime contribution on acquisition alone, leaving very little for COGS, fulfilment, and fixed costs.
These benchmarks are for true first-order CPA (ad spend only, not full-cost). Add 25–40% for full-cost CPA.
| Category | Strong CPA | Average CPA | Concern |
|---|---|---|---|
| Beauty / Skincare | <₹400 | ₹400–700 | >₹700 |
| Health / Supplements | <₹450 | ₹450–800 | >₹800 |
| Apparel / Fashion | <₹350 | ₹350–650 | >₹650 |
| Food & Beverage | <₹300 | ₹300–550 | >₹550 |
| Home / Lifestyle | <₹500 | ₹500–900 | >₹900 |
| Electronics | <₹700 | ₹700–1,200 | >₹1,200 |
Use your own historical CPA trend as the primary benchmark, category medians are directional, not targets. A CPA that’s 20% above the category average but acquiring customers with 2× the LTV is better business than a below-average CPA acquiring one-time buyers.
Rising CPA is almost always caused by one of two things:
Cause 1
More competition in the auction, higher CPMs, rising CPCs. The response: improve creative quality (which lowers CPM through better engagement rates) or expand targeting to reach less competitive audience pools.
Cause 2
Creative fatigue, audience saturation, or landing page issues. The response: refresh creative, test new audience segments, or diagnose landing page conversion rate for technical issues.
Check which is happening by comparing: did CPC rise? Or did conversion rate fall? Usually it’s one or the other. The diagnosis determines the fix.
A CPA that drops dramatically sometimes signals a problem rather than a win.
If CPA falls significantly, it might mean your campaigns are only reaching high-intent, bottom-of-funnel audiences, people who were going to buy anyway and whose purchase is being attributed to your ad. These customers were cheap to convert because they were essentially already converted.
Run an incrementality holdout. Pause the low-CPA campaign for two weeks and measure whether total Shopify revenue falls by what the campaign was attributing. If revenue barely drops, the campaign had poor incrementality. The CPA was reflecting easy attribution, not real acquisition.
This is the most important distinction in D2C performance measurement.
CPA tells you
An efficiency signal.
POAS tells you
A profitability signal.
POAS formula
POAS = Gross Profit ÷ Ad Spend
A campaign at ₹500 CPA with a strong POAS (1.4×) is a campaign to scale. A campaign at ₹350 CPA with a POAS below 1.0 is a campaign to kill, regardless of how good the CPA looks.
The correct decision hierarchy:
Is POAS above 1.0?
Profitable?
Is POAS above our target threshold?
Scale-worthy?
What is the CPA?
Efficiency signal within profitability.
CPA belongs in step 3, not step 1.
| Metric | Measures | Best used for |
|---|---|---|
| CPA | Cost per conversion event (campaign level) | Campaign efficiency diagnosis |
| CAC | Full cost of acquiring a customer (business level) | Business model health |
| ROAS | Revenue per ad rupee | In-platform bidding and creative testing |
| POAS | Profit per ad rupee | Scaling and killing decisions |
| LTV:CAC | Long-term value vs acquisition cost | Strategic channel allocation |
No single metric is sufficient. CPA without POAS doesn’t tell you whether the acquisition is profitable. ROAS without POAS tells you about revenue efficiency, not profit. POAS without LTV doesn’t tell you whether the acquisition is worth the margin it generates.
Use all five. Weight POAS most heavily in weekly decisions.
Audience refinement
Use your highest-LTV customer list (top 20% by 12-month spend) as the seed for Meta and Google Lookalike audiences. Better seed = better lookalike quality = lower CPA on higher-value customers.
Landing page conversion rate improvement
CPA = CPC ÷ CVR. Improving CVR from 2% to 2.8% reduces CPA by 28% without changing a single rupee of ad spend. Test: page load speed, social proof placement, above-the-fold clarity, size guides for fashion.
Prospecting/retargeting separation
When prospecting and retargeting share a budget pool, retargeting’s cheaper conversions inflate the denominator and make CPA look better than it is on prospecting. Separate them. Measure true prospecting CPA independently.
Return rate reduction
Returned orders cost you the acquisition spend with no retained customer. Reducing new customer return rate from 22% to 14% improves true CPA by approximately the same proportion as a 10% reduction in ad spend, without reducing spend at all.
Post-purchase sequence for second orders
CPA amortises across all orders from that customer. A customer who makes two orders at ₹800 true CAC has an effective CPA of ₹400 per order. Improving 90-day repeat purchase rate reduces the effective CPA per order from every acquisition campaign.
The CPA formula is straightforward. Using it correctly is harder, and using it as your primary decision metric is a mistake.
Know your CPA. But scale on POAS.
CPA = Total Campaign Cost ÷ New Customers Acquired. For D2C brands, true CPA should use prospecting spend only and adjust for return rates: True CPA = Prospecting Spend ÷ (Net New First-Time Buyers × (1 − Return Rate)).
CPA measures the cost of acquiring a customer through a specific campaign. CAC is the total cost of acquisition across all marketing and sales effort at the business level. CPA is campaign-level; CAC is company-level. For D2C, full-cost CAC includes ad spend, agency fees, creative production, and allocated team time.
Depends on category and LTV. For fashion, strong CPA is below ₹350. For supplements, below ₹450. For electronics, below ₹700. The true benchmark is your LTV:CAC ratio, CPA should not exceed one-third of 12-month LTV.
ROAS measures revenue per ad rupee. CPA measures cost per conversion. POAS measures profit per ad rupee. All three answer different questions. CPA is useful for efficiency diagnosis; POAS should drive scaling decisions. A campaign can have an acceptable CPA and an unprofitable POAS if product margins are thin.
Flable AI calculates return-adjusted CAC and POAS per campaign, so you see what acquisition cost and whether that cost was worth it.